SEC RPO Analysis: Are They Worth It?
SEC RPO Analysis: Are They Worth It?
When tuning into ball games or just covering the sport casually, there’s a fair chance fans have come across the phrase “Run-Pass Option” – or RPO, if you sit at the cool kid’s table. Keyed to run against light boxes (dive), skirt to available space (keep), to dish it out to an open outlet (pitch) – you might have heard of RPOs referred to as the modern day triple option.
In a primal sense, RPOs lean into the fundamentals of the game much like their multi-headed predecessors by focusing on blocking and tackling. But thanks to the pass element, more areas of the field can be tested as well as opposing DB’s brawn in space. Since the ball is designed to go where the defense presents the most vulnerabilities, these plays should inherently skew towards being more efficient down-to-down than other avenues.
RPOs can pester and prod. But even with their overall acceptance, are they worth it? In the constant discussion of maximizing consistency against potency, where do they fall? Do they help raise a scheme’s floor and ceiling? Are they overrated?
To start answering those questions, let’s take a step back and examine RPOs from a macro perspective. As someone who has charted every SEC offensive snap since 2018, luckily I have a good source of data for such a study. One year of numbers just isn’t as sturdy as four, yanno? Plus, we can get really nitty gritty with concepts later.
(To optimize graphics and stat tables, flip device horizontally)

Looking at the SEC’s cumulative 4-year composite averages, RPOs have a clear effect boosting offense’s Success Rate. The overall clip was nearly 2-points below in comparison. And backing the basis these designs aim to avoid mess, RPOs suffer from far less boo boos than other plays. While about one out of every five logged a form of havoc, other plays experienced adversity on nearly a third of those snaps. In short, quick-hitting throws neutralize pass rushers and more spread-out opponents recorded less losses. Moreover, behind the advantageous reps, ball carriers consistently saw their Yards/Carry inflated – including both before and after contact. That’s a pretty important residue from a tactic that has been 72% run since 2018. Generally, progressing forward without many backsteps is a decent modus operandi. And RPOs appear to scratch that itch according to our composite metrics.

But while the primary facet satisfies, the pass game wasn’t gifted much pep. Not only does the cumulative Yards/Pass hover almost a half-yard over the RPO clip, other throws were practically twice as likely to produce an explosive pass (20 yards or more). For the average SEC offense, Passing Success Rate was helped by more gimmes. But, the returns seemed to fall well-below expectation according to the cumulative average. And with more big gainers through the air on more volume, other throws’ overall adjusted opportunity rating trumped RPO ones 3.0 to 2.8. Even with the run game carrying the water and providing moderate value, per-play opportunity favors other designs thanks to the aerial upside.
Okay, we’re on the right track. But, we need a closer peak to stabilize our initial findings. Zooming inward and looking at individual QBs, most of what our cumulative stats told us hold firm. The average SECer logged considerably less passing potency when targeting RPOs over other designs. The pool Y/A was almost a yard-and-a-half lower (6.5 vs 7.9) and the respective ExPass% remained dwarfed even with true screens watering down the numbers. Part of why dropbacks lost juice revolves around the low-bar throws RPOs tend to lean on. The typical average depth of target was only 3.3 yards compared to other snaps’ 10.4 clip. Captain Obvious wanted me to remind you explosives are more achievable targeting deep than behind the line of scrimmage. However, with much shorter throws, accurate attempts – and subsequently completions – were easier to come by. That aspect paired with increased reliance on pre-snap processing saw defenders have a much harder time forcing mistakes.
| ADOT | Comp% | Acc% | Y/A | Success% | 1D+TD% | Unc+INTA% | |
| RPO Throws | 3.3 | 75.9% | 71.2% | 6.5 | 51.3% | 32.9% | 14.8% |
| Other Throws | 10.4 | 60.5% | 58.0% | 7.9 | 45.1% | 35.9% | 27.1% |
Undercut, the average SEC opponent allowed a 27.1% Uncatchable+Interceptable Pass Rate defending non-RPOs compared to a 14.8% figure against triple-headers. And since less passes were biffed and more found their intended targets, QBs tended to capture better down-to-down success. Debunking our aforementioned notion that RPOs failed to abundantly help a team’s Passing Success Rate, the pool clip lofted over the golden plateau seeing over half of these targets work – dramatically different than what our previous returns teased. Again, this happenstance should make sense. The ripchord should only be pulled when a target has a clear and apparent edge. Still even with the improved Success Rate, the adjusted opportunity rating still firmly favored non-RPO throws on a per-play basis (3.3 vs 3.6). Plus, those snaps’ First Down+TD Rate was exactly 3 points better in comparison thanks to more downfield tries.
Our macro findings were somewhat steady when examining individual ball carriers under the microscope. Rushers received more cushion, pushed more tacklers backwards, and suffered less losses on average. Though our 4-year clip from the team-level said those things didn’t help explosiveness, common sense prevailed in this context. The typical runner saw 15.4% of his RPO carries go for at least 10 yards compared to 14.9% of tries on other designs. Additionally, rushers displayed more tenacity as the respective Broken Tackle Rates differed by more than a whole point.
| Y/A | YBC AVR | YAC AVR | Broken Tackle% | Success% | 1D+TD% | Neg% | |
| RPO Runs | 5.5 | 2.4 | 3.1 | 28.9% | 44.8% | 27.1% | 8.3% |
| Other Runs | 5.2 | 2.3 | 2.9 | 27.8% | 47.3% | 30.9% | 9.8% |
Despite the gains and provided edges, however, ordinary ground game miscues prevented desired consistency. While passes can work if as little as 3 players don’t fudge up, runs require a lot more cohesion and collective effort in order to prevail. Unlike what our macro metrics told us, the pool Success Rate soured compared to non-RPO reps – 44.5% vs 47.3%. And like their counterparts, Run RPOs’ pool First Down+TD Rate finished 3 points behind the figure from others. And when measuring adjusted opportunity cost, it’s as close as it can be – 2.47 vs 2.46 slightly in favor of the modern day triple option compared to not.
| Non-RPO Y/R | RPO Y/R | RPO Y/P | Non-RPO Y/P | Non-RPO OVR Success% | RPO OVR Success% |
| 5.2 | 5.5 | 6.5 | 7.9 | 46.1% | 46.7% |
In short, the plan of stressing opponents sideline-to-sideline via RPOs raised the ceiling of runs and the floor of passes at the expense of ground consistency and aerial potency. But on an opportunity basis, the stats say exploring old-school approaches appear to be preferable. There are certain exceptions. A ground-heavy offense should explore Eddie Harris-esque wrinkles in an attempt to maximize chances. And, not every program can recruit a bonafide gunslinger. RPOs can facilitate offerings, pad box scores, and don’t require standout capabilities to execute. Leaning into dependable outcomes might be considered basic and have a conservative bent. Guaranteed 5-yard chunks aren’t sexy yet can win ball games. That said, downfield throws will always be more impactful. Even if the average RPO throw nets more efficiency than any run, its own clip still noticeably trails output from a typical non-RPO pass attempt.
RPO Schemes (since 2020)
Best Benefactors (Dual Concepts):
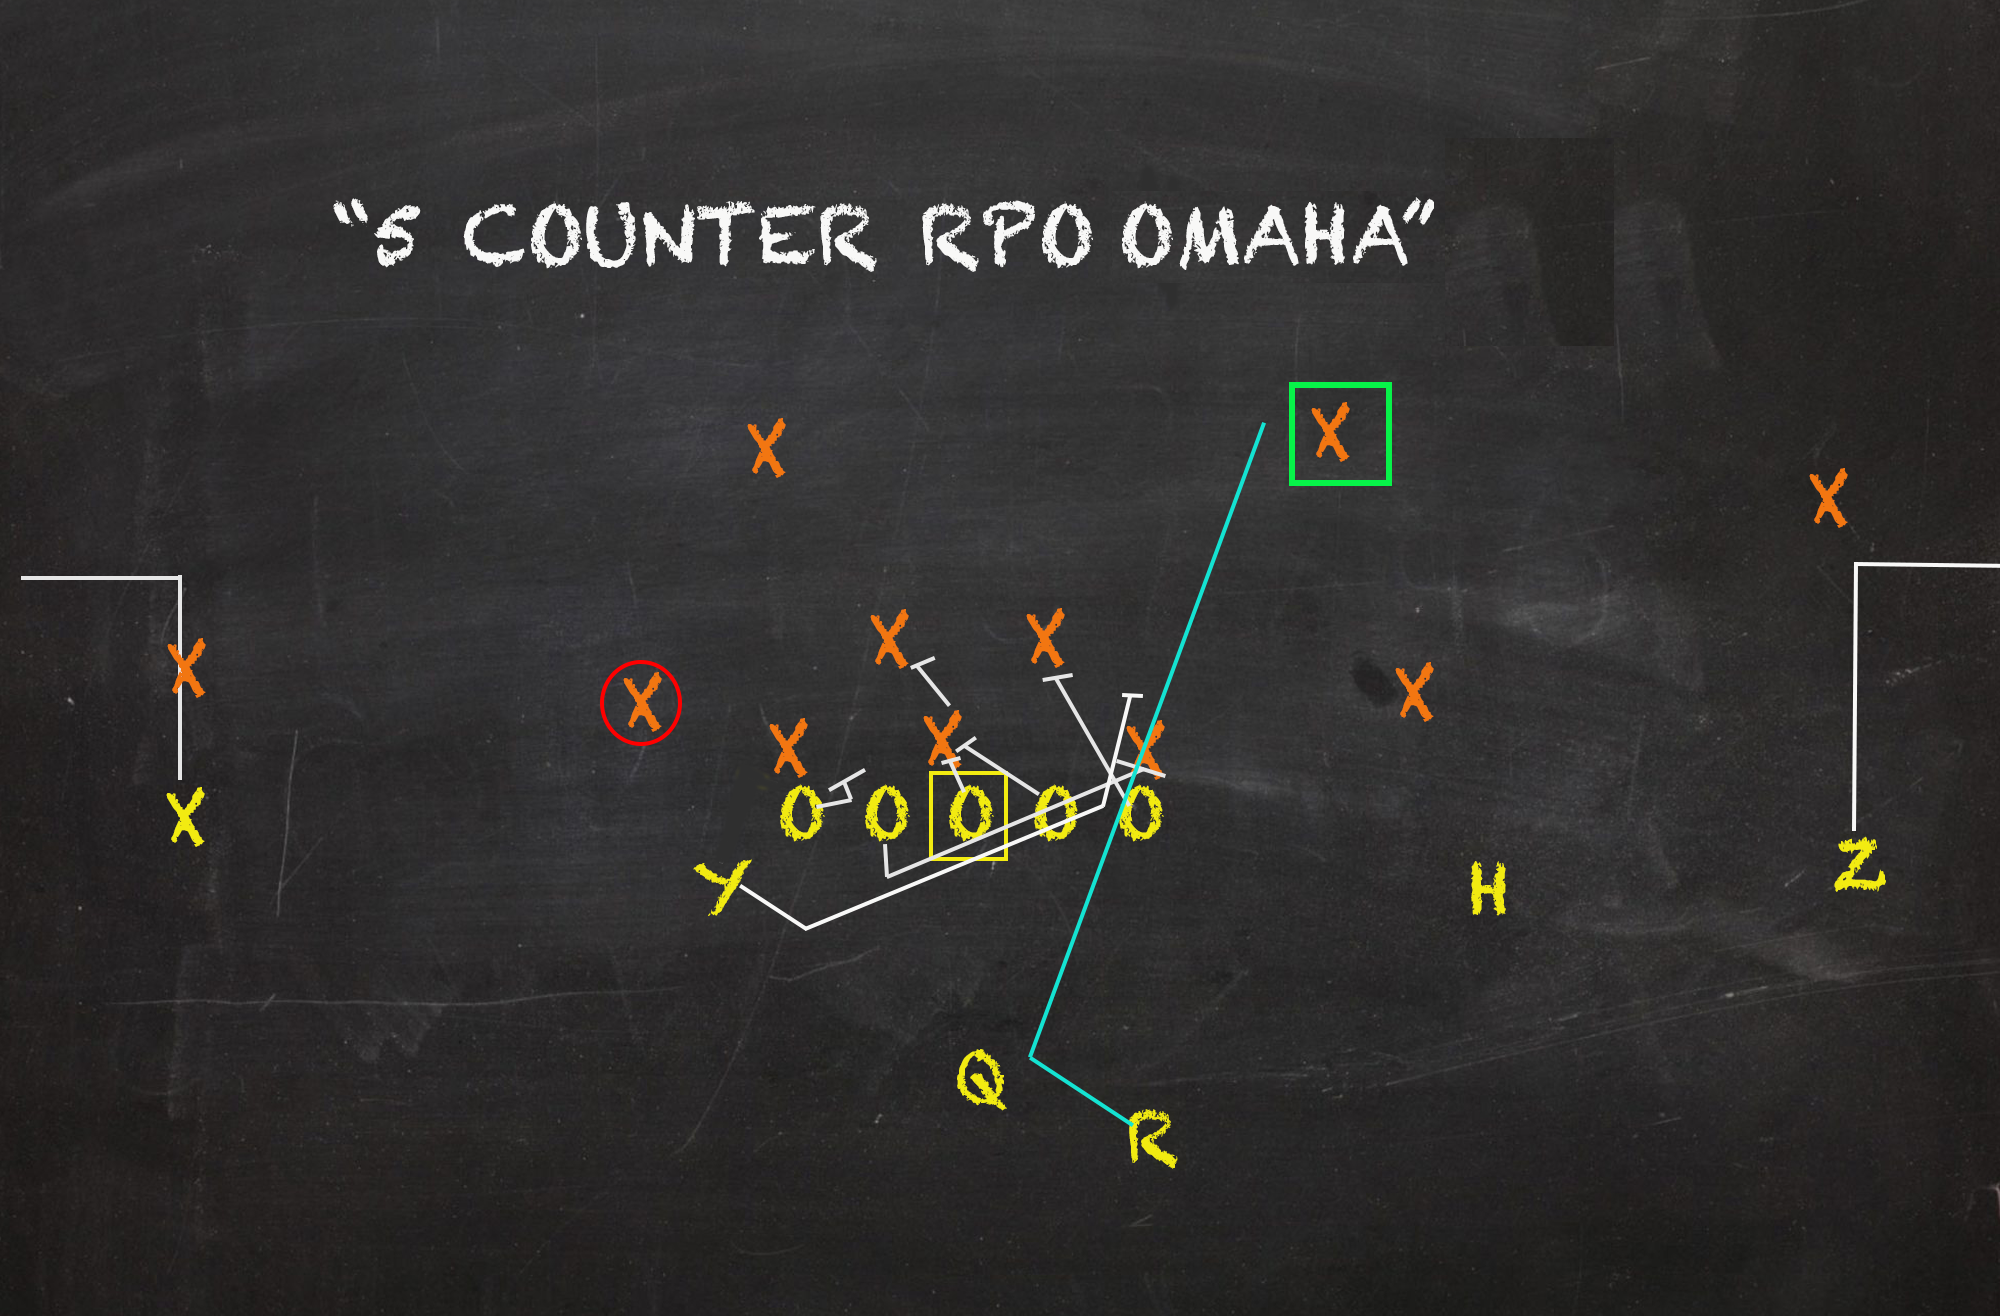
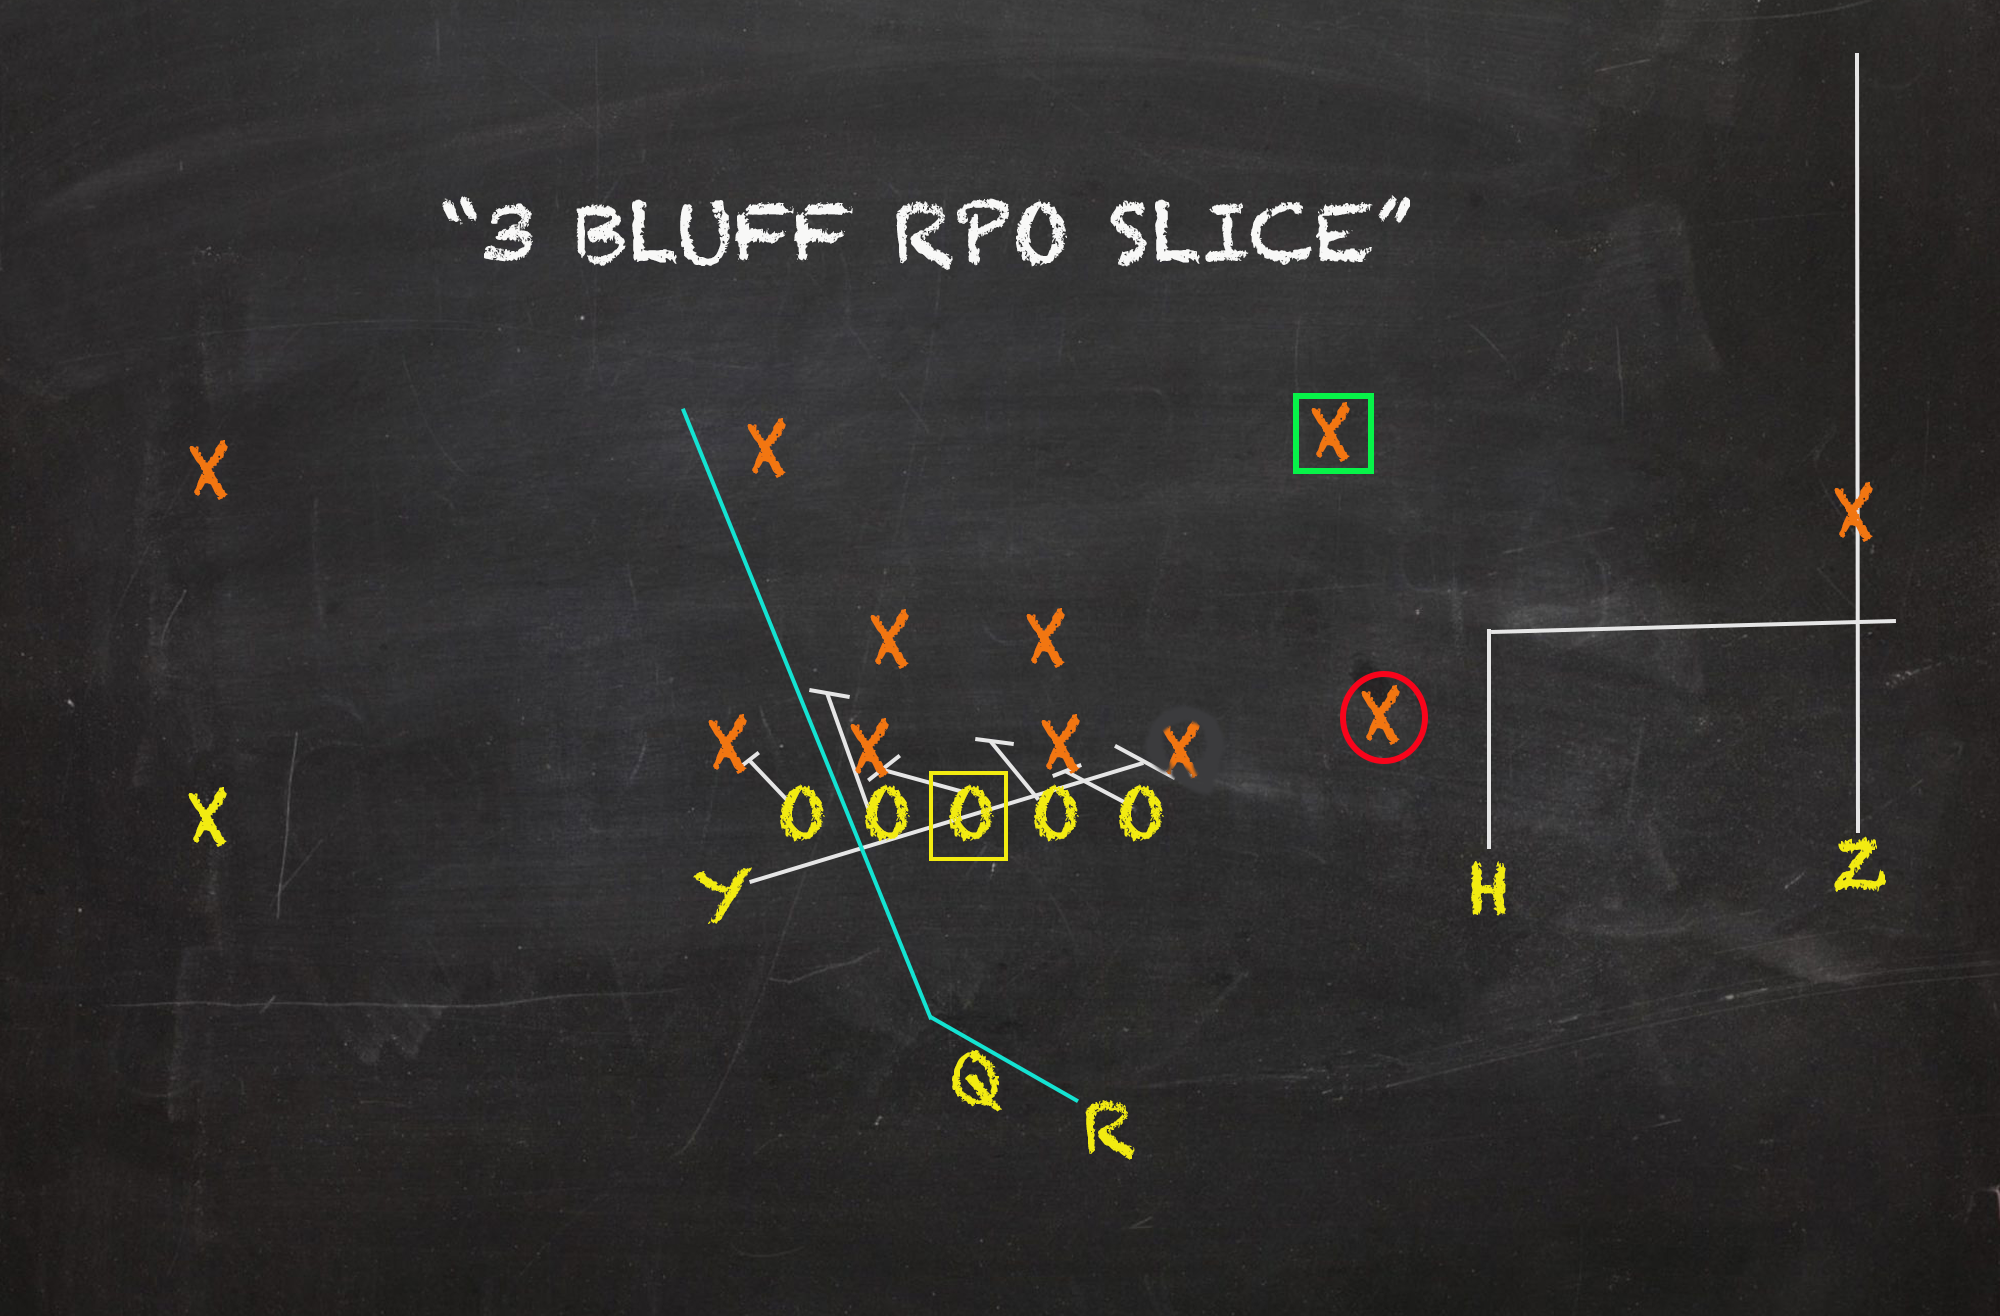
Quick Out Route Combos (Ohio/Slice and Omaha)
| Targets | Yards/Target | Success Rate |
| Concept with RPO | 6.9 | 66.3% |
| Concept w/o RPO | 5.9 | 48.9% |
Most RPOs are drawn up to test both sides of the formation. If the run is going one direction, the tag should make key defenders pay should they abandon their coverage or fill responsibilities. When opponents have devoted an extra body into the box – predominantly deploying single-high shells – man-taxing routes like outs have been an effective thorn to annoy adversaries. Either targeting a solo perimeter receiver or a vert+out combo, this concept group has found success on practically two-thirds of its RPO targets, which is nearly 20 percentage points higher than other pass reps. Not to mention, RPO tries averaged a whole yard more. While just outside the top13 pass concepts in adjusted opportunity rating with a 3.2 mark, RPO targets the last 3 years have birthed a robust 4.6. Again, natural winners against sagging man or zone cushion, out combos are no-brainers to pair with runs. The results matching sound spacial theory is nice to see.
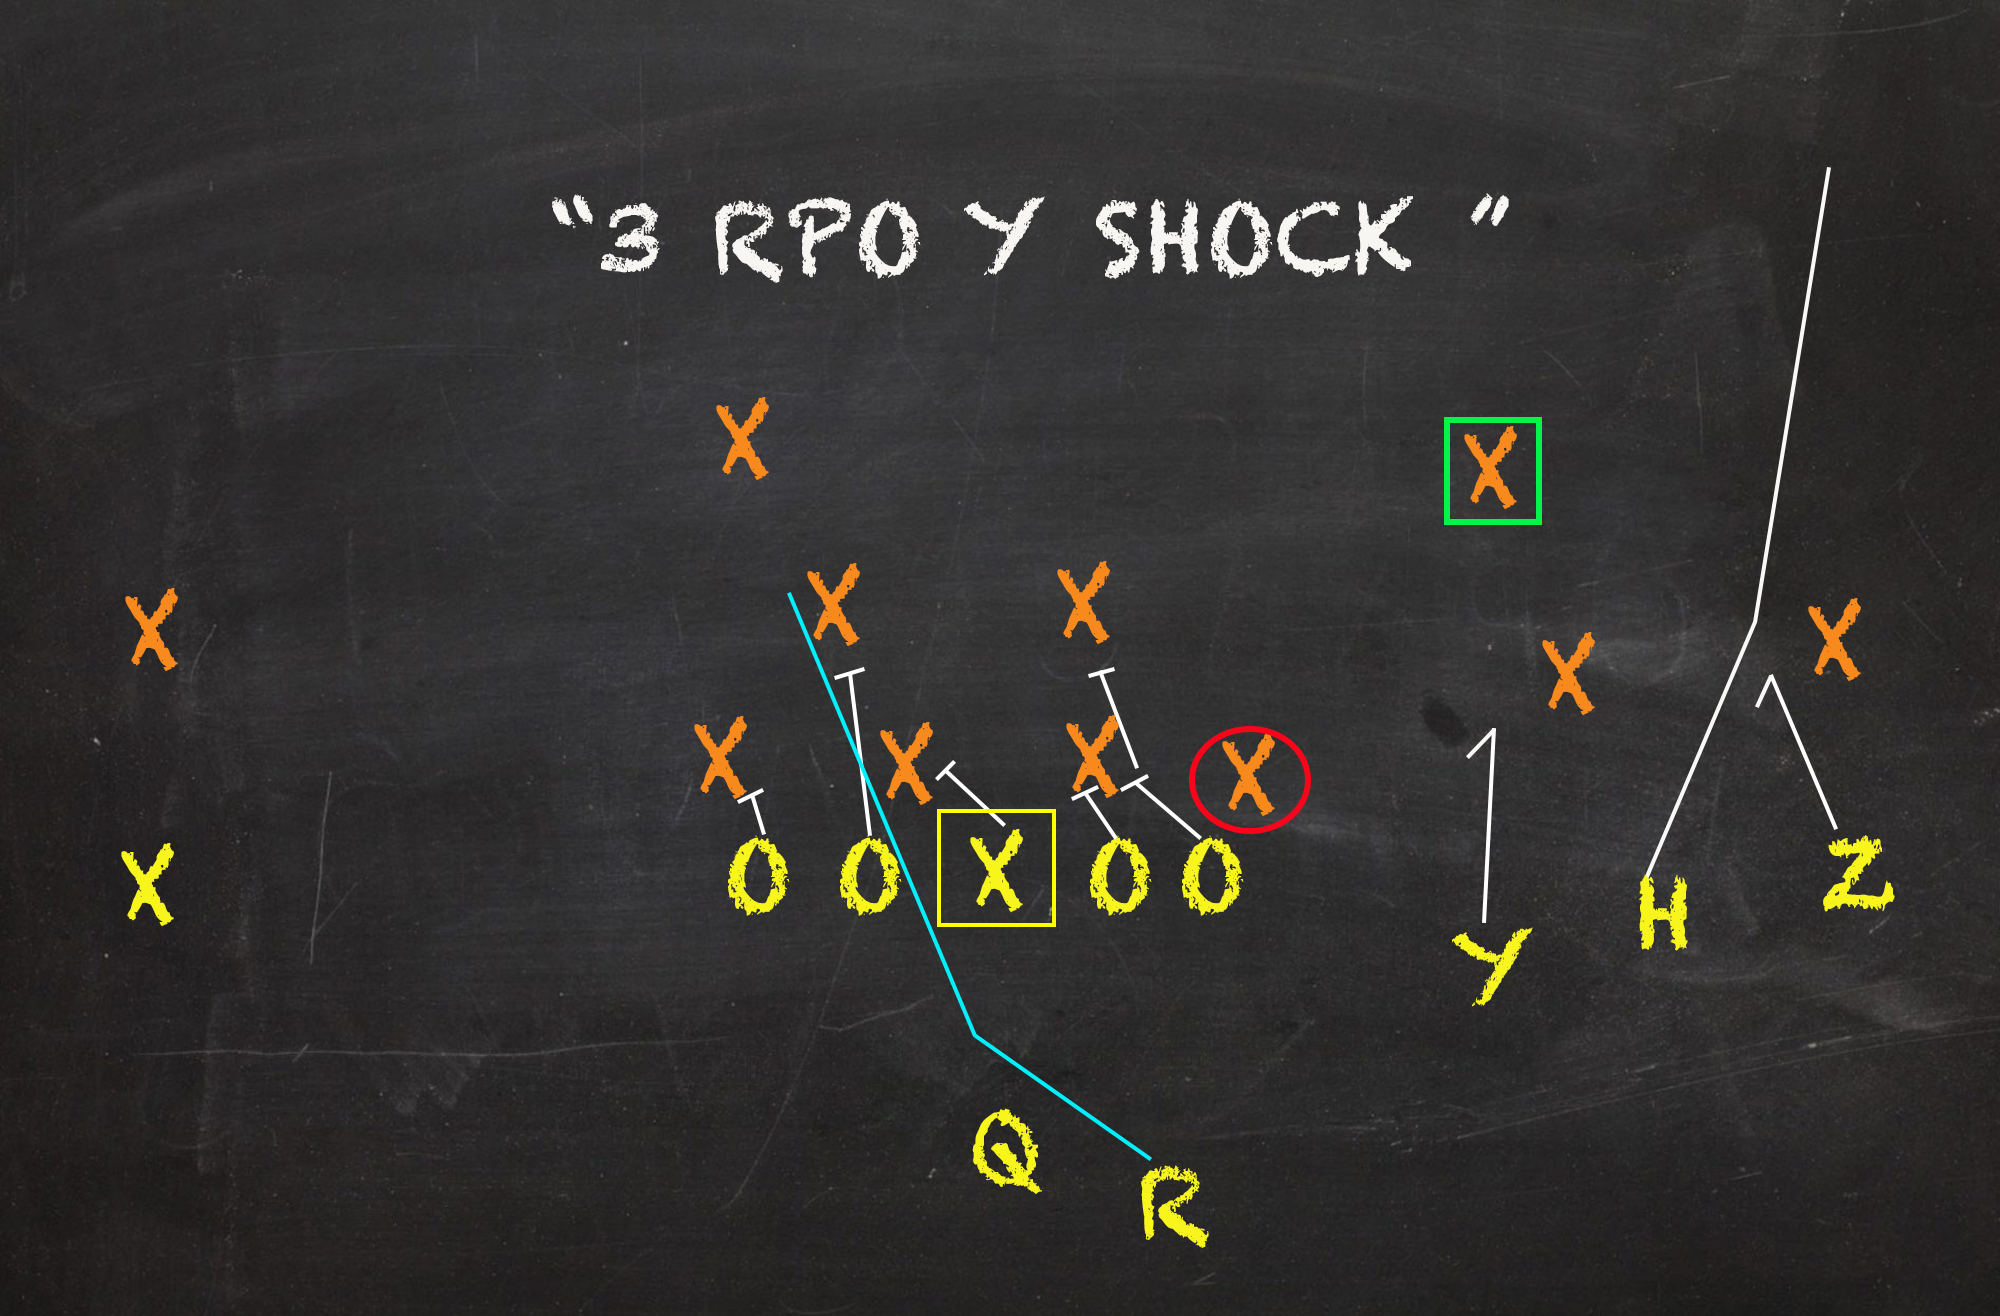
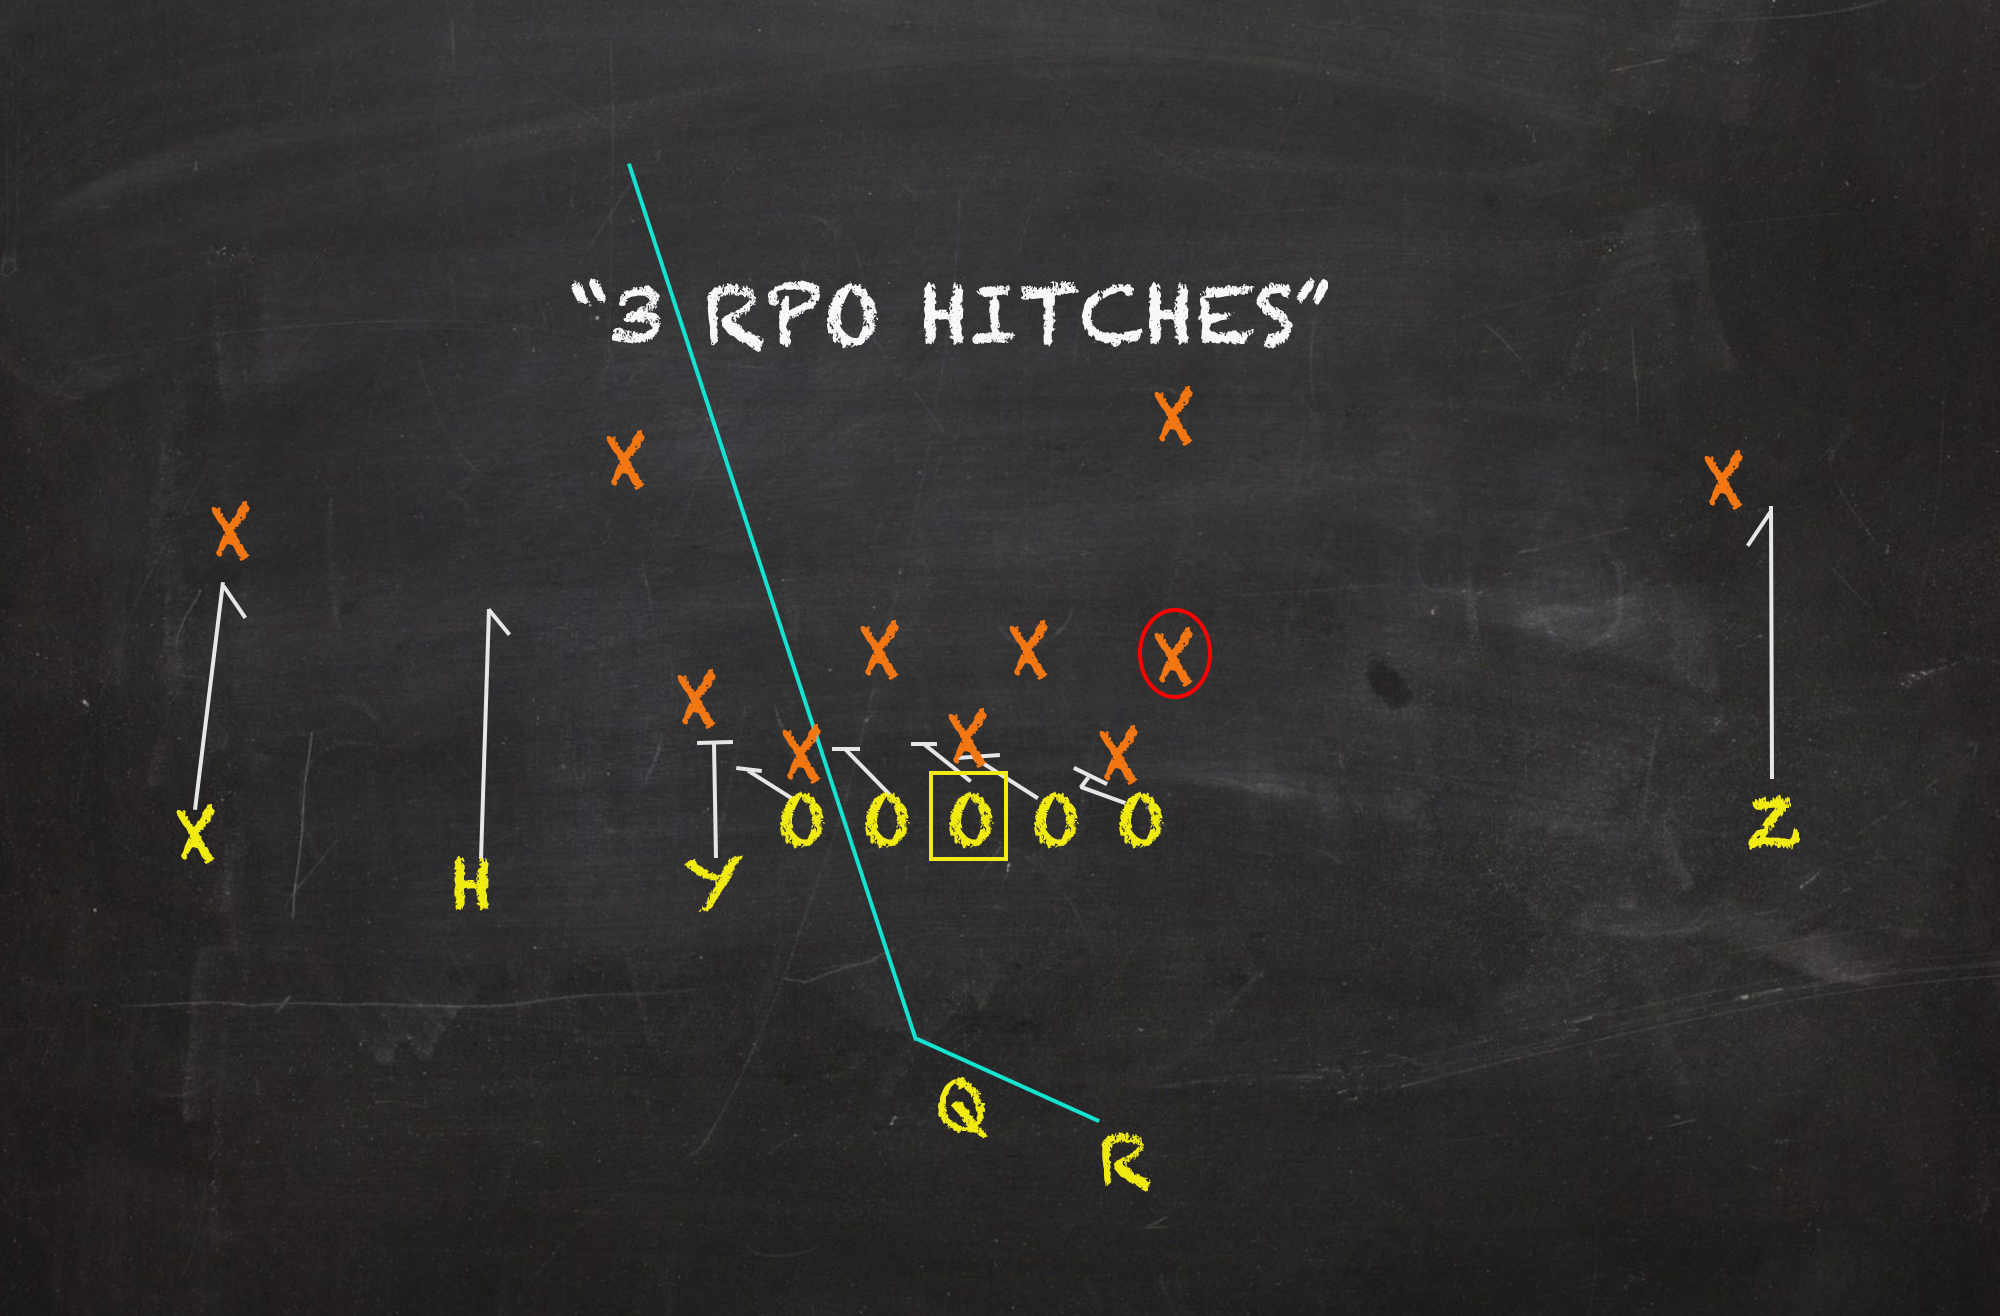
Stationary Hitch Route Combos (Stick Variations and All Curls)
| Targets | Yards/Target | Success Rate |
| Stick Variations with RPO | 5.6 | 54.7% |
| Stick Variations w/o RPO | 5.0 | 44.1% |
| All Curls with RPO | 7.1 | 63.6% |
| All Curls w/o RPO | 6.2 | 51.3% |
While these concepts aren’t too special when coupled with motion or eye candy, these looks provide quintessential pitch-and-catch attempts for passers. With the run action threatening the box and commanding attention, multiple underneath hitches force foes either to stay honest and allow light inlines or risk a dink and dunk catch that’ll likely keep the offense ahead of the chains. Stick Variations worked on over half of its RPO reps; but by themselves, All Curl targets produced a 4.4 adjusted opportunity rating, which would qualify for top8 among concepts including all reps since 2020. To reiterate, a Success Rate past 60% is awfully hard to achieve even if what is asked is anything but, which is the case on these patterns. Run upfield, turn around, and if they leave you alone, you’ll get the ball quickly. A simple but unequivocally fruitful idea that any offense can incorporate into its operation.
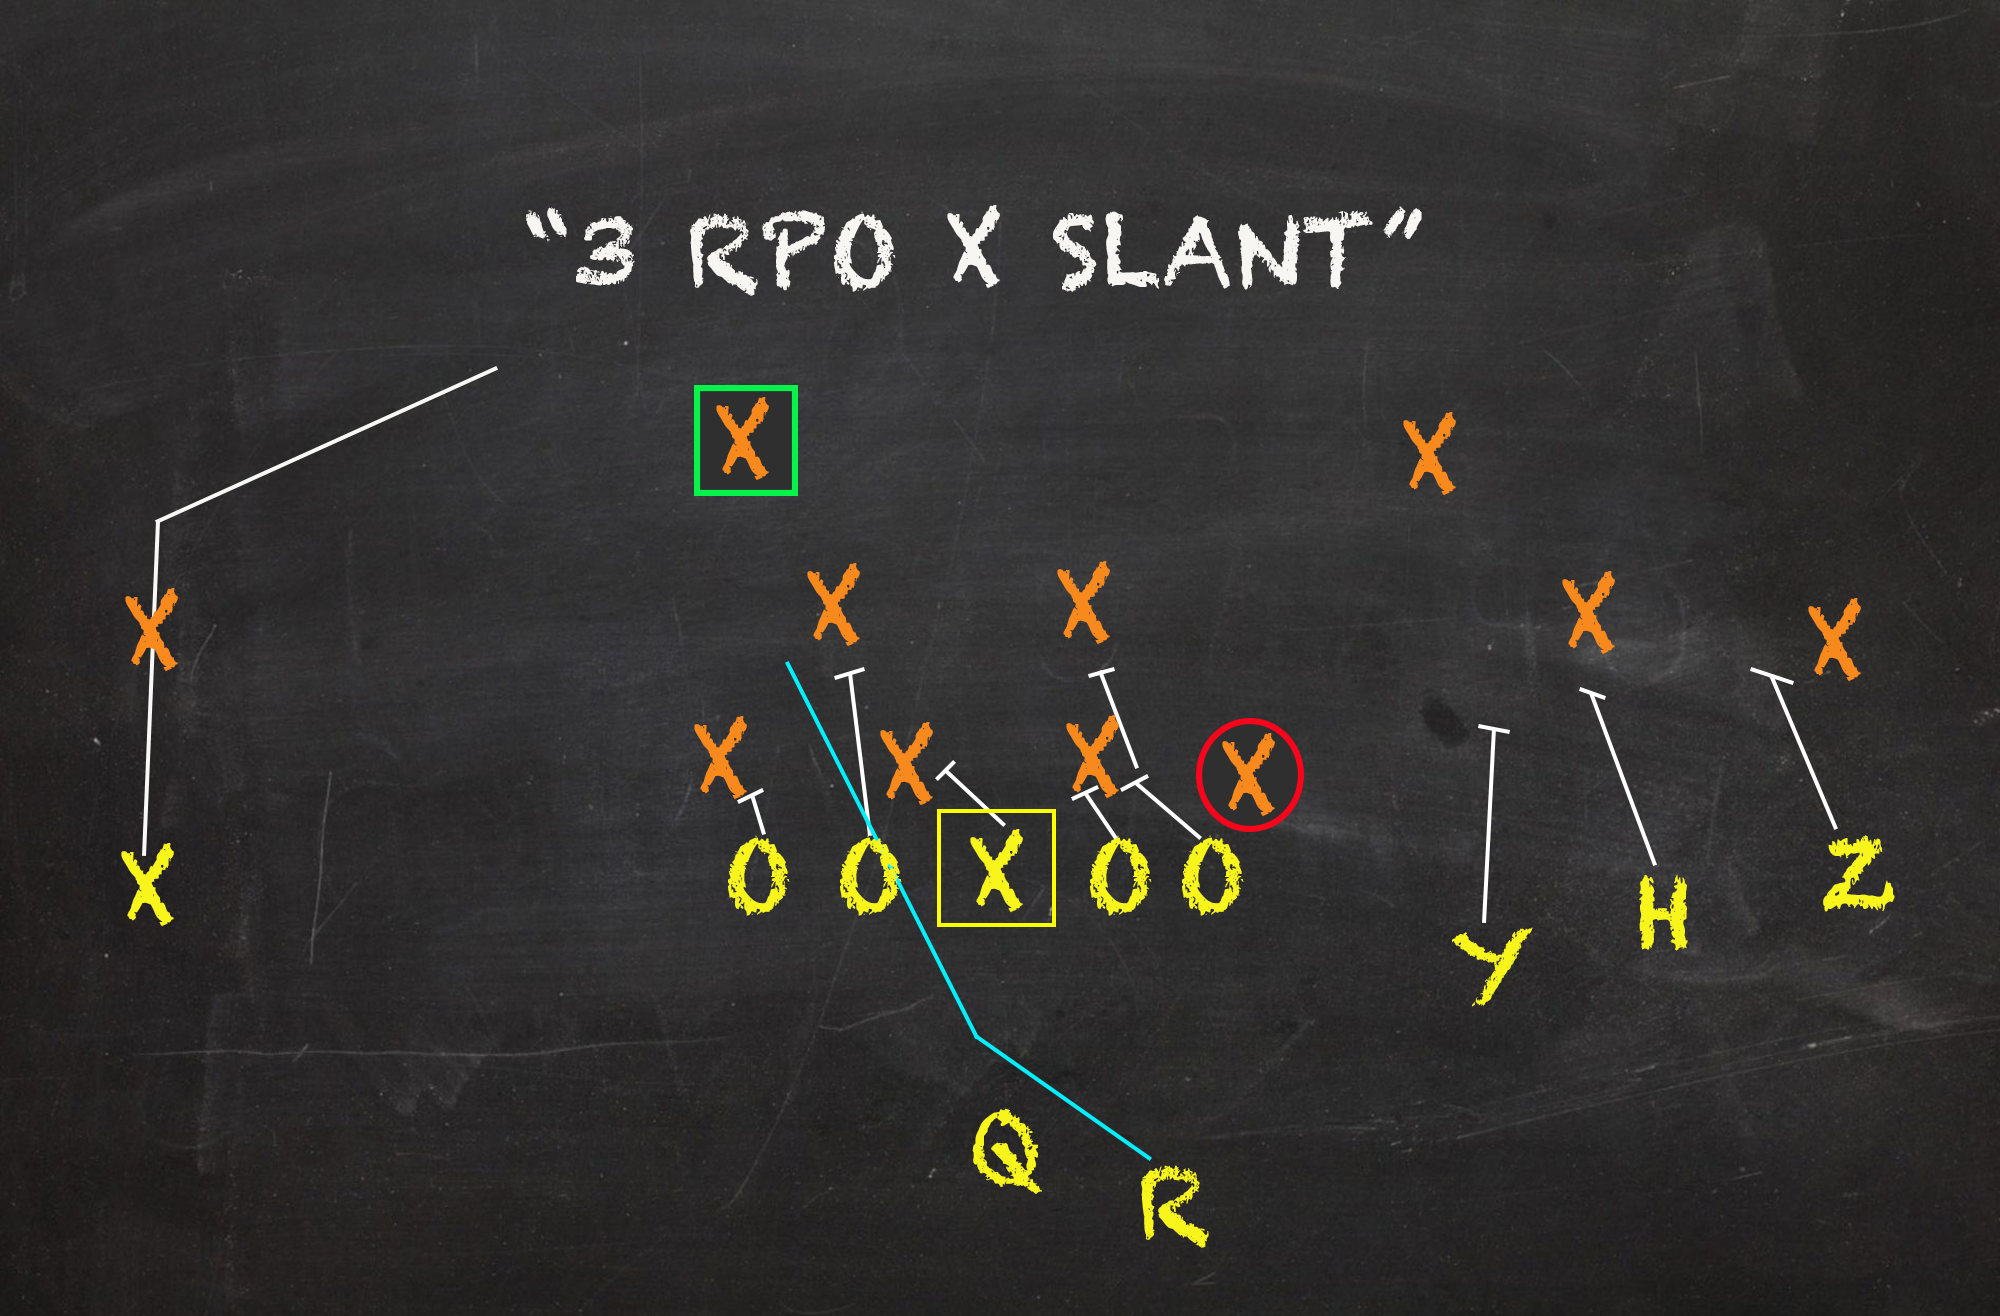
Slant Variations
| Targets | Yards/Target | Success Rate |
| Concept with RPO | 7.3 | 50.7% |
| Concept w/o RPO | 6.1 | 49.4% |
Another single-high stresser, this concept family has been the most explosive tag. The casual fan probably doesn’t have to think too hard to recall an example of an untouched glance post (aka solo slant) birthing a long tuddy. Often keyed on a collapsing safety from a two-deep shell, our route travels right towards the vacated space beyond the sticks. And while not asking too much of passers, it rewards burners with a prime chance to make a play. No other RPO concept generated a better Y/A than Slant Variations 7.3 figure. But since the family is a rudimentary aspect apart of many patterns, there wasn’t too much separation in terms of Success Rate overall. Still, defined RPO targets have brought about the highest clip in that department since 2020 - a grand feat, no doubt.
Y-Insert
| Rushes | Yards/Carry | Success Rate |
| Concept with RPO | 5.8 | 52.9% |
| Concept w/o RPO | 4.5 | 40.8% |
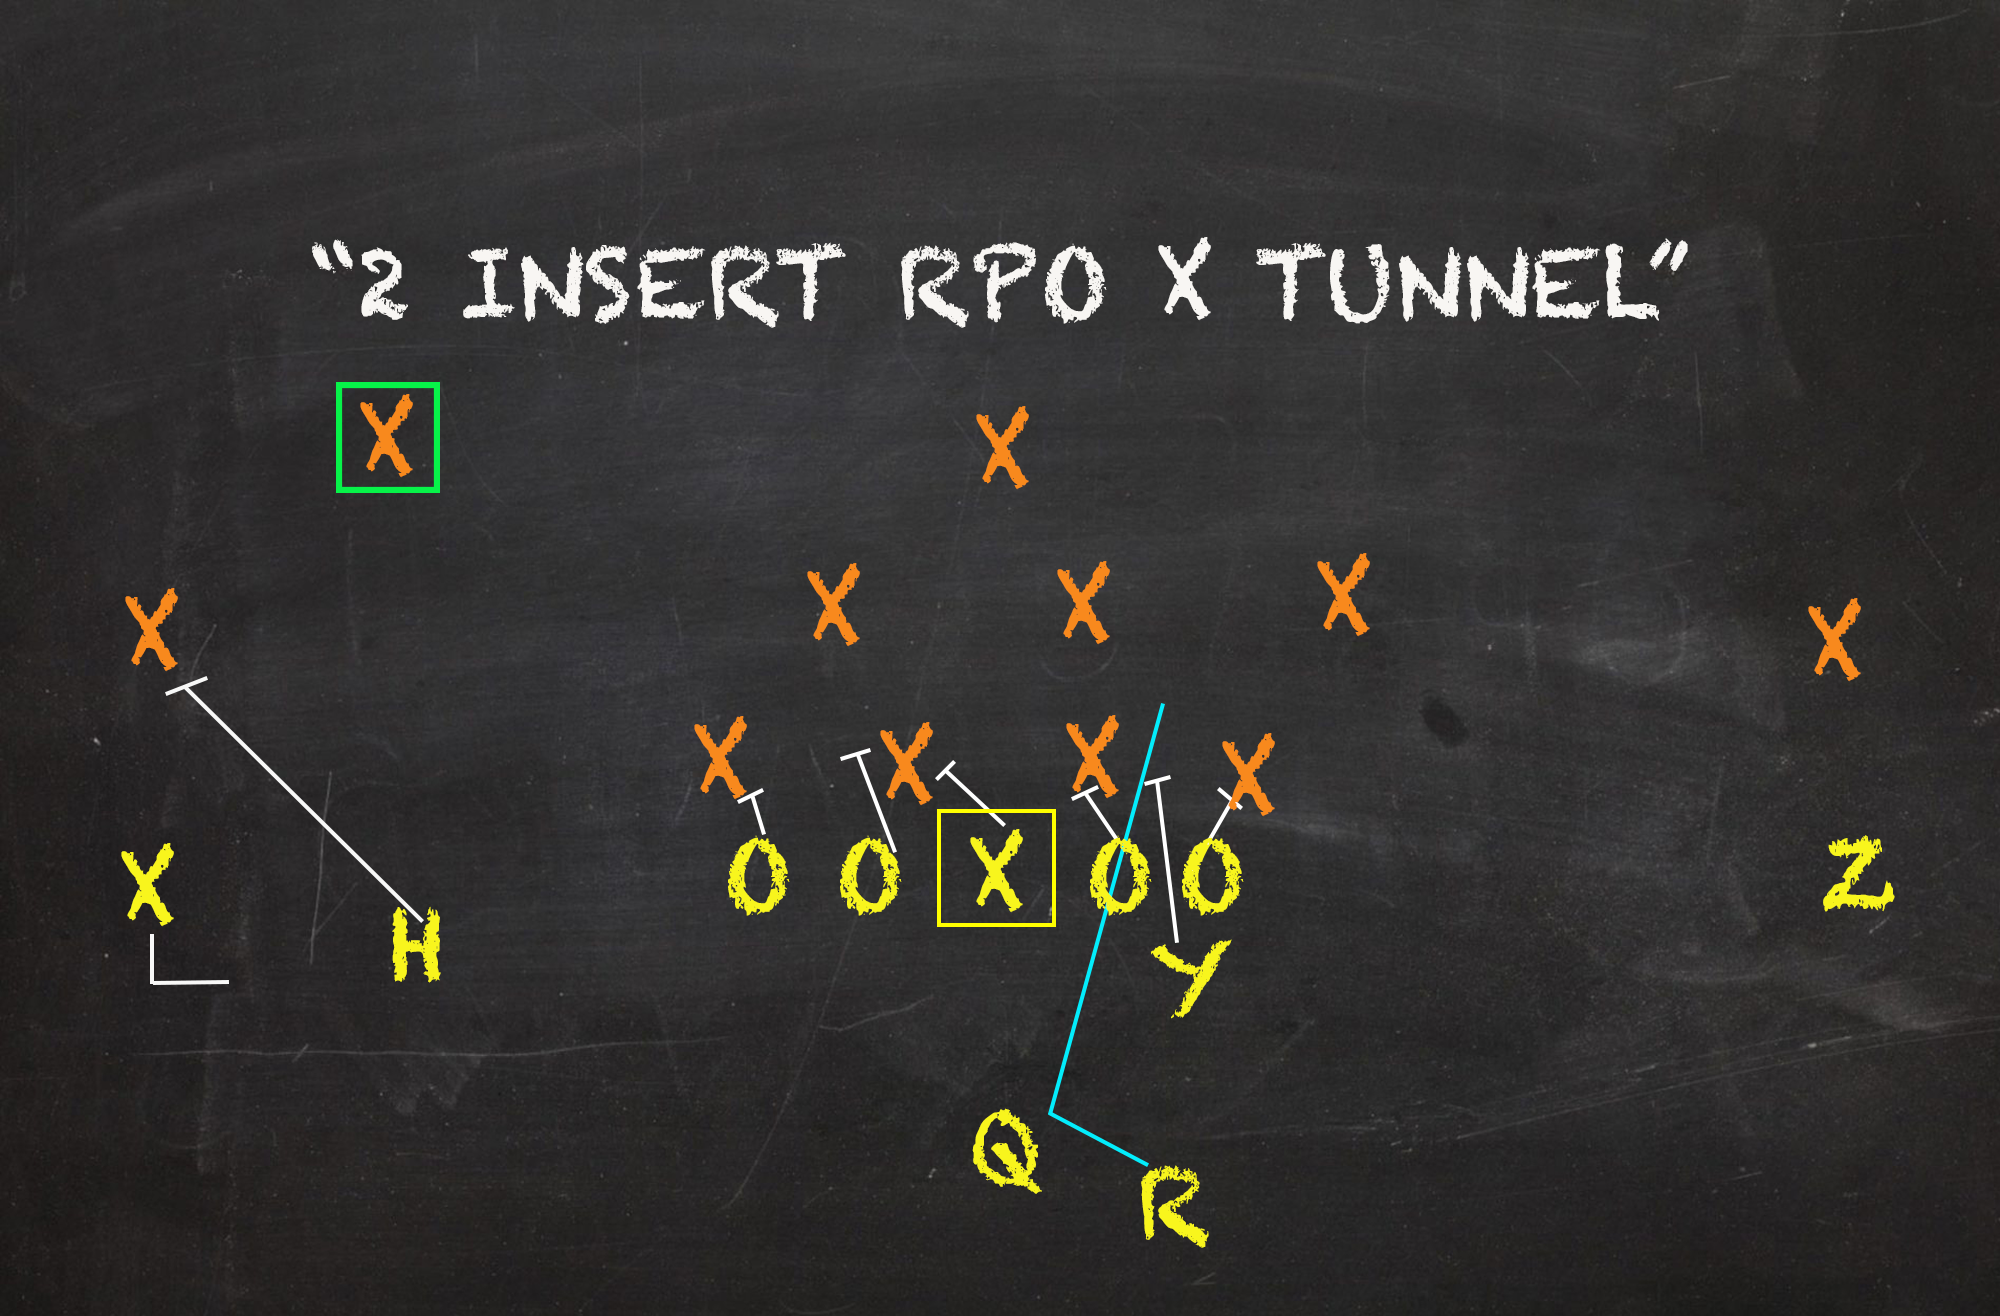
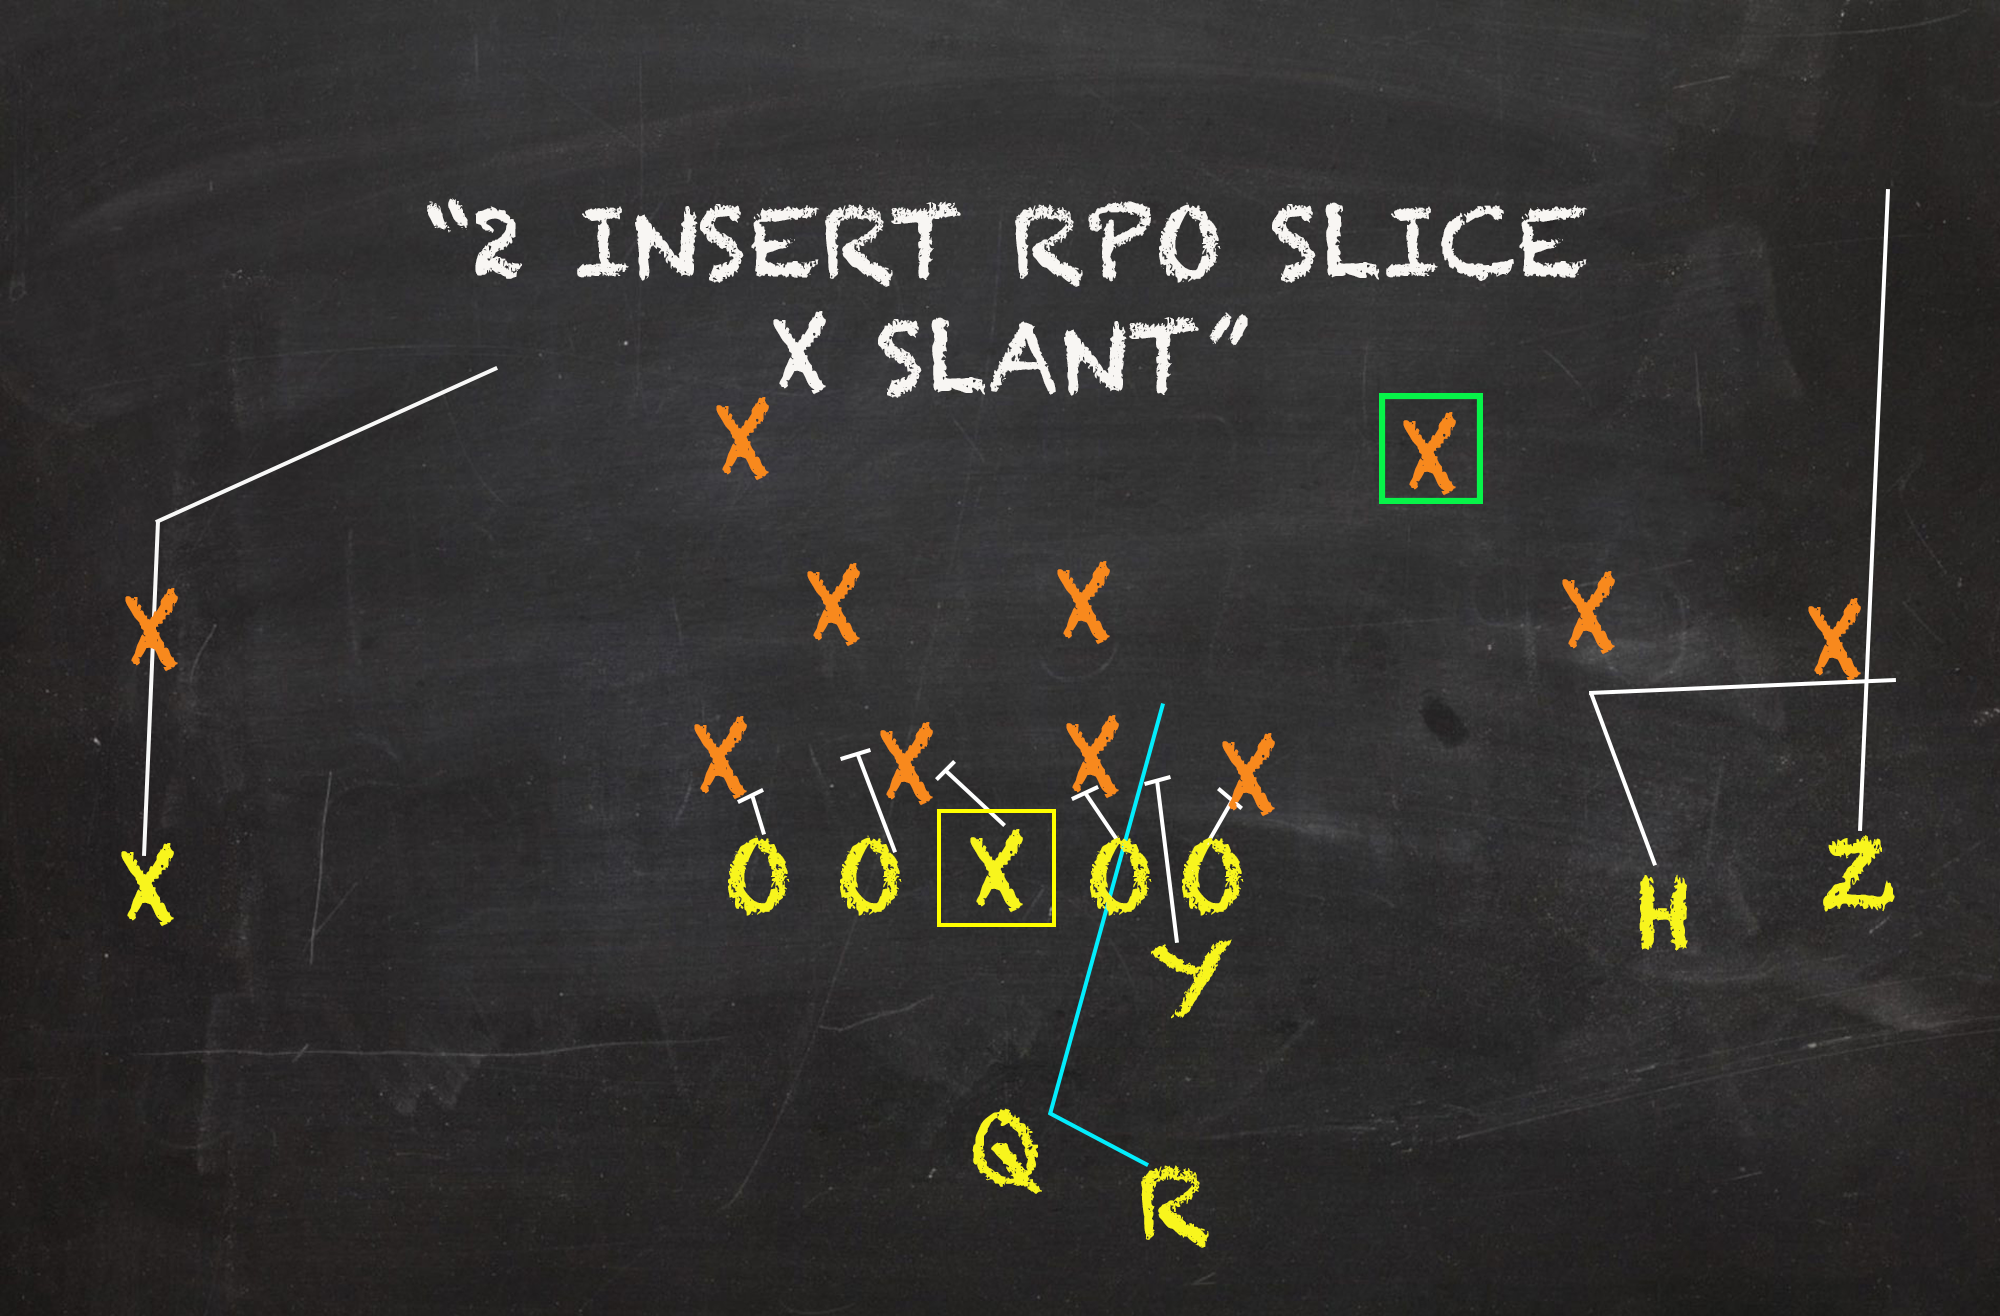
This concept is growing in popularity across the SEC. And seeing results in our study, the love is justified. No other run group experienced both a gain in Yards/Attempt and Success Rate in our sample. Though Y-Insert – a modern take on the smashmouth classic Iso – is utilized with a number of separate outlets, one of the most visibly effective appears to be from a twin set with our TE/”sniffer” in the box towards either side of center. The lead run can hit left or right and can pave a quick crease against various fronts as a Ohio/Slice combo (vert+out) attacks side one; and a Solo Slant rounds out the look from side two. A pure full-field read of a play that can beat anything when on schedule. 2-high, pound inside. 1-high, where’s my guy. Despite RPO reps manufacturing a 53% Success Rate on handoffs, other tries of Y-Insert were decided poor and a major drag for the idea as a whole. They averaged over a yard less per carry in comparison. Oof.
Outside Power Reads (Pin/Pull, Power Veer, Buck Sweep)
| Rushes | Yards/Carry | Success Rate |
| Concept with RPO | 6.9 | 46.6% |
| Concept w/o RPO | 5.5 | 47.5% |
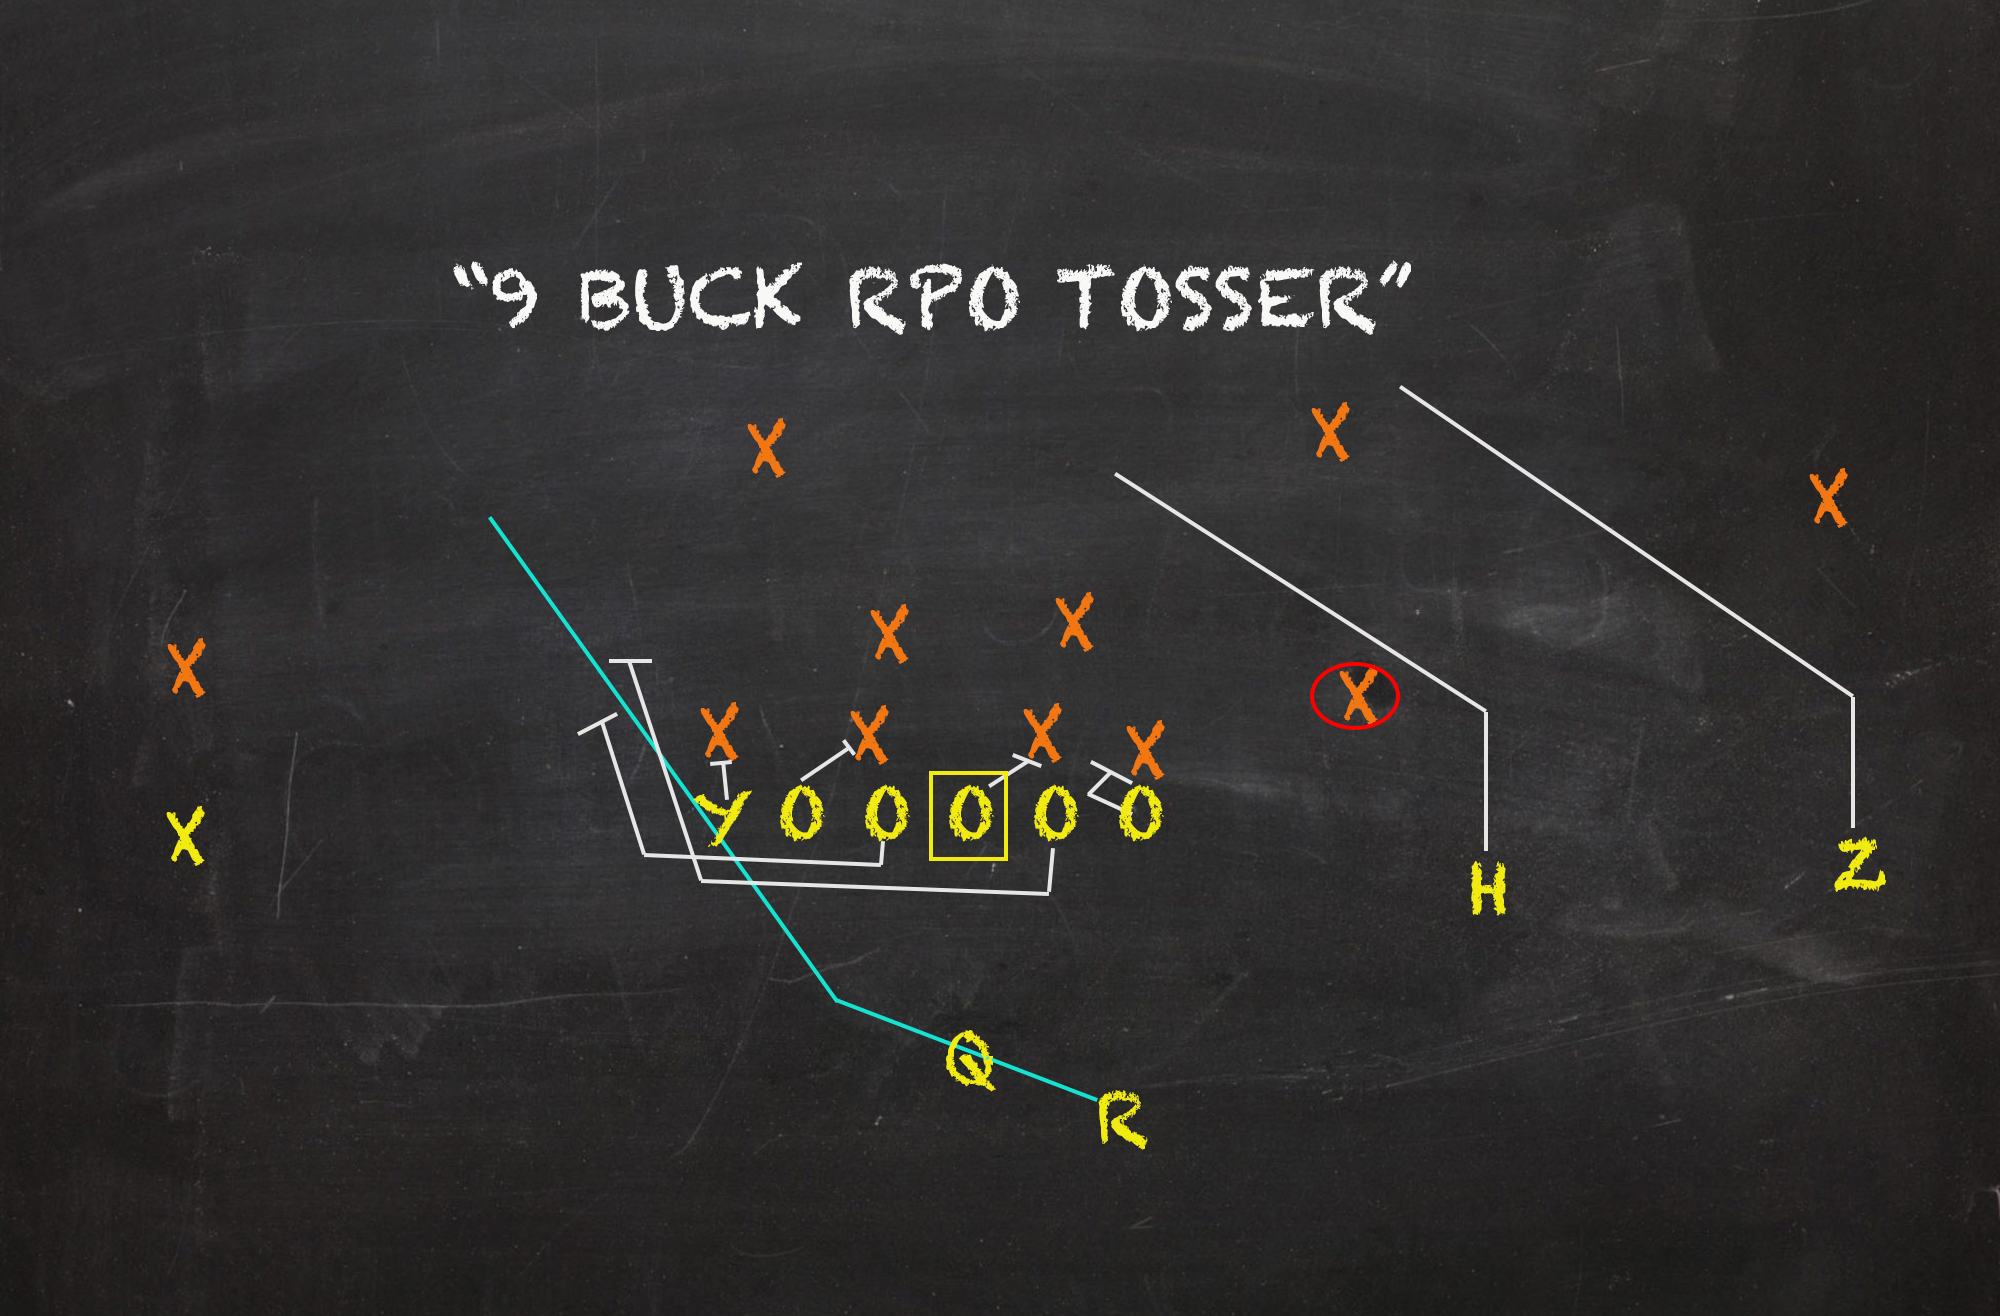
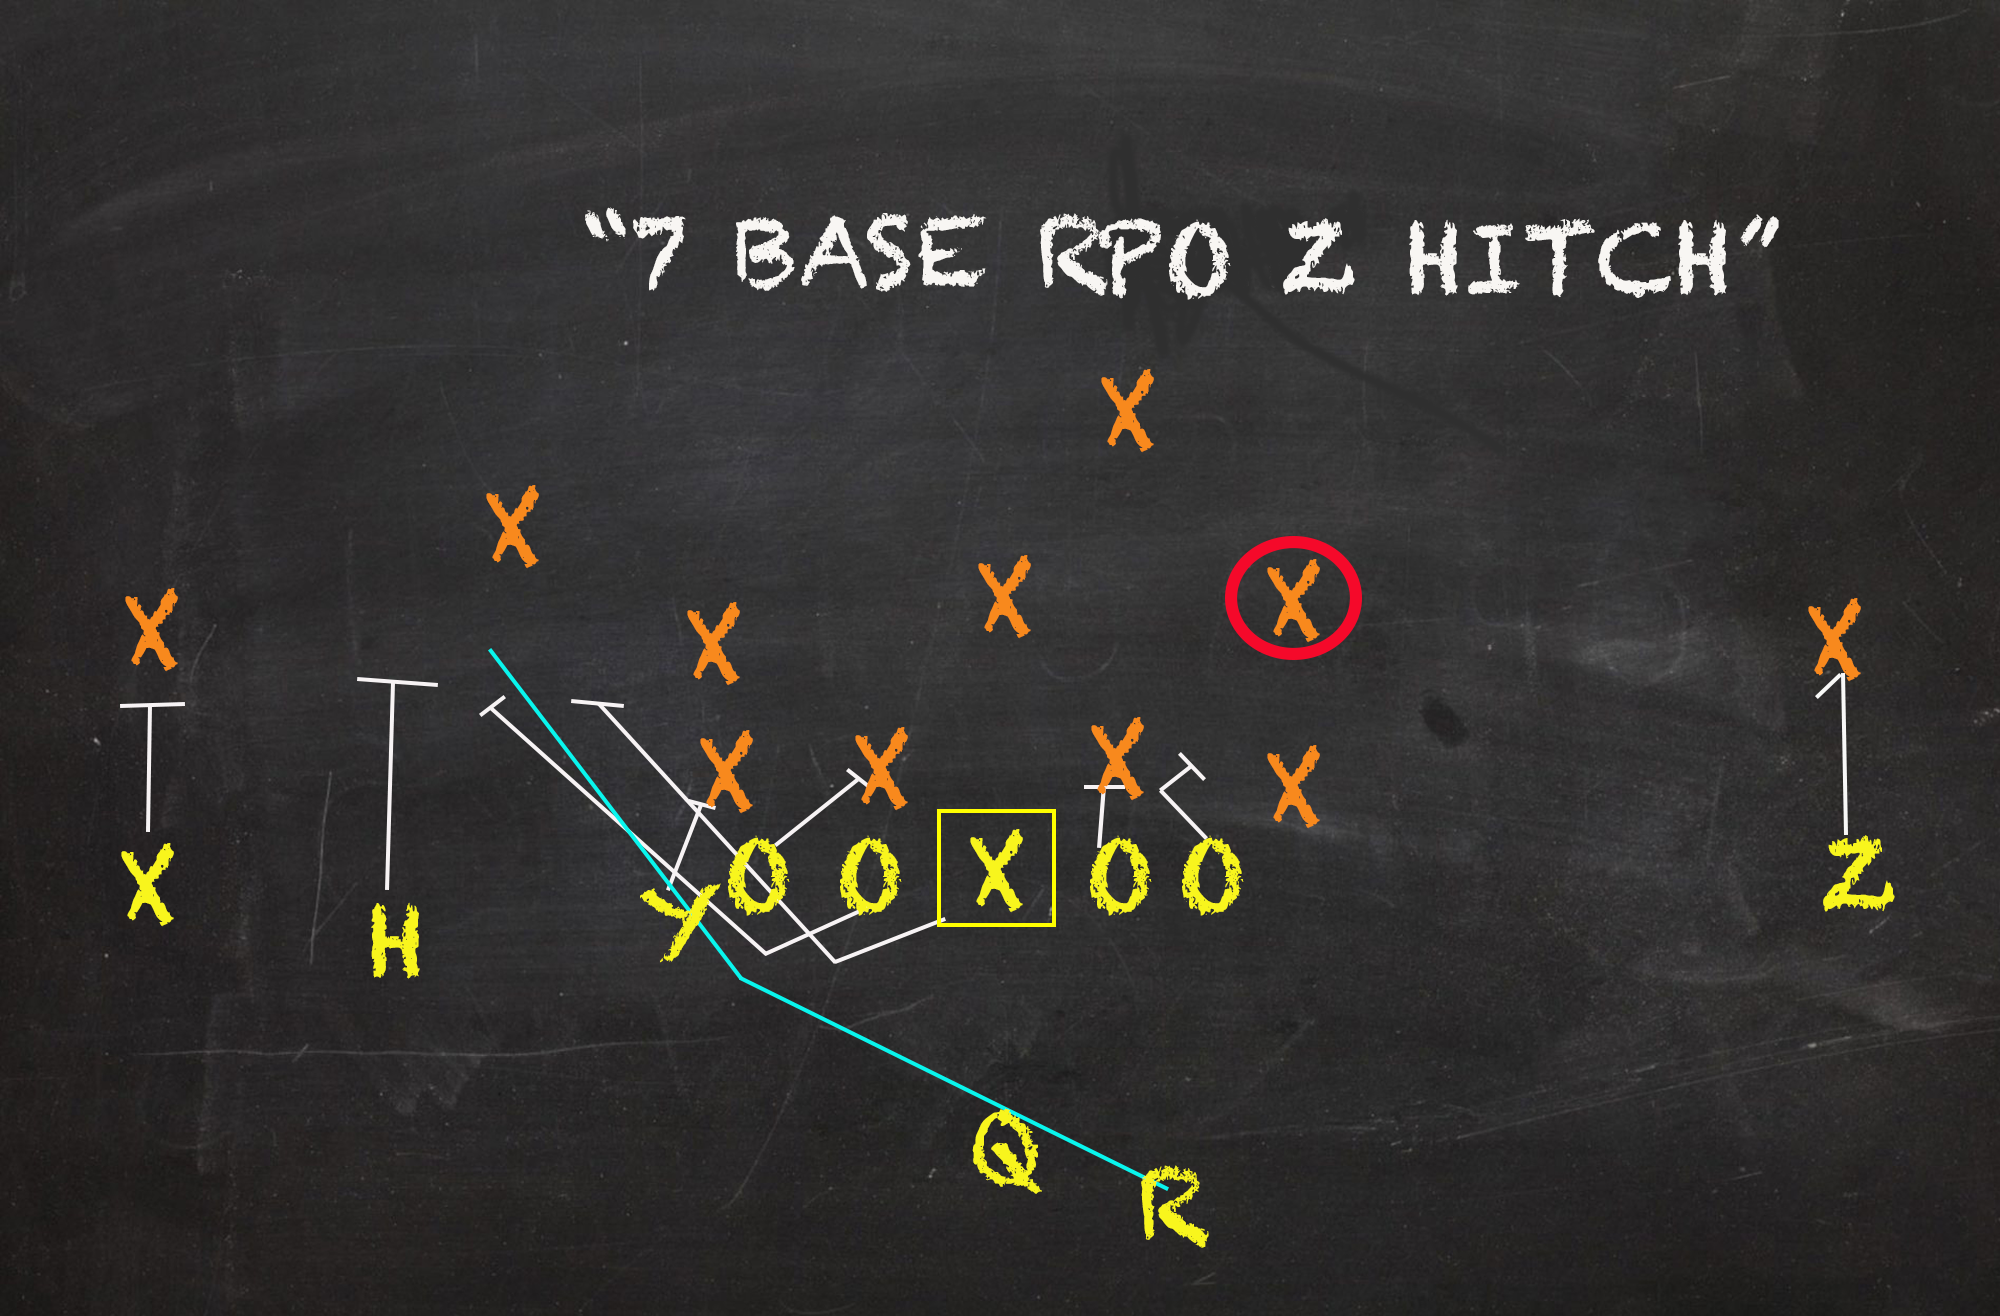
Pull plays attacking the perimeter gladly accepted additional threats to hold up opponents from swiftly rallying to the ball. Consistency was pretty dead-even when looking at RPO reps against null snaps. But outlets undeniably created more room to run per a mighty 6.9 Yards/Carry, which would trump any non-deception-driven rush concepts over the last 3 seasons. These plays were real homerun hitters as far as attacking the trenches go. And while the dip in Success Rate is a ding on this family’s profile, every other run group except Y-Insert declined by over a point in this context – further emphasizing the stability and proficiency of Outside Power Read looks. Alone, Pin/Pull stuff can be fiendish, Power Veers can be cutting, and Buck Sweeps can be imposing. So it shouldn’t shock to see these dangerous designs equip extra teeth with route tags freezing folks.
QB Draws
| Rushes | Yards/Carry | Success Rate |
| Concept with RPO | 7.1 | 46.8% |
| Concept w/o RPO | 7.4 | 38.0% |
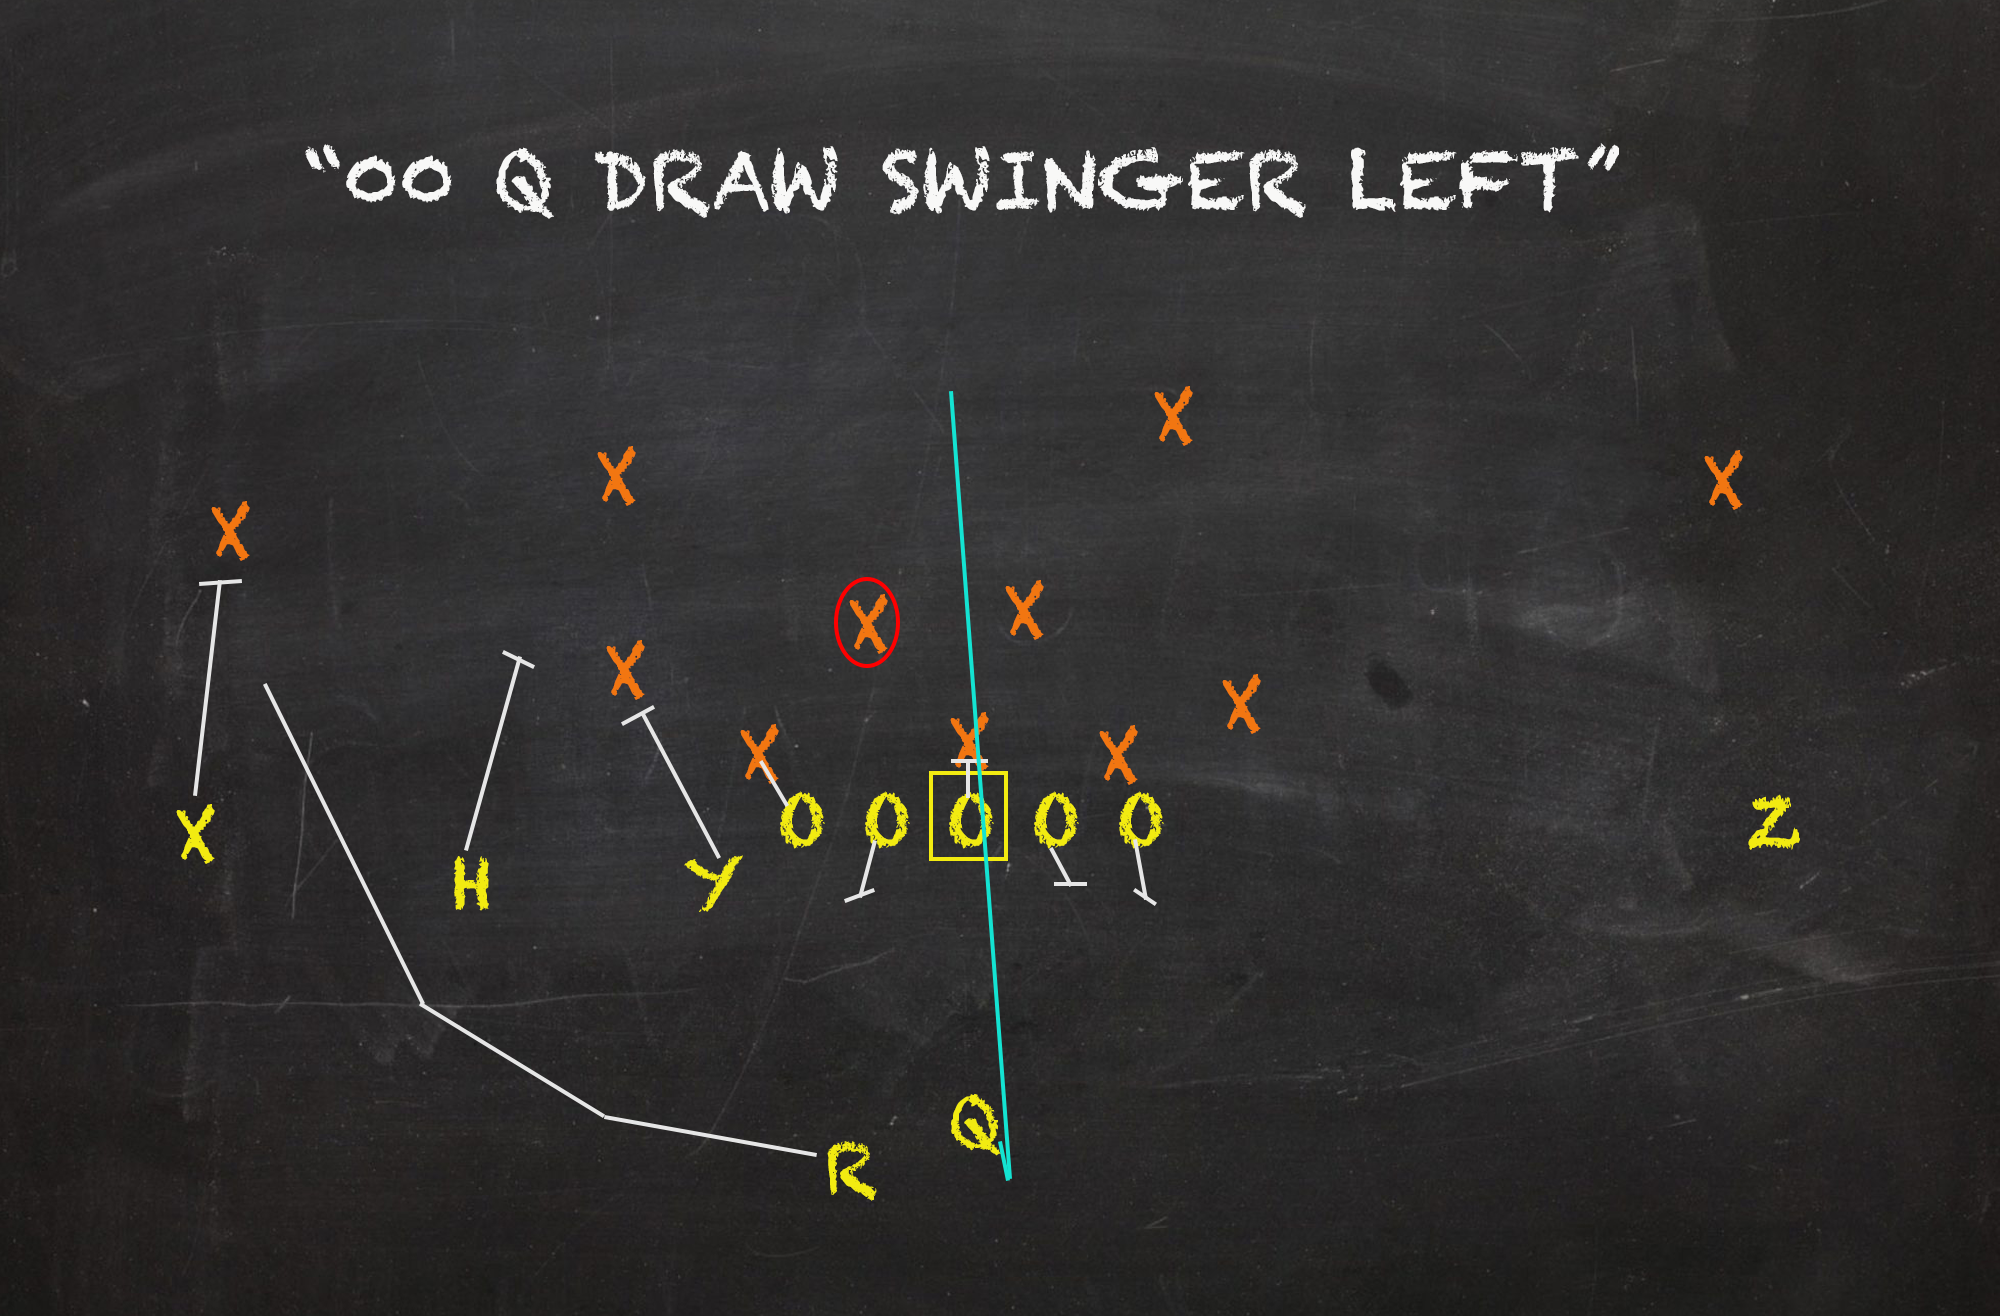
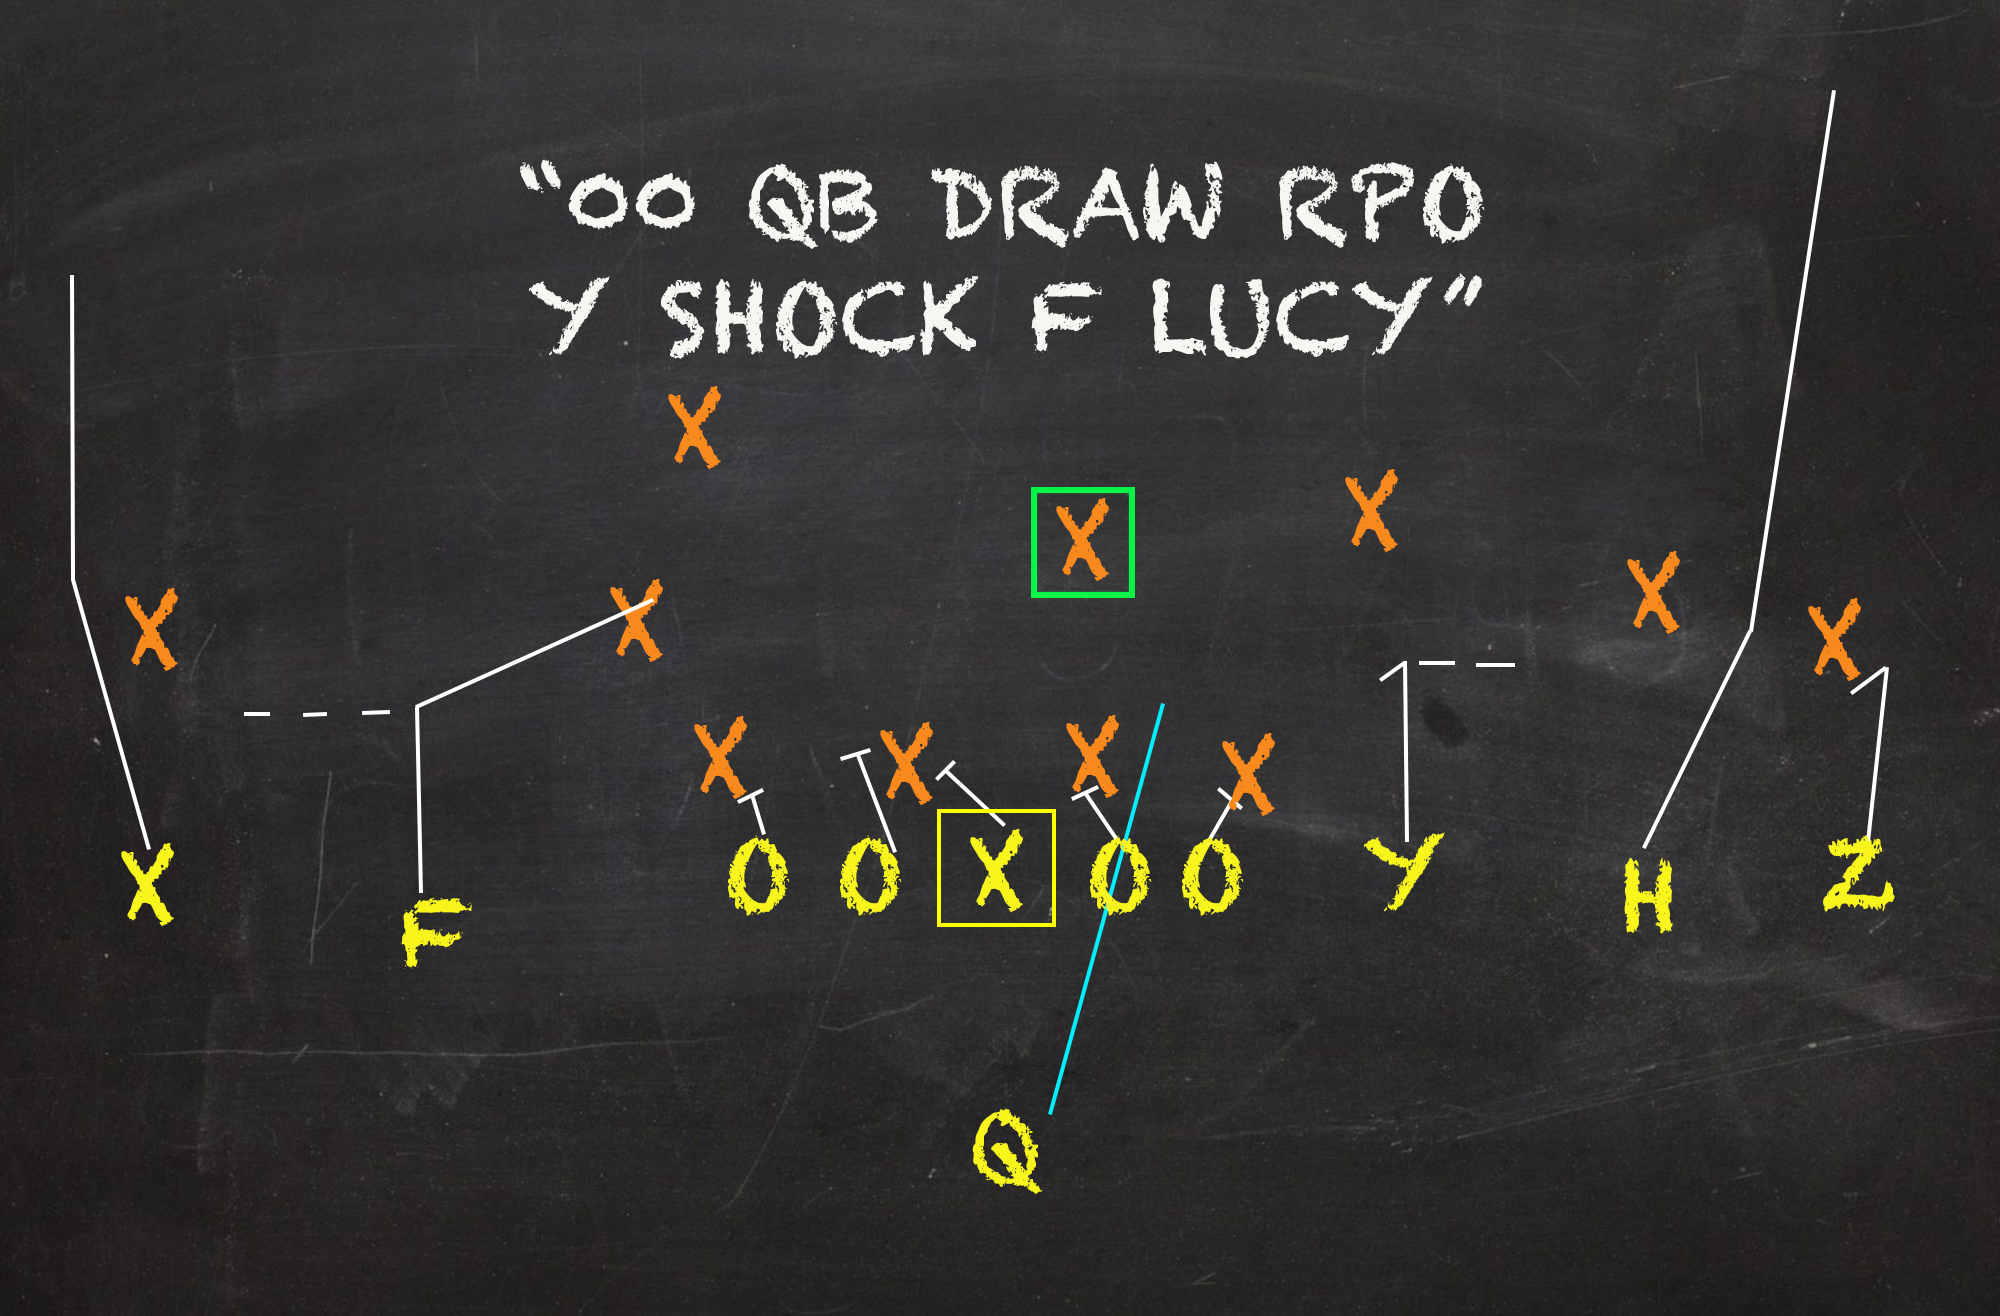
QB Draws are sucker plays to hit opponents once they let their guard down. Definitely not an every down idea, prudence is required when scribbling them into the script. Already reliant on light boxes in order to find adequate results, RPO tags have provided obvious value pulling defenders further outside and away from a potential alley. The most common marriage is with All Curls or Stick Variations. While being stressed horizontally, corralling a QB with a full head of steam when flatfooted can be a tough assignment. Less than 2/5 non-RPO QB Draws have worked the last 3 seasons. But, almost half of the snaps with routes attached have found success even if there has been no sizable change in Y/A.
Isolating the Main Outlets
| Bubble | Tunnel | Swing | Curl/Hitch | Slide/Flat | |
| Yards/Target | 6.2 | 5.6 | 6.2 | 6.3 | 5.2 |
| Success Rate | 51.2% | 51.1% | 46.0% | 58.8% | 50.0% |
| +- Y/T vs RPO AVR | +0.5 | -0.2 | +0.4 | +0.5 | -0.6 |
| +- SR vs RPO AVR | +4.6% | +4.5% | -0.6% | +12.2% | +3.4% |
Dual Curls and Slant Variations could make a case. But in StatCat’s charting, there are 5 main RPO Outlets: Bubble Screens, Tunnel Screens, Swing Screens, solo hitches, and Slides/Flats. These are the OG “death by a thousand papercuts” tags that can annoy or destroy any disrespectful defense.
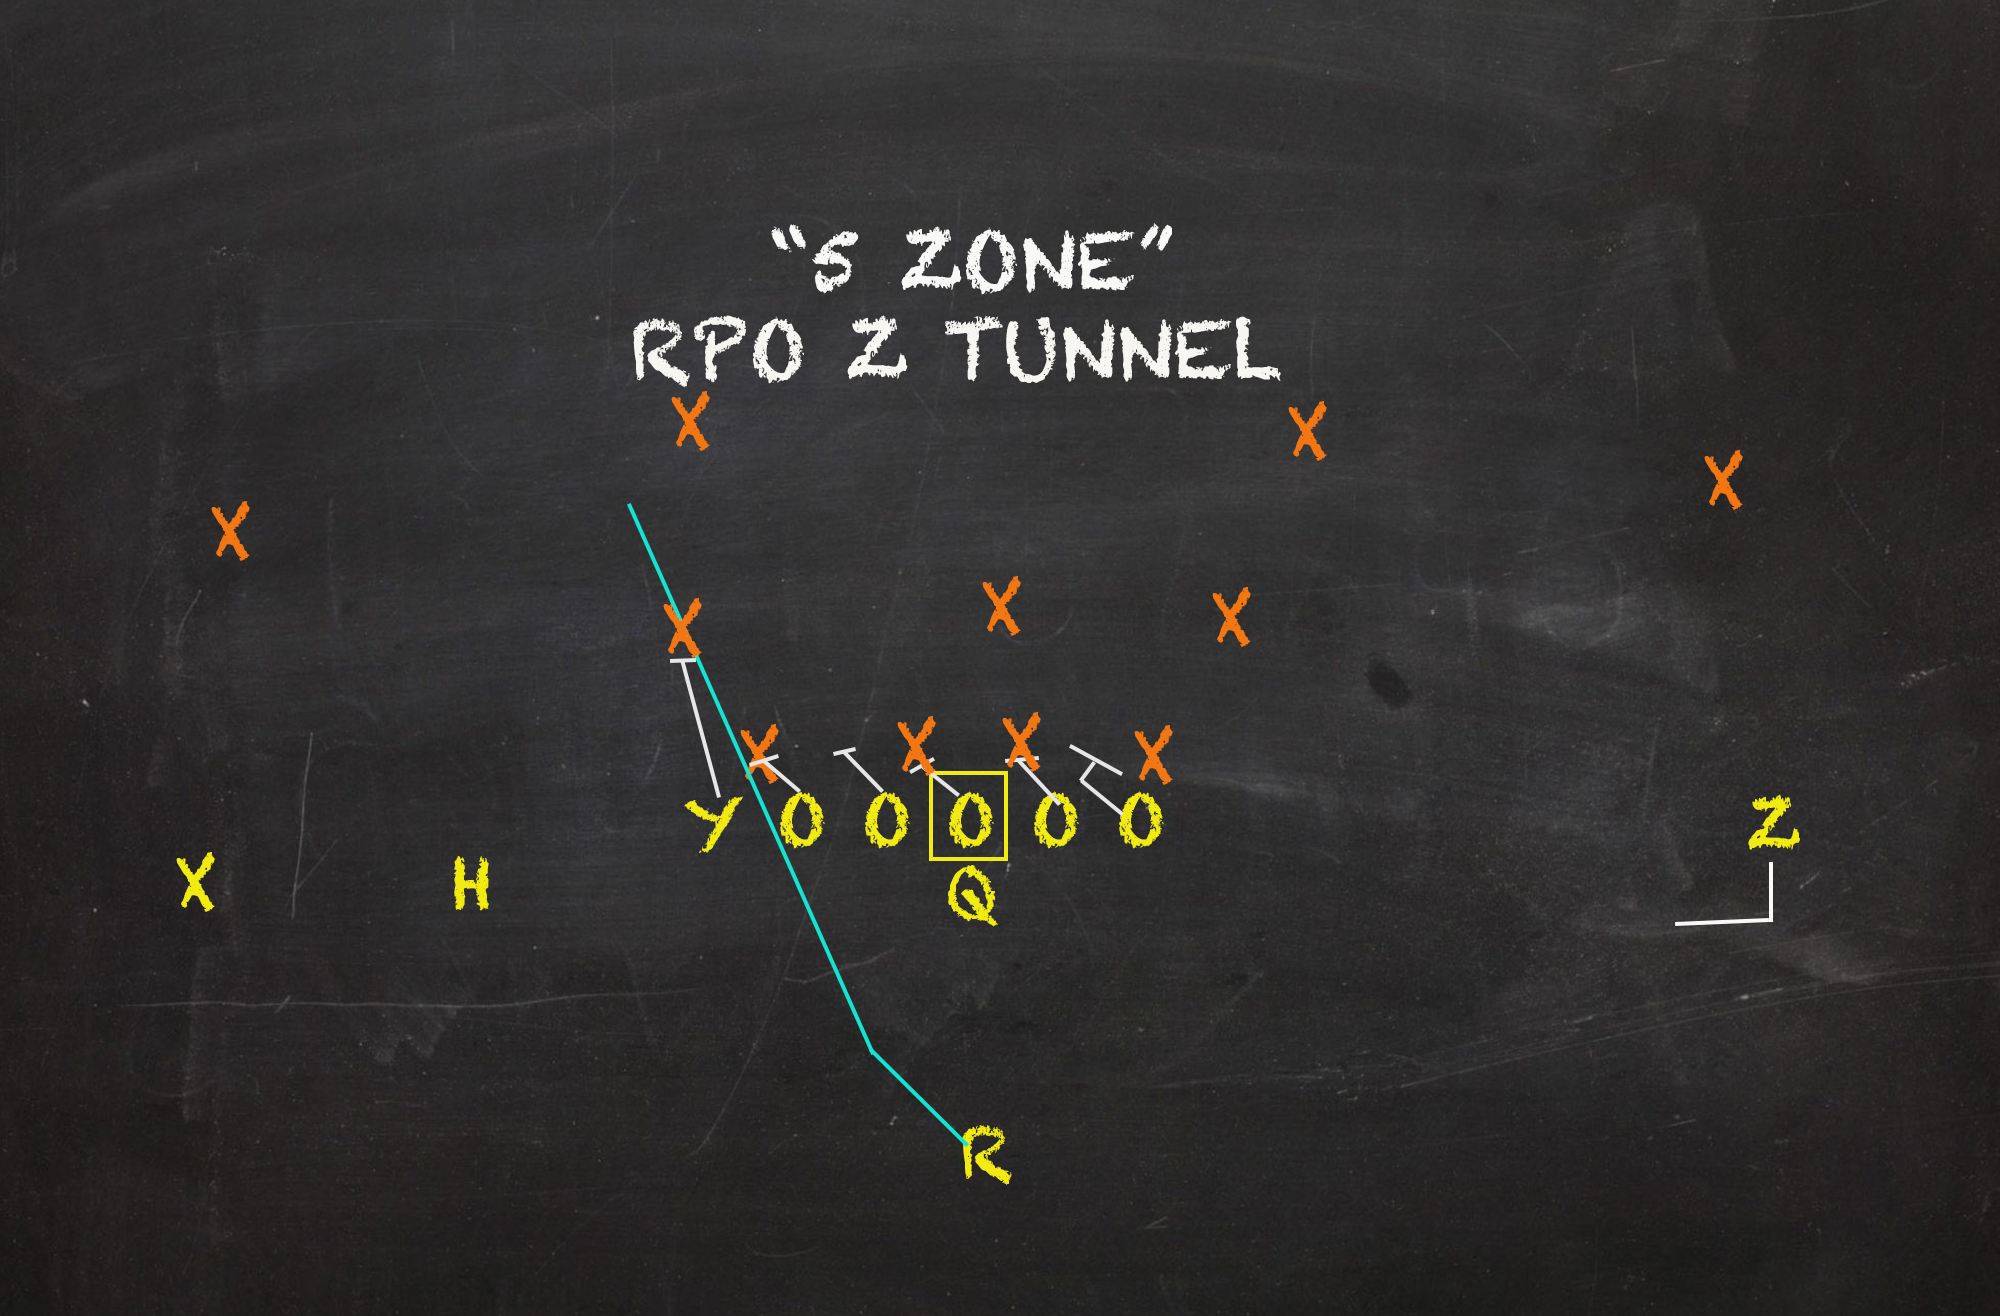
Three of them bested the qualifying RPO concept mean Y/A, and only Swing Screens failed to top the respective Success Rate. Playing off the notions we mentioned earlier, solo hitches proved to be the most trusty to target among the core outlets. Including all snaps the last 3 years, its 3.6 adjusted opportunity rating is among the SEC’s top20 concepts. As expected, the tags that travel behind the line of scrimmage had lower upside than their downfield contemporaries. Though they found desired efficiency after drawing advantageous targets, tried and true Bubble Screen was the only one to deliver an above-average Y/A. Again set up to succeed, each finished on the desirable side of the conference average in A.O.R. since 2020 (but to reiterate, these plays opt for singles rather than extra base hits).
Soured Grapes
Straight Inside Zones, Outside Zones and Outside Powers
| Rushes | Yards/Carry | Success Rate |
| IZs with RPO | 3.9 | 40.8% |
| IZs w/o RPO | 5.3 | 46.0% |
| OZs with RPO | 5.1 | 36.8% |
| OZs w/o RPO | 5.3 | 43.2% |
| OPs with RPO | 5.0 | 33.3% |
| OPs w/o RPO | 5.3 | 43.2% |
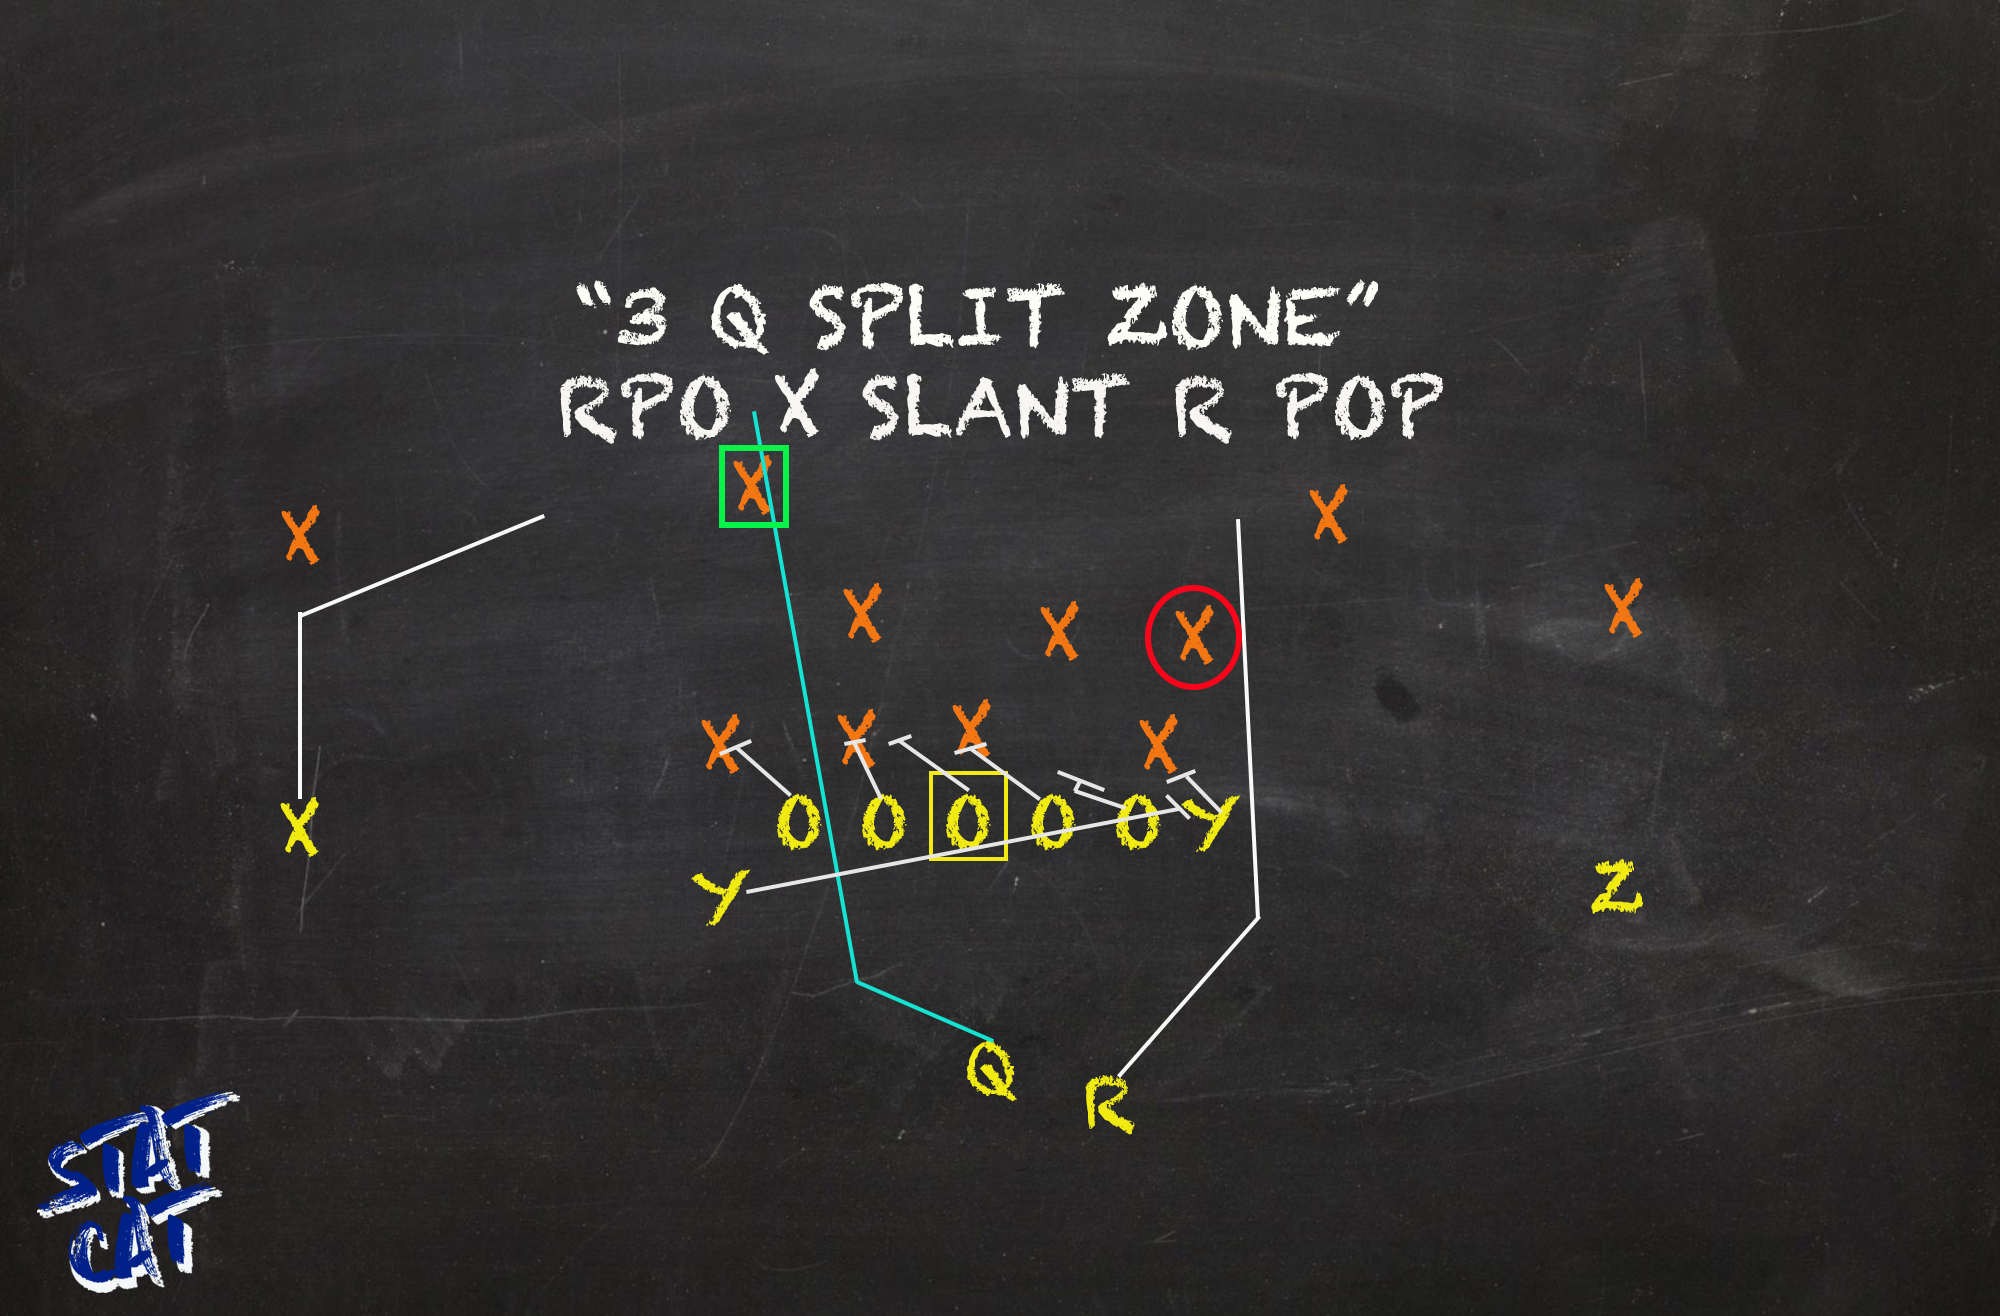
Even though these three rush concepts differ philosophically, they all suffered from the same issue when route tags were attached. Since read elements for potential QB keeps were excluded due to formational restrictions, these plays featured “alert” RPOs. Some triggers for pulls are pre-snap and some are post-snap, and these are all the former. Alerts are perhaps the most archaic form of RPOs – derived from “uncovered” throws when a defender fails to align equal numbers out-wide – they’re little more than playing hot potato. If the defense accounts a hat for a hat, then hand it off. Though RPOs from the shotgun tend to benefit from backfield mesh for a practical play fake, alerts lack that detail, which curbed all of these concepts to a sub-41% Success Rate. All were at least 5 points worse compared to reps on non-RPO tries. For what it’s worth, Outside Zones were the primary driver amongst the trio (73% OVR play share, 68% RPO play share).
Vertical Shots
| Targets | Yards/Target | Success Rate |
| Concept with RPO | 5.1 | 24.2% |
| Concept w/o RPO | 9.4 | 32.1% |
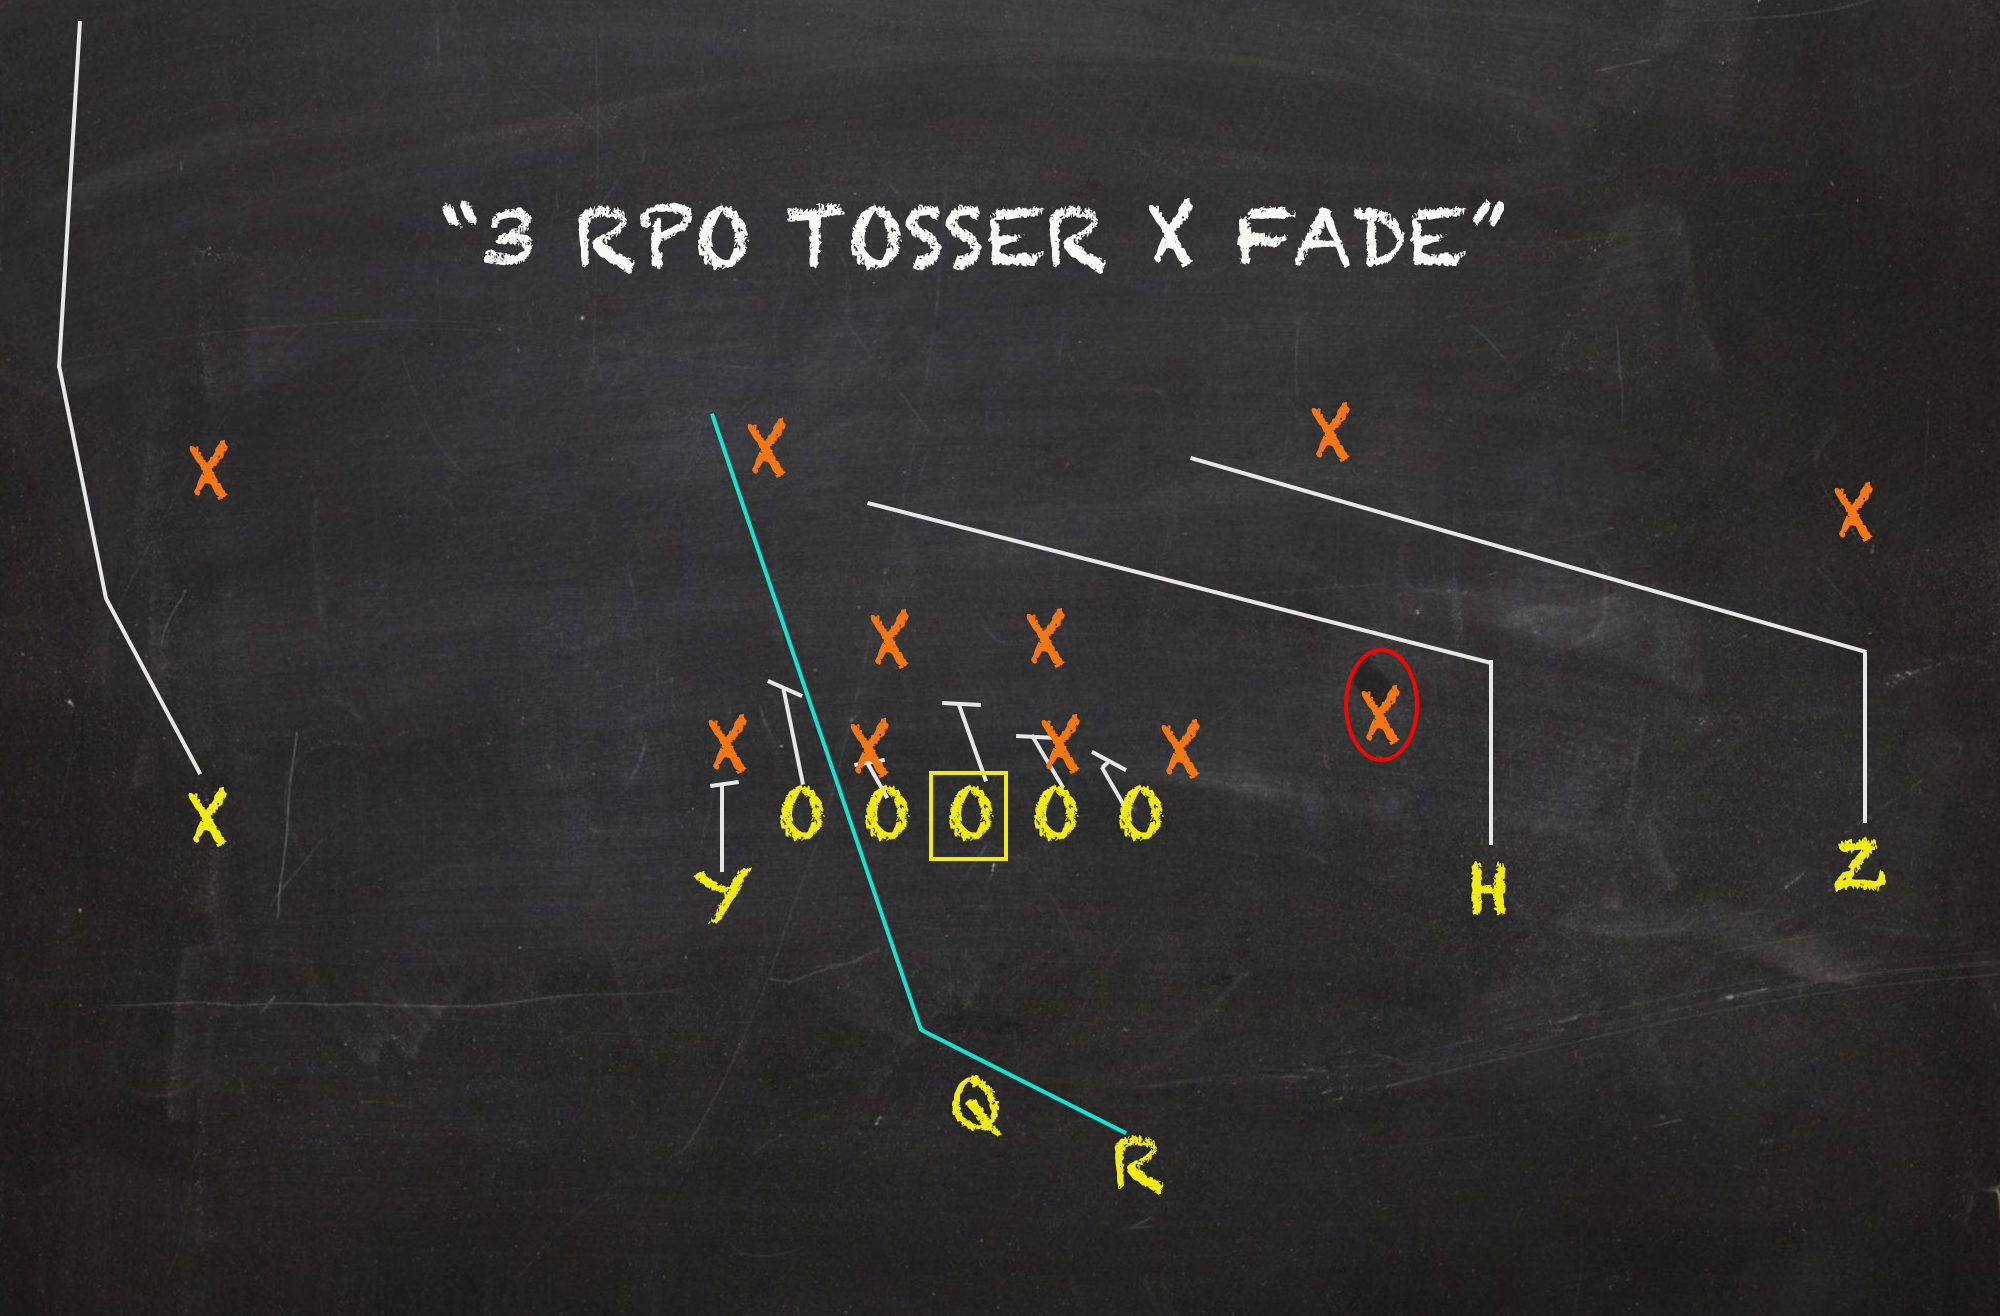
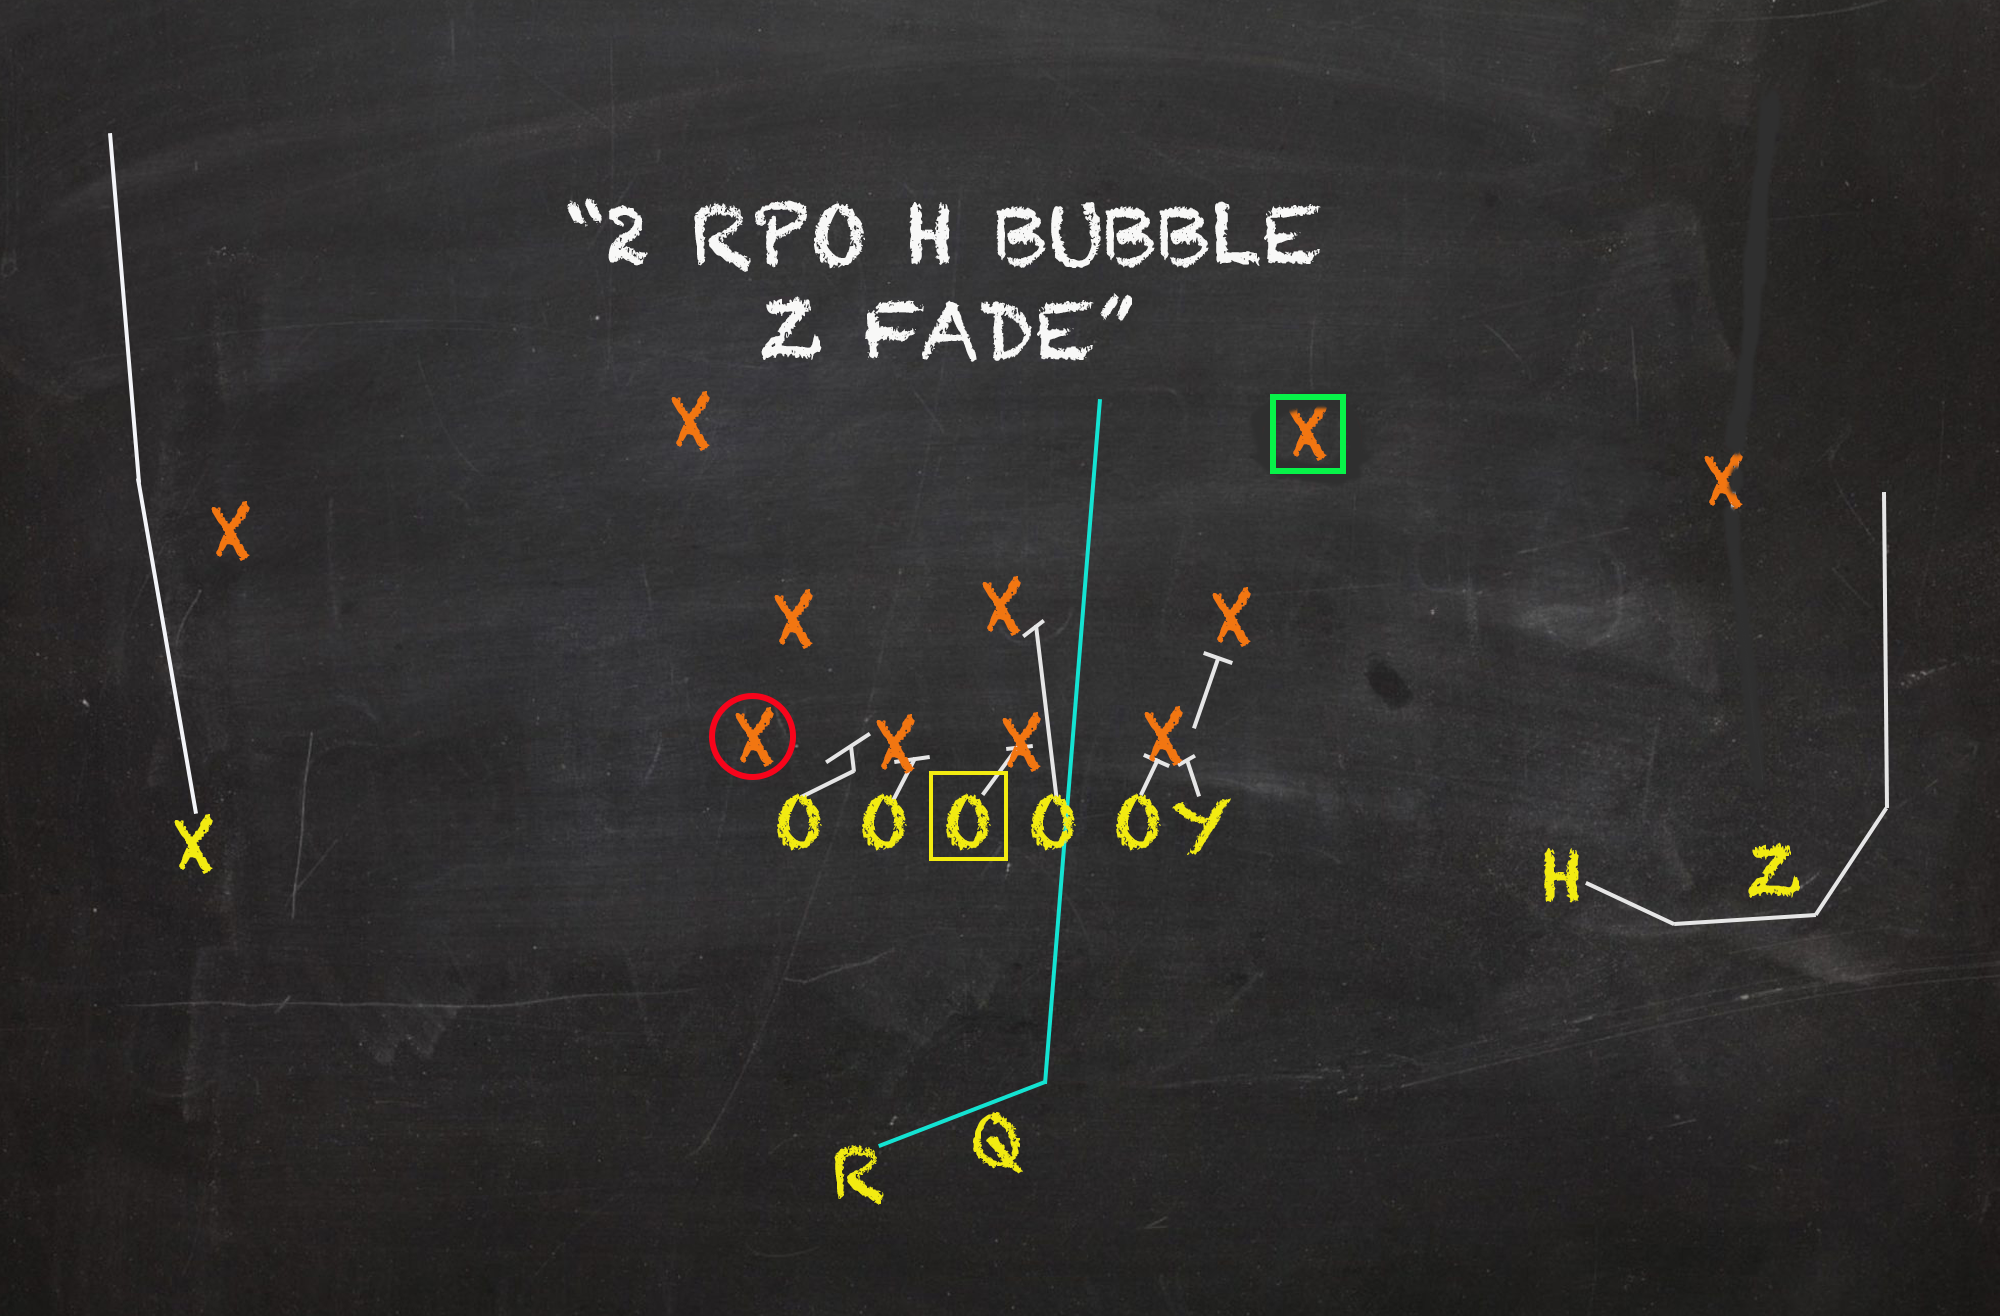
You’d think that these downfield dingers would be the best of both worlds. Only fielding targets in favorable spots while also increasing the snap’s ceiling, almost an eighth of all Vertical Shots were repped via RPO. However, SECers have sucked connecting with their receivers. Already a concept that only finds success less than a third of the time, RPO attempts floundered to a 24.1% Success Rate. Dropback tries averaged over 4 more yards per target. No other concept with decent RPO volume experienced a larger dropoff or logged a worse rate of success. Deep passing is sensitive to timing. And, Captain Obvious wanted me to say long throws have a higher degree of difficulty than underneath stuff. But all else considered, the abbreviated read hastens mechanics and alters ball placement that clearly has hurt Shots’ output.
Bash Read
| Rushes | Yards/Carry | Success Rate |
| Concept with RPO | 2.6 | 25.0% |
| Concept w/o RPO | 4.5 | 51.6% |
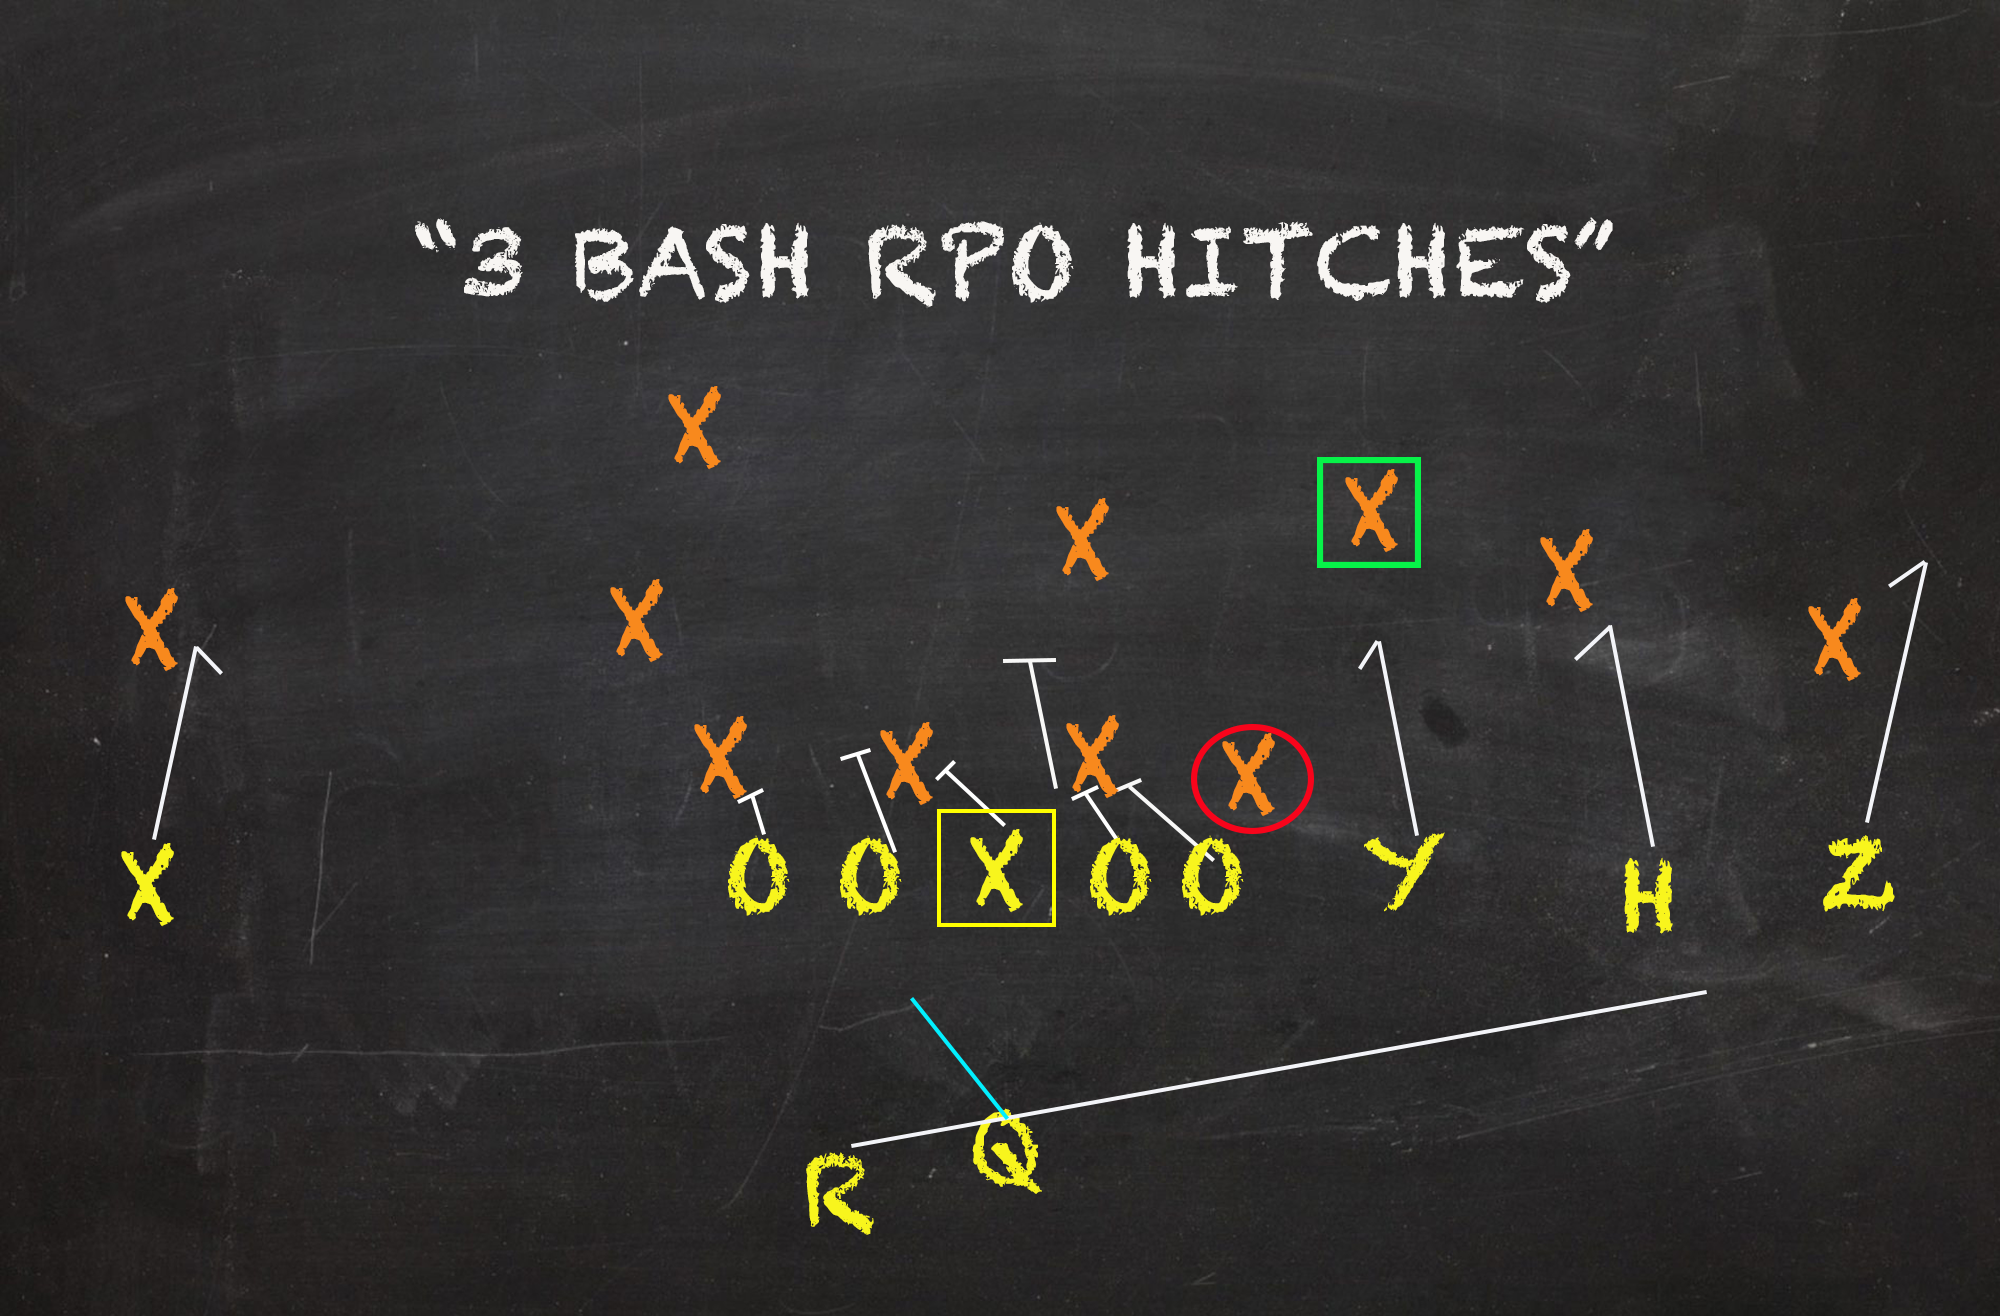
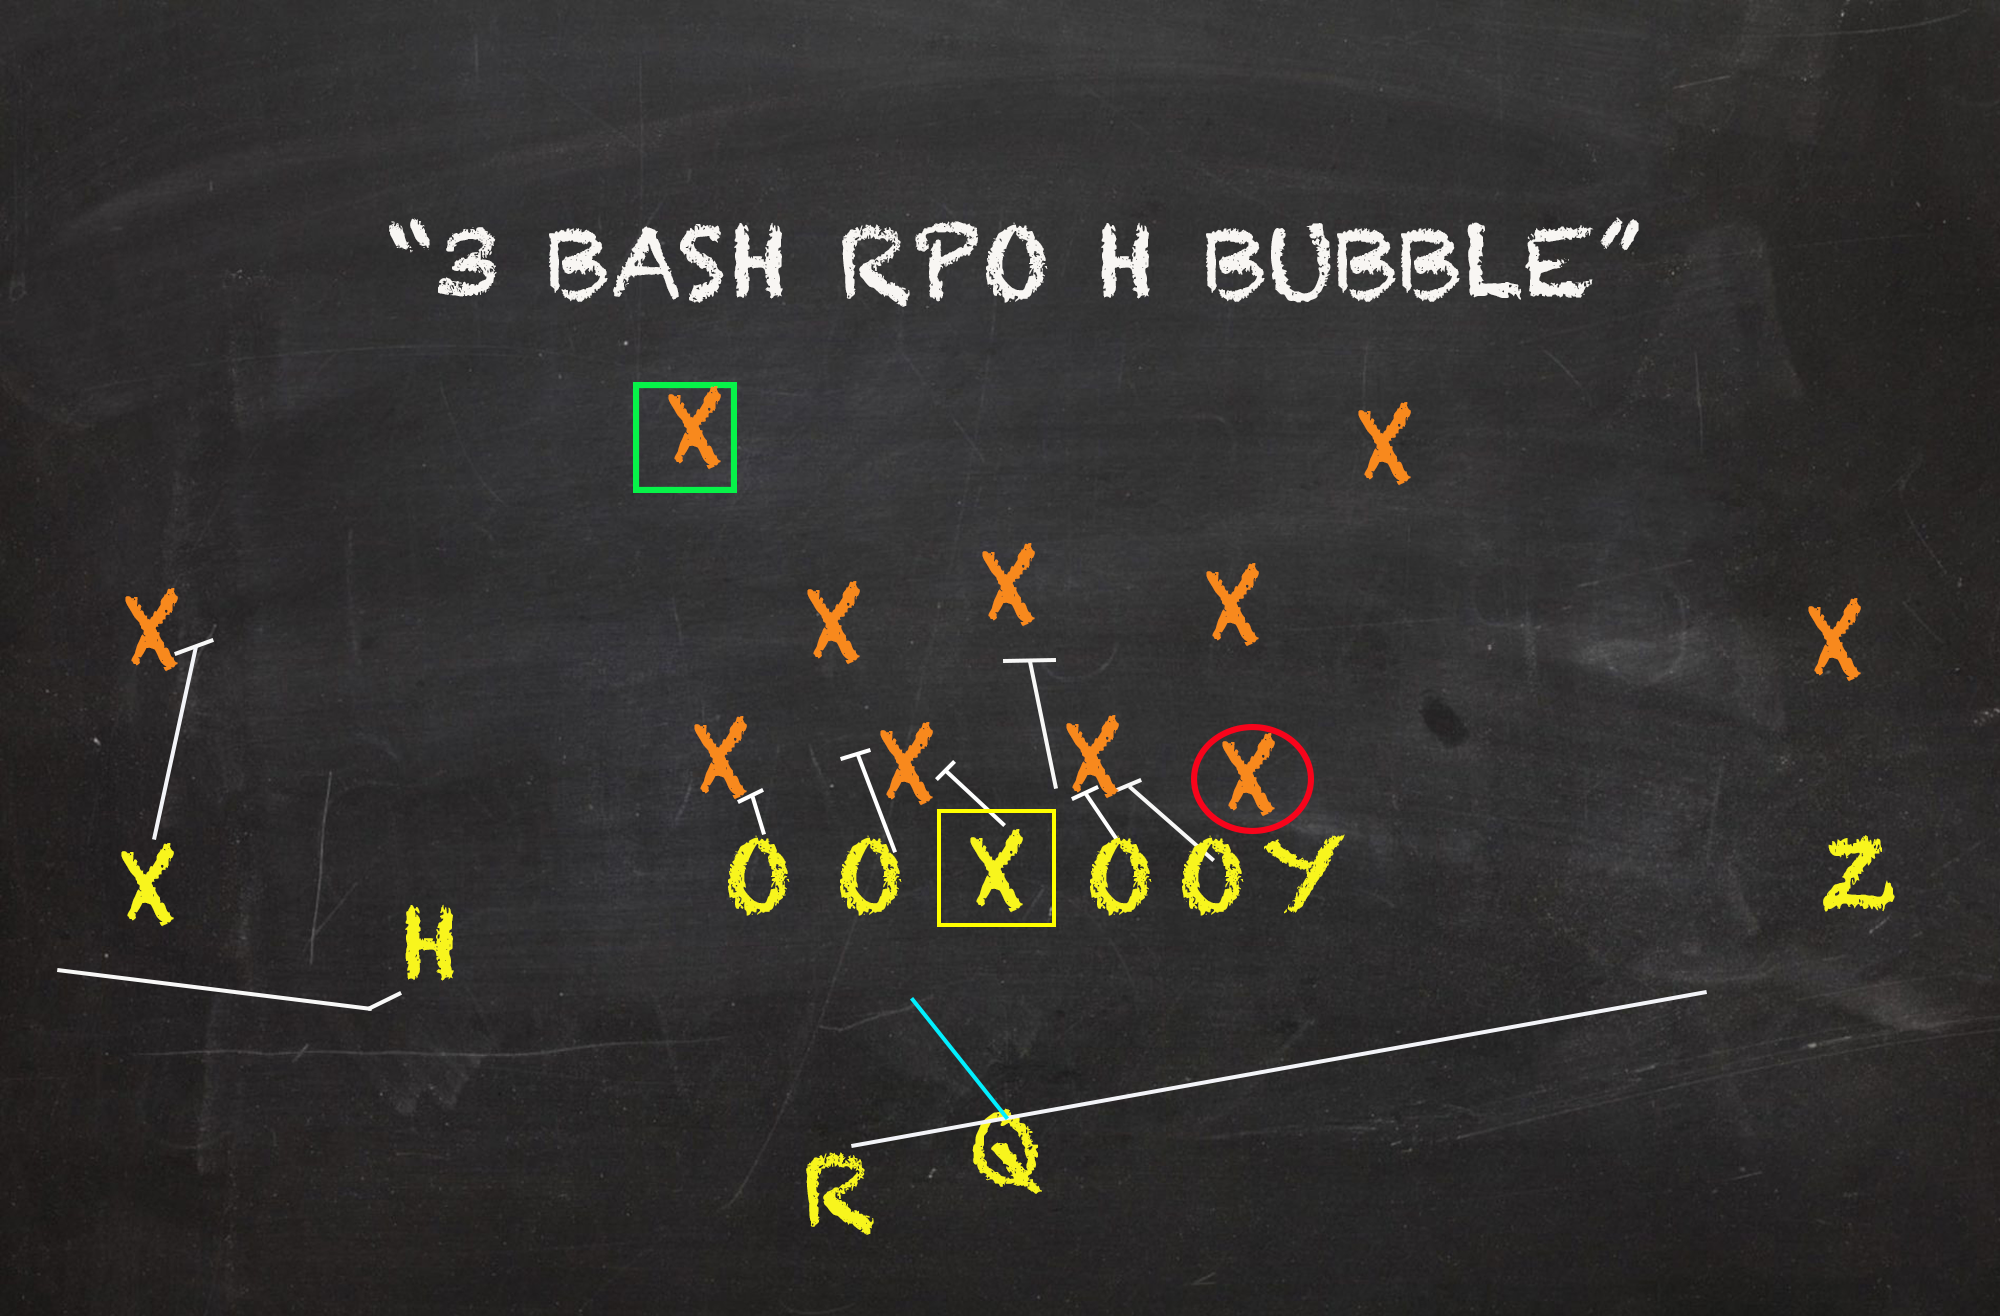
The only variety of bash runs (aka “back away”) that qualified for our study was the standard zone version. With the QB and RB swapping running responsibilities, the former becomes the dive player following the zone flow and the latter hits the edge the opposite way potentially clowning a frozen key defender. Though a clever tactic to keep defenses from snoozing, Bash Read RPOs were too busy for their own good. Granted their sample size isn’t as prominent as other concepts, but one would have to be one ballsy sumbitch to commit to the bit based on what the conference has done as of late.
Levels
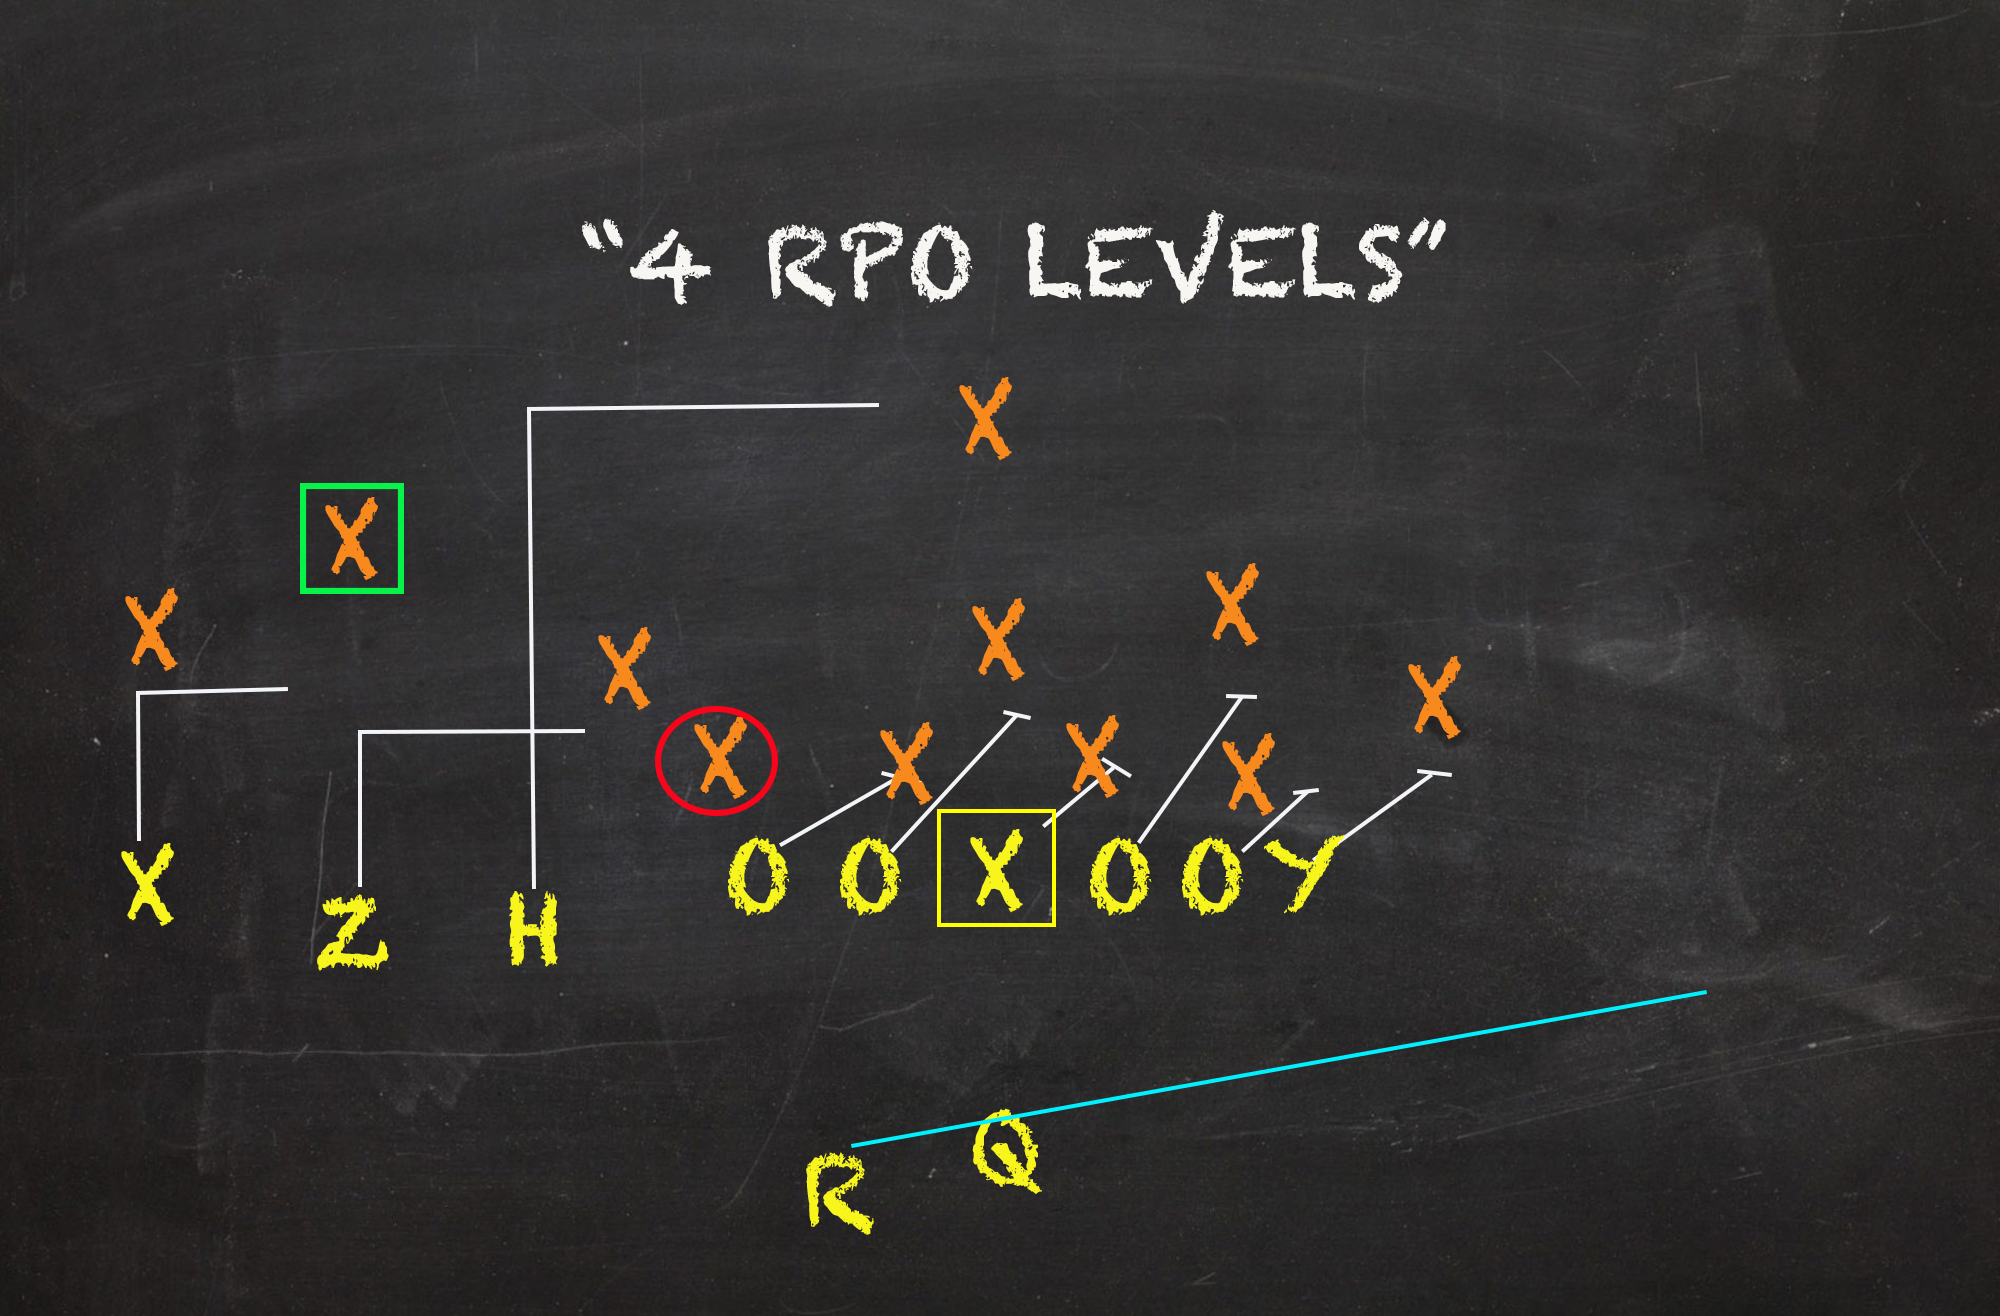
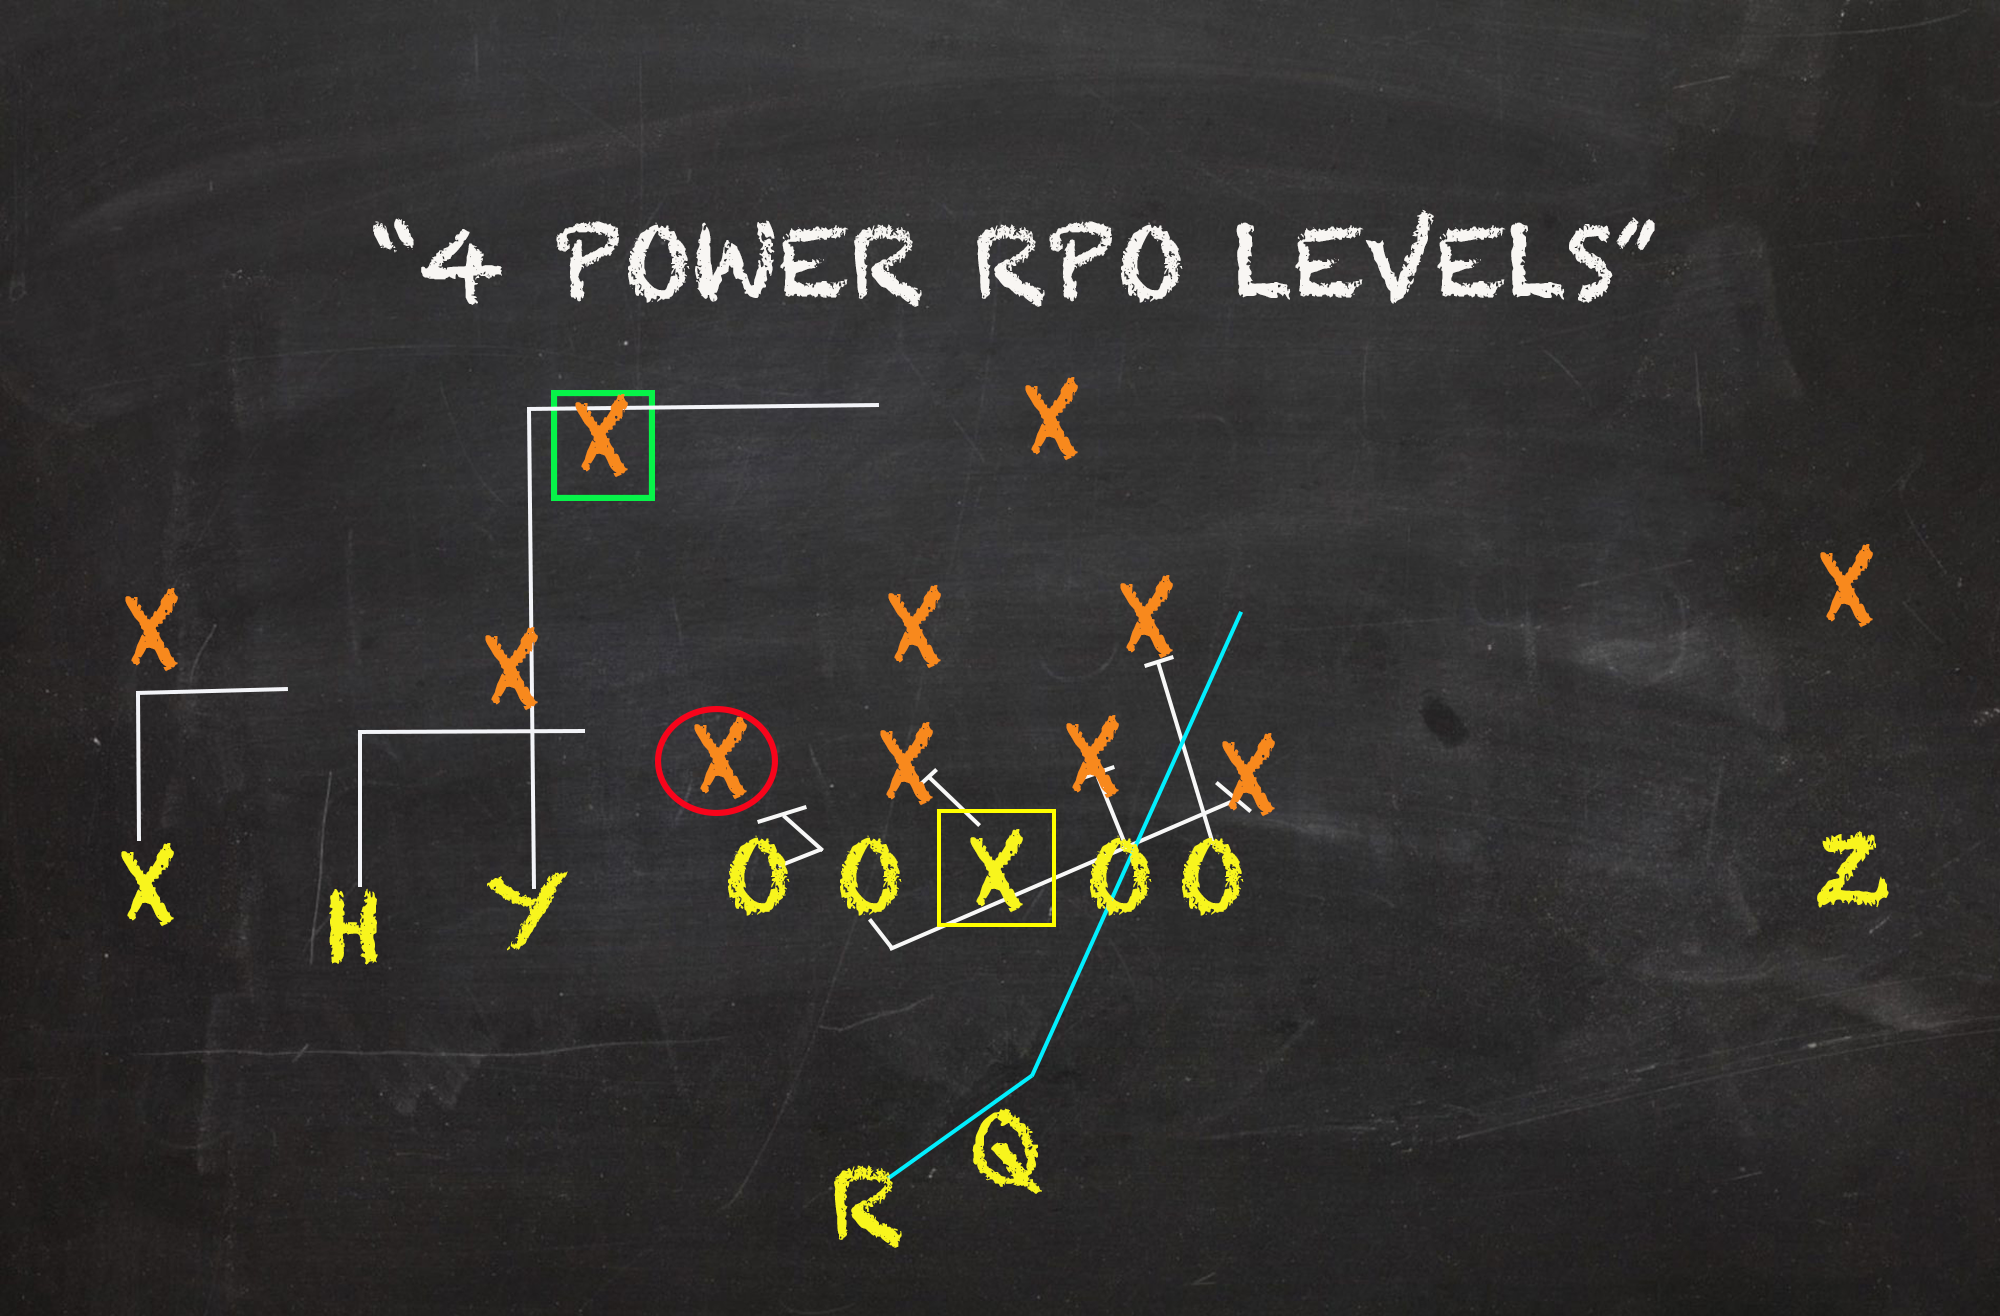
| Targets | Yards/Target | Success Rate |
| Concept with RPO | 6.2 | 44.4% |
| Concept w/o RPO | 8.0 | 50.0% |
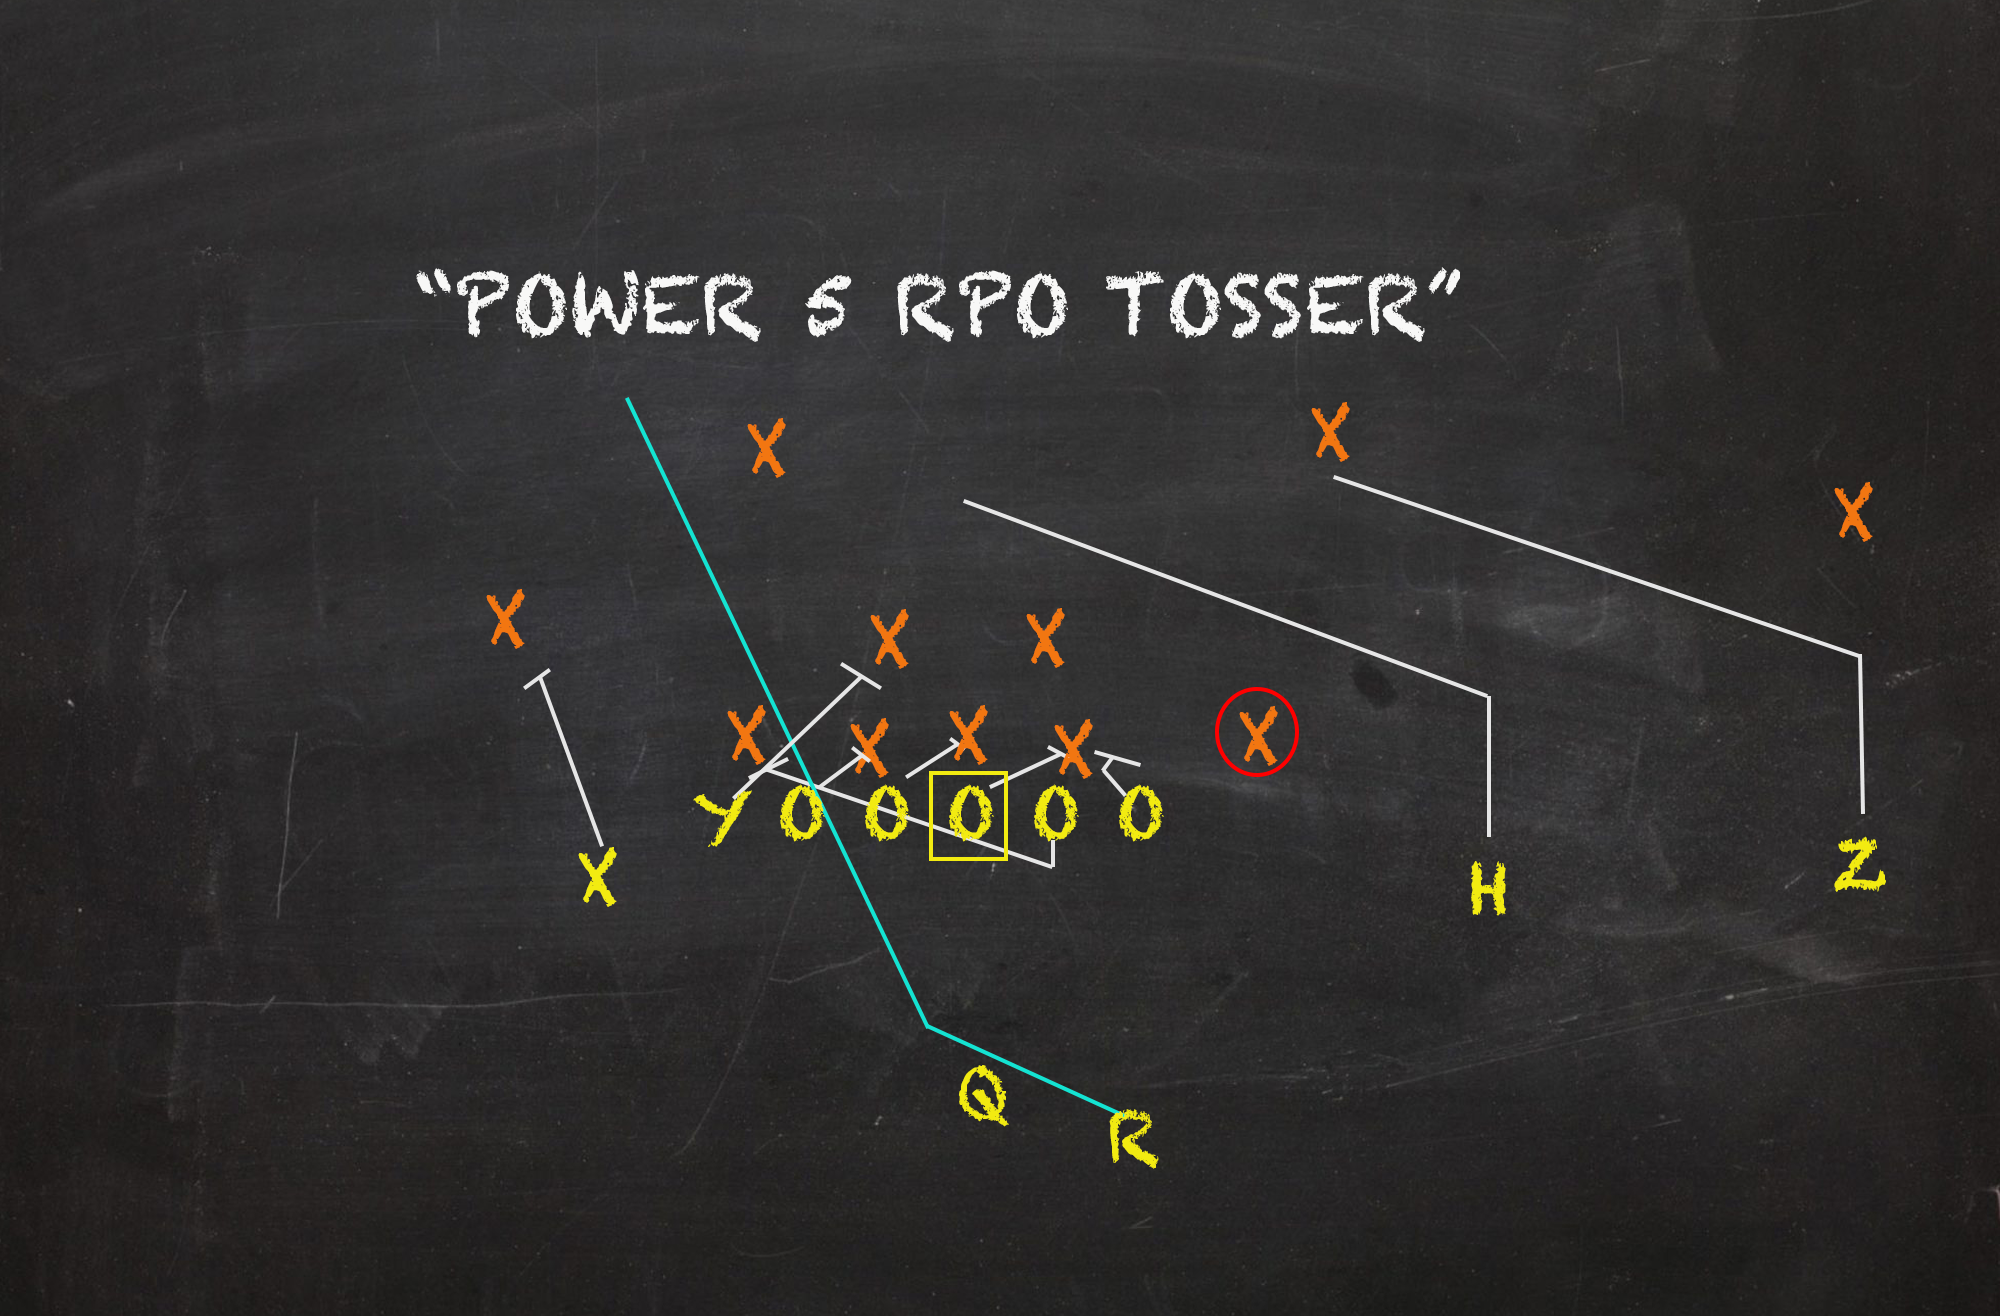
One of the themes among the top RPO tags centered around the ability to beat single-high. Levels – a series of rigid, stacking square in-breakers – is more keen to find openings against 2-deep shells. And wouldn’t you know it, the concept is being talked about as one of loser RPO looks within the SEC. Dropback tries held a clear edge. That said, a 6.2 Y/A and 44% Success Rate are pretty serviceable returns for considering their blandness. Along with dual/all slants “Tosser”, Levels is a favorite for some offenses to pair with outside read options like OZ Off-Tackle, Pin/Pull, and Buck Sweep. If defenders overpursue away, a trailing slant ought to find an opening.
Inside Zone Read
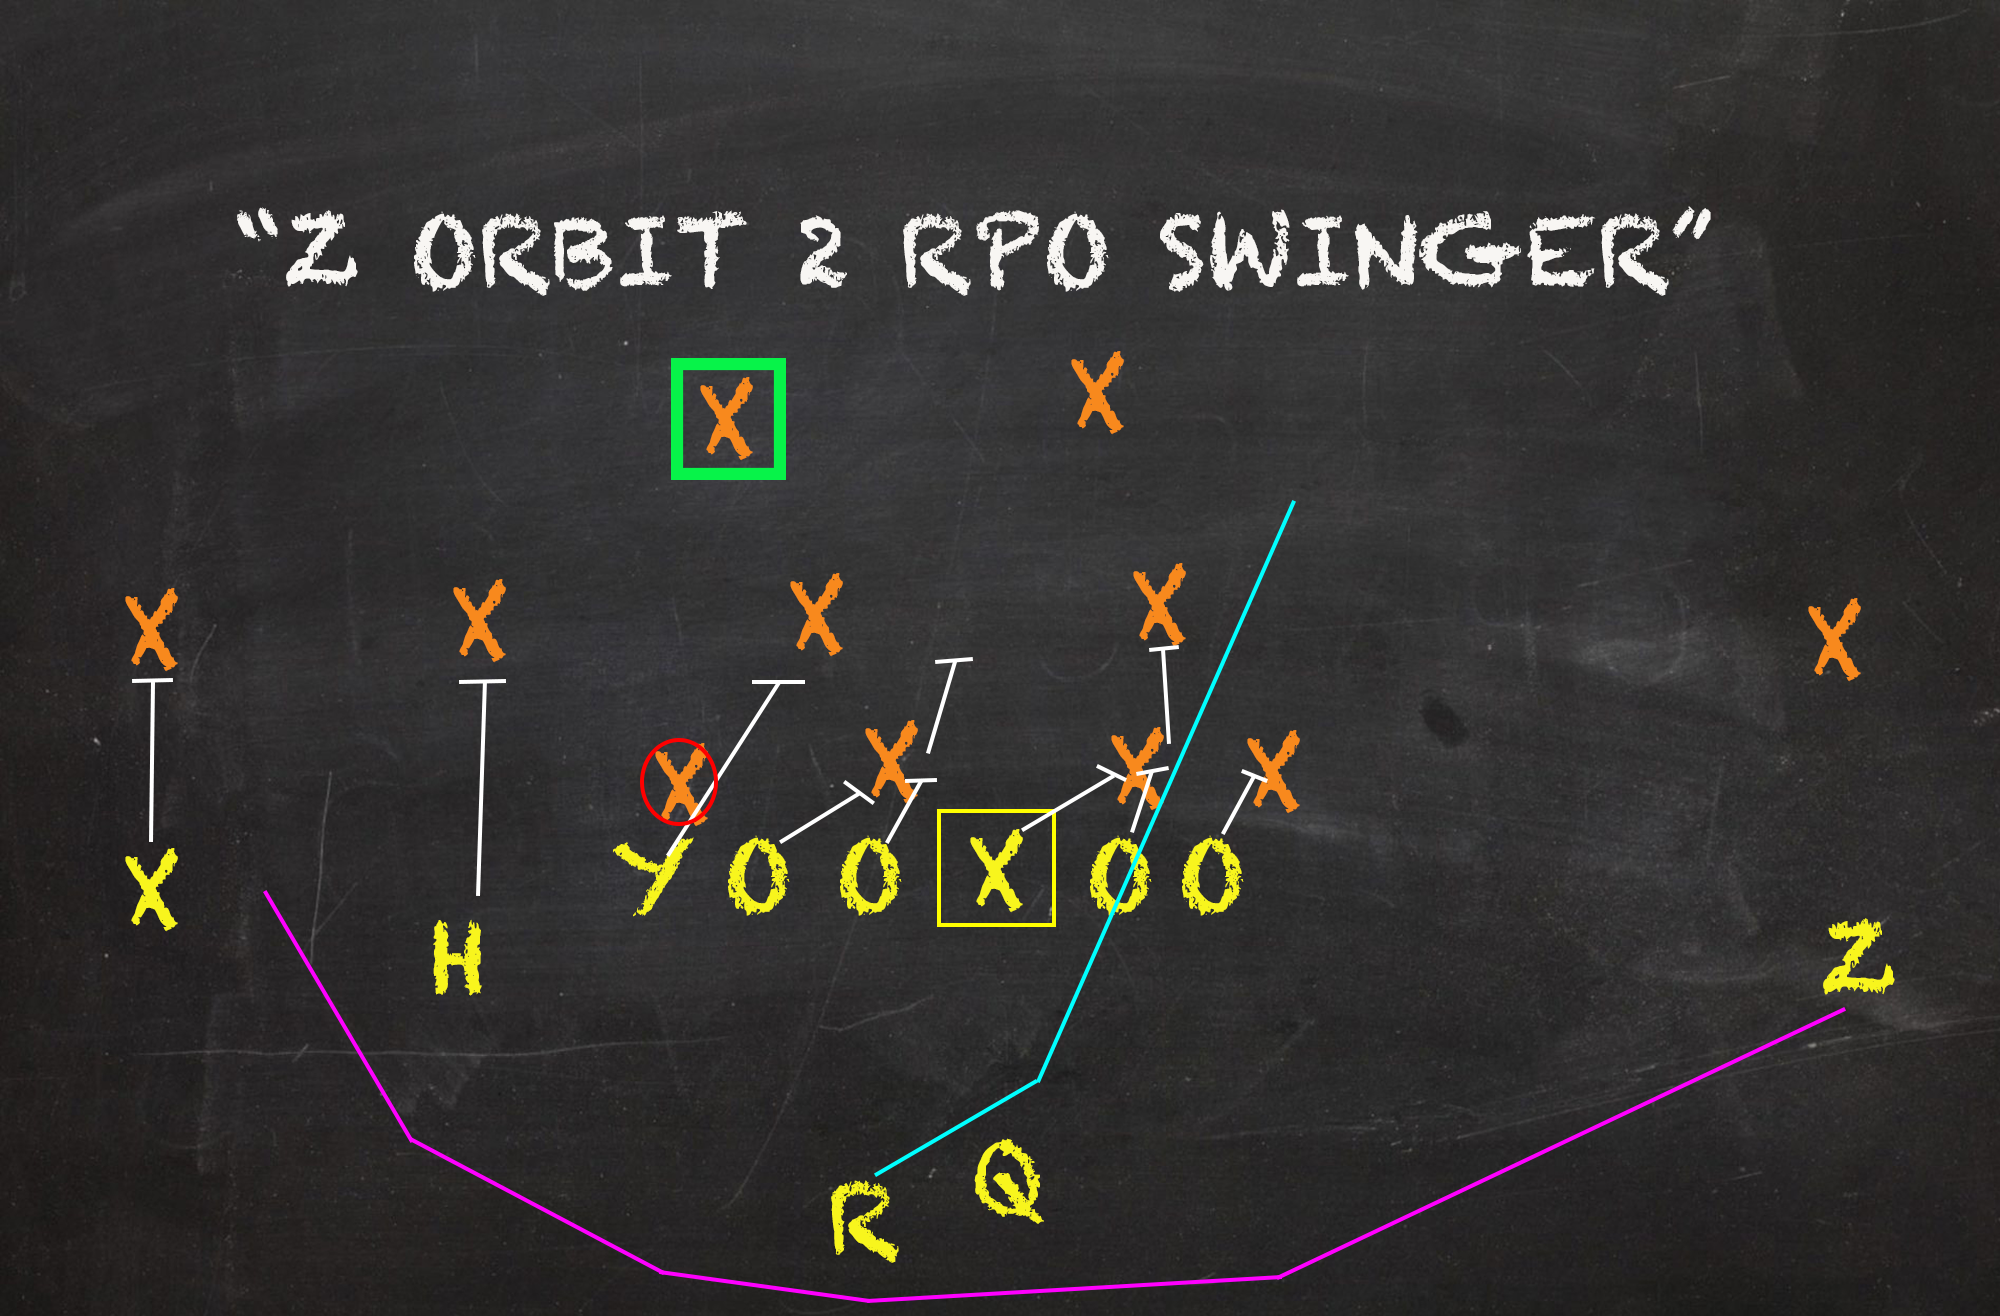
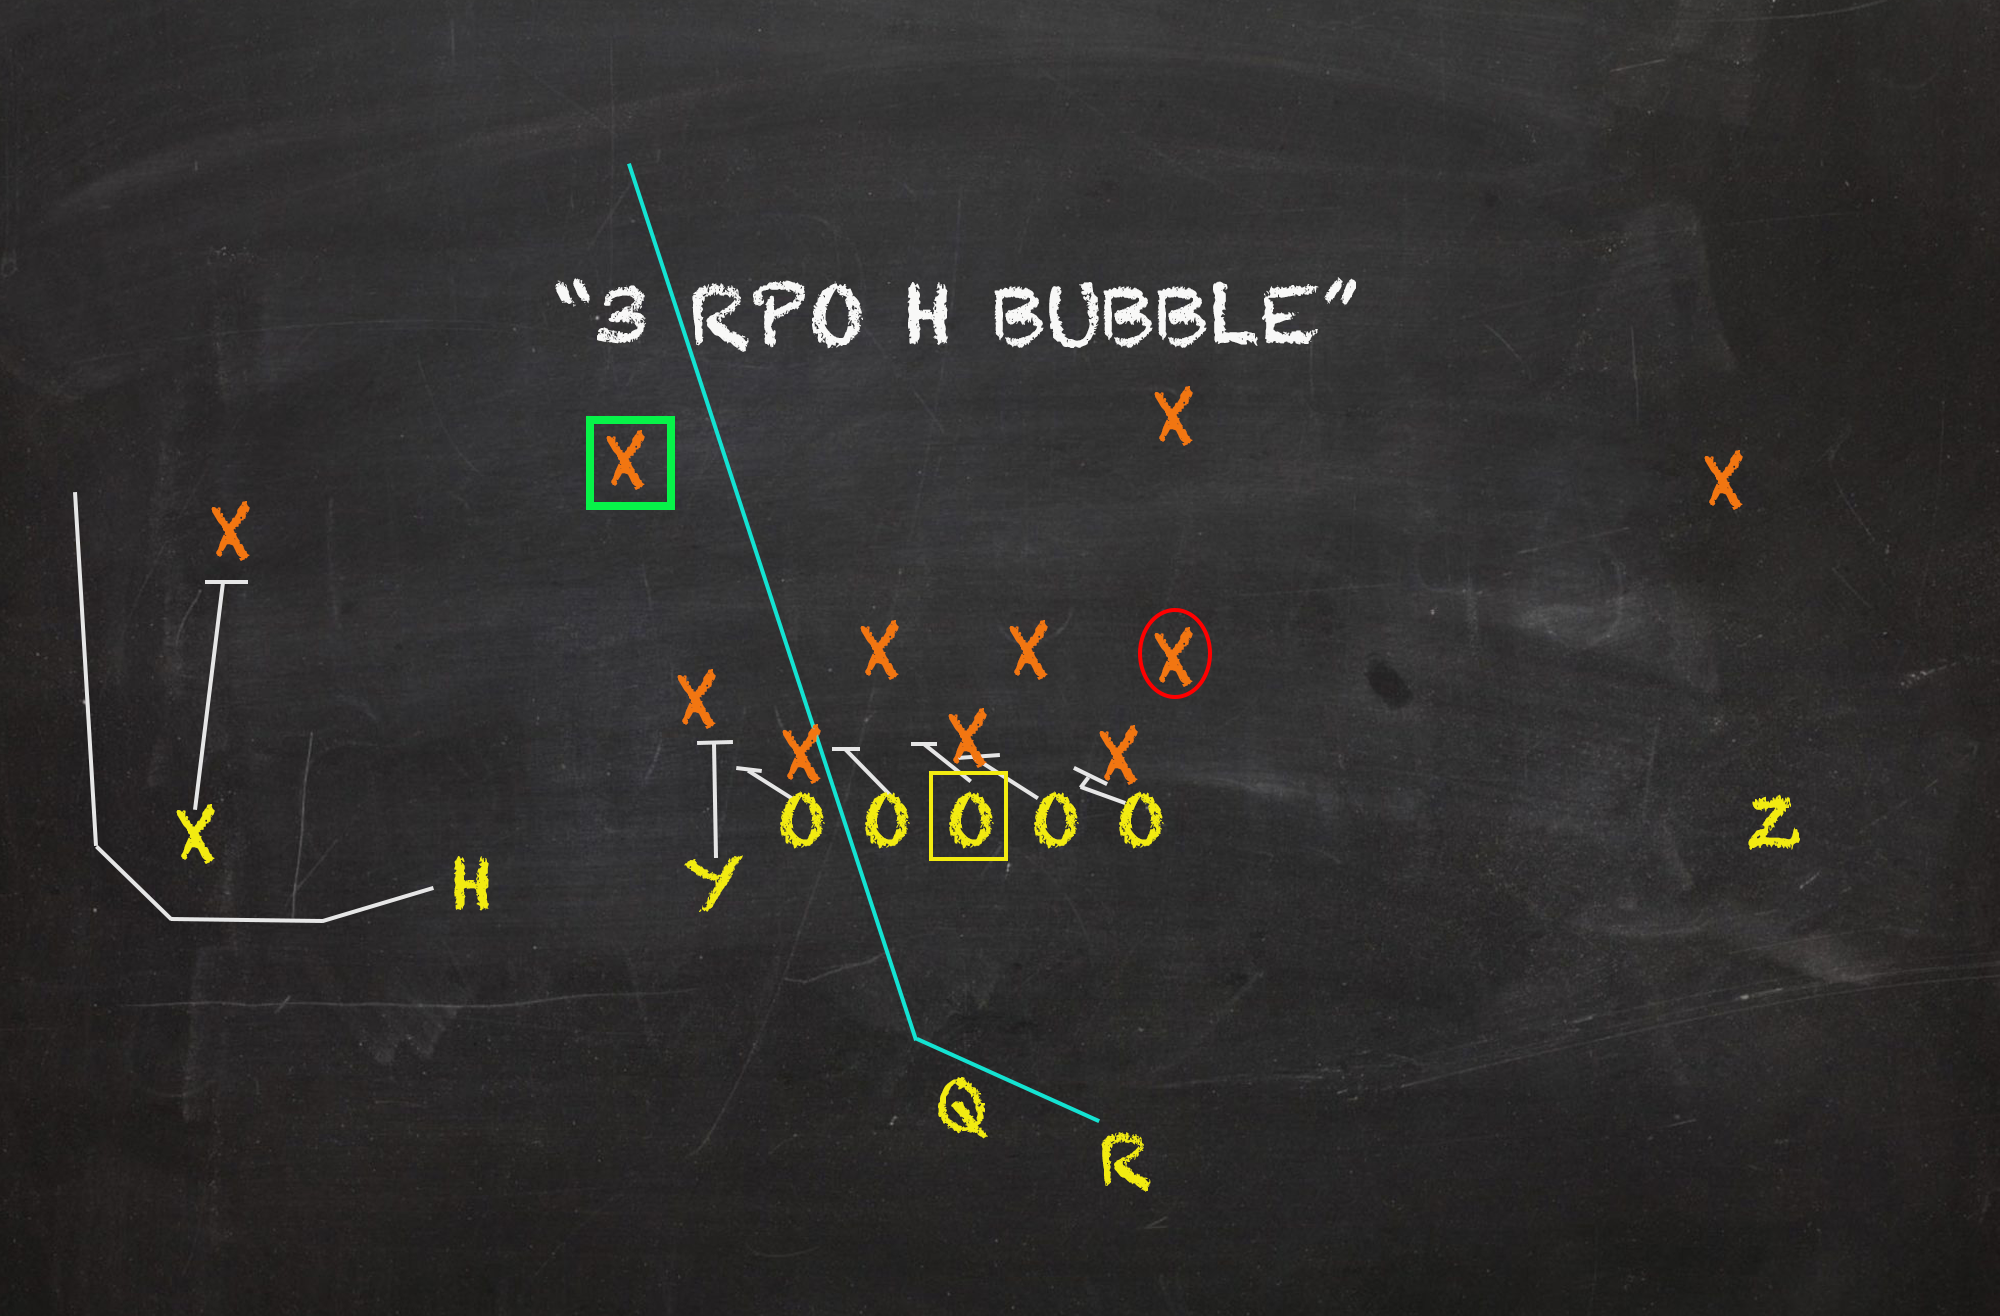
| Rushes | Yards/Carry | Success Rate |
| Concept with RPO | 5.0 | 46.0% |
| Concept w/o RPO | 5.1 | 50.4% |
Since 2018, no concept family has commanded a larger Play or Run Share than Inside Zone Reads – predominately fueled by the straight-flow Slam Read and split-flow Bluff Read. One could argue, the IZ Bubble Screen can be found in every single offense in America these days. Kitsch and cliche, defenses have become well-accustomed to stopping not only that RPO poster child but the root run as a whole, no matter the route tag. Like non-read versions, IZ RPOs were a lesser version of themselves. And though a 5.0 Y/A and 46% Success Rate are pretty decent stats for a run concept, non-RPO attempts topped the golden plateau and turned in a more attractive adjusted opportunity rating.