2021 Vision: Who is the SEC's RB1?
2021 Vision: Who is the SEC's RB1?
Who ya got? It's a simple question but often a sports debate staple. Especially in the SEC where it just means more, polite discourses frequently become passionate shouting matches. Spewing stats and situational traits laced in favoritism and bias rarely go anywhere unless it's a true slam dunk case. Otherwise, each camp becomes more entrenched on their respective side. Still, fat chance fanatics will give up on one of their most beloved offseason pastimes.
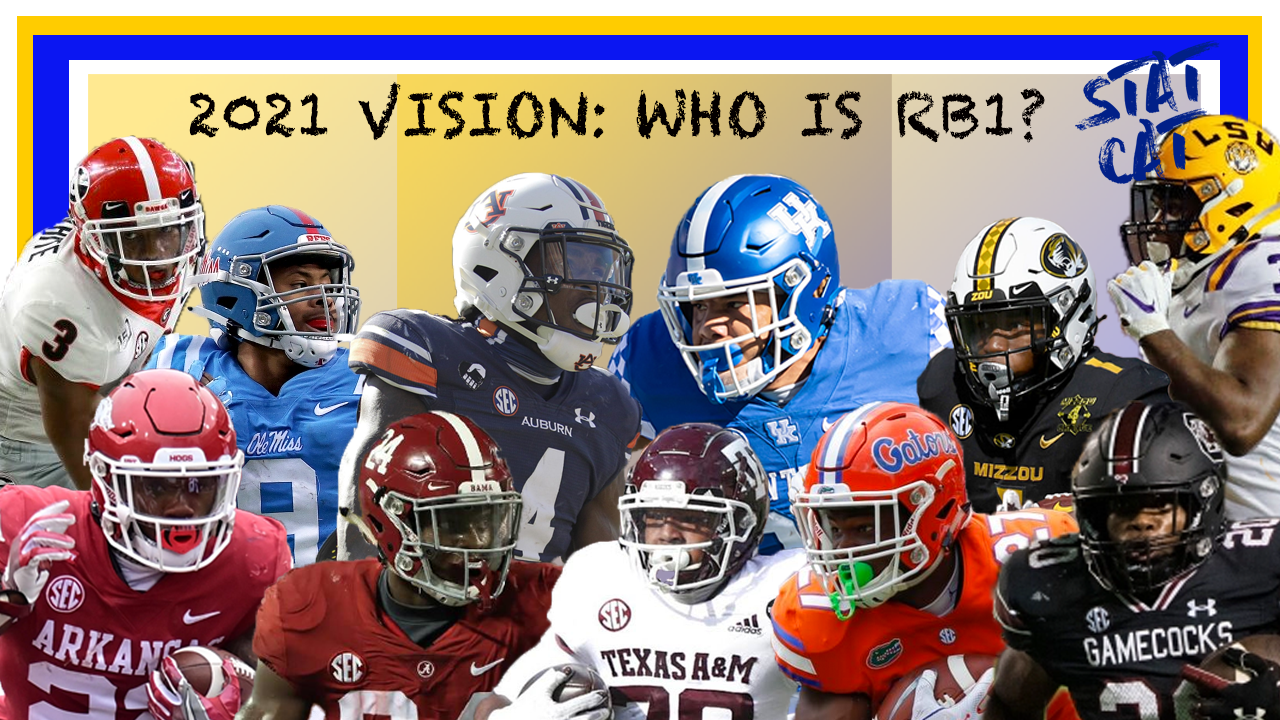
Depending on who you ask, a dozen dudes have potential to be the conference’s RB1 for 2021. Outside of the dark horse up-and-comers like Marshawn Lloyd, Devon Achane, or one of Georgia’s young guns, you have upperclassmen ready to make the most of their reps in Tyler Badie, Kevin Harris, and Dameon Pierce to name a few. While I remain high on quite a few conference ball carriers, I don’t take my endorsement for RB1 lightly. In order for a back to be considered for this illustrious honor, they needed to show a decent track record across a worthwhile sample in various situations. To make the initial cut, a back had to log 20 first down carries, 12 third down, “behind the chains”, with three yards or less to gain, and red zone carries (in addition to at least seven goal-to-go attempts) each, 30 zone runs, and 17 tries off power designs.
Overall findings will represent a ball carrier’s total body of work. First down tries help present a fair standard from which all runners perform. Down, distance, and scheme are far less of a factor; and thus, these downs help articulate one’s dependability to an extent. But for every bar-setting control, we need to measure elasticity. For that, one-off instances such as short yardage, behind the chains, 3rd down, and red zone chances will be examined. Though not the best gaugers for future performances, these snaps often are more valuable — ie tied to the outcome of a game. In addition to showing situational worth, a back should be versatile and show he can execute on a number of different concepts, which is why we’ll take a peak at splits on zone and power designs.
Each run category will have result-based figures (like Success Rate, First Down+TD Rate, and yards before contact) that are tied to the team rather than an individual as well as stable metrics (like Broken Tackle Rate, Gumption Rate, and yards after contact) that are more prognosticative on what to expect from a rusher moving forward. Not that a ball carrier can’t have a positive influence in his result-based items, but the other stuff is much more under his personal control.
After our initial cut, ten players survived: Tank Bigsby, Tyrion Davis-Price, Jerrion Ealy, Kevin Harris, Dameon Pierce, Brian Robinson, Chris Rodriguez, Tre Smith, Isaiah Spiller, and Zamir White. Once the fat was cut so that the best overall resumes remained, our five finalist include Bigsby, Ealy, Robinson, Rodriguez, and Spiller.
So without wasting more real estate setting up this premise, let’s get to it!
5. Brian Robinson Jr.
|
Overall Rushing min 50 att 2020 Rank (30) |
Success Rate |
Y/R |
First Down+ TD Rate |
Broken Tackle Rate |
EXR Rate (10+) |
Gumption Rate |
Negative Rate |
YBC AVR |
YAC AVR |
PPA/ play |
|
B. Robinson |
58.2% (2nd) |
5.31 (9th) |
39.6% (2nd) |
31.9% (9th) |
15.4% (12th) |
8.79% (2nd) |
4.40% (5th) |
1.49 (28th) |
3.81 (2nd) |
0.14 (17th) |
To kick us off, let’s start with Brian Robinson. Though he met our qualifications, this should be said from the onset: the vast majority of his college production has taken place when Alabama has held a comfortable lead. In fact just last year, only 19% of his carries occurred when the Tide were up by less than a touchdown. Because of that, analyzing his numbers requires more prudence. Playing from ahead in advantageous spots on one of the best offenses ever helped his overall metrics look exceptional. Robinson finished runner-up within the conference in Success Rate, First Down+TD Rate, Gumption Rate, and yards after contact average. Often playing with and against backups, his talent shined in the doldrums of garbage time. Despite sporting a bottom3 yards before contact average, his Yards/Carry and Broken Tackle Rate finished inside the SEC’s top10. But, the late heroics when the game was already decided prevented his Predictive Points Added/play from reaching the levels of other qualifiers. Again, there’s no question the Tider benefitted from his environment. But high-octane stable metrics in addition to increased usage has the old man primed to be one of the SEC’s top ball carriers.
|
1st Down Efficiency min 20 att 2021 rank (26) 2020 rank (39) |
Success Rate |
Y/R |
First Down+ TD Rate |
Broken Tackle Rate |
EXR Rate(10+) |
Gumption Rate |
Negative Rate |
YBC AVR |
YAC AVR |
USAGE |
|
B. Robinson |
44.4% (t-15/21) |
4.78 (20/24) |
17.8% (13/20) |
24.4% (16/22) |
13.3% (t-12/18) |
6.67% (t-8/9) |
6.67% (t-12/18) |
1.24 (25/37) |
3.53 (6/7) |
49.5% |
Outside of Chris Rodriguez, Zamir White, and Tre Smith, Robinson was the only qualifier to fail to see at least half of his carries occur on first down. Though the situations with the least amount of variables to potentially upend his output, the Tider was his worst self on these snaps. His Success Rate, Y/C, First Down+TD Rate, Gumption Rate and Broken Tackle Rate placed no better than 20th within the conference last year. His go-to trait of accumulating YAC was his lone bright spot. But with the 3rd-lowest YBC clip, not too many backs are bred to thrive with those conditions.
|
3rd Down Efficiency * only 6 att, not ranked |
Success Rate |
Y/R |
AVR to Gain |
Broken Tackle Rate |
EXR Rate (10+) |
Gumption Rate |
Negative% |
YBC AVR |
YAC AVR |
USAGE |
|
B. Robinson |
100% |
7.67 |
3.86 |
66.7% |
33.3% |
0.0% |
0.0% |
2.00 |
5.67 |
6.59% |
|
Short Yard Efficiency * only 11 att, not ranked |
Success Rate |
Y/R |
Broken Tackle Rate |
EXR Rate (10+) |
Gumption Rate |
Negative Rate |
YBC AVR |
YAC AVR |
USAGE |
|
|
B. Robinson |
100% |
5.55 |
54.6% |
9.09% |
9.09% |
0.0% |
1.36 |
4.18 |
12.1% |
|
|
Red Zone Rushing min 12, 7 att 2021 rank (16) 2020 rank (25) |
1D+TD Rate |
Y/R |
Broken Tackle Rate |
YBC AVR |
YAC AVR |
Goal to Go TD Rate |
Goal to Go YBC AVR |
Goal to Go YAC AVR |
Goal to Go Broken Tackle Rate |
RZ USAGE |
|
B. Robinson |
52.2% (1/1) |
4.22 (2/4) |
30.4% (5/8) |
1.30 (5/11) |
2.91 (1/1) |
54.6% (1/4) |
-0.18 (10/19) |
2.91 (1/1) |
54.6% (1/1) |
25.6% |
Game flow dictated his usage more than his contemporaries. He only logged 11 short yardage attempts and six 3rd down carries, which failed to meet my arbitrary parameter. Despite that, every single one of those carries resulted in a fresh set of downs. So I gave him a pass considering his YBC stayed near the conference floor and his YAC remained strong. Plus had he logged the appropriate number of carries, Robinson’s respective 54.5% and 66.7% Broken Tackle Rates would’ve held the SEC’s top spot. But while these returns perhaps hold less weight due to the small sample, the sixth-year experienced quite a bit of usage inside his opponent’s 20-yard line. Over a quarter of his 2020 tries occurred in this area of the field, and his touches were deserved. No conference rusher bested either his red zone First Down+TD Rate or scoring percentage on goal-to-go carries. Used to having to deal with early contact, Robinson was conditioned to get the job done in this manner.
|
Behind the Chains min 12 att, 2021 rank (16) 2020 rank (28) |
Success Rate |
Y/R |
First Down+ TD Rate |
Broken Tackle Rate |
EXR Rate (10+) |
Gumption Rate |
Negative Rate |
YBC AVR |
YAC AVR |
USAGE |
|
B. Robinson |
58.3% (2/2) |
6.88 (4/6) |
37.5% (2/3) |
29.7% (9/14) |
25.0% (3/t-4) |
12.5% (2/2) |
0.0% (t-1/1) |
2.54 (9/18) |
4.33 (3/4) |
26.4% |
Robinson was also seemingly unfazed when running behind the chains. With over a quarter of his attempts occurring these spots, only James Cook presented a better overall profile amongst qualifiers. Ahead of 2021, the Tider owns a top3 Success Rate, First Down+TD Rate, Explosive Run Rate, YAC average, and Gumption Rate. Thanks to his zeal, he prevented logging a negative try even if his Broken Tackle Rate dipped on these runs.
|
Power Rushing min 17 att 2021 rank (15) 2020 rank (26) |
Success Rate |
Y/R |
First Down+ TD Rate |
Broken Tackle Rate |
EXR Rate (10+) |
Gumption Rate |
Negative Rate |
YBC AVR |
YAC AVR |
USAGE |
|
B. Robinson |
62.0% (2/2) |
5.67 (6/9) |
42.2% (2/4) |
31.1% (4/6) |
15.6% (5/9) |
4.44% (9/13) |
4.44% (4/9) |
1.73 (12/22) |
3.93 (2/3) |
49.5% |
Despite thrusting forward with modern tactics, Alabama’s ground game as always strove to play physically. Though zones can be useful, there’s just something about riding behind two pullers into the teeth of the defense that puts some hair on your chest. Power schemes made up the plurality of Robinson’s carries and buoyed his overall numbers. With the exception to his Gumption Rate, every one of his figures from gap designs bested the Tider’s zone counterparts. As you can see, his resume is as good as any other SECer on these looks.
|
Zone Rushing Efficiency min 30 att 2021 rank (25) 2020 rank (36 |
Success Rate |
Y/R |
First Down+ TD Rate |
Broken Tackle Rate |
EXR Rate (10+) |
Gumption Rate |
Negative Rate |
YBC AVR |
YAC AVR |
USAGE |
|
B. Robinson |
55.0% (t-5/8) |
4.75 (14/20) |
37.5% (3/t-5) |
30.0% (7/9) |
15.0% (7/12) |
15.0% (1/1) |
5.0% (5/9) |
1.15 (24/35) |
3.60 (4/4) |
43.9% |
Only one other conference rusher suffered from a less preferable YBC clip on zone plays, which led to plenty of engagements in the backfield. Despite being hindered by contact behind the line on 20% of these carries, well over half resulted in situational success. Both his such First Down+TD Rate and YAC average were top5 worthy last fall. Though certainly worse by comparison to his returns on powers, Robinson’s bottomline from zone runs was still better than most.
While I chose to take his carries as is, I wanted to at least illustrate his play from the 19 attempts when Alabama failed to hold a comfortable lead. His YBC clip remained around a yard, but he averaged over four yards after engagement. Though he managed to turn shit into silver situationally late in games, his Success Rate was lukewarm despite an incendiary 15.8% TD Rate. Robinson’s overall tackle breaking was not as strong in these spots despite putting up a double-digit Gumption Rate. Though suffering from such a low YBC isn’t a great characteristic for long term success on the ground, that’s out of his control. Collectively, his stable metrics have been steady throughout his college career regardless of point margin, which makes his inclusion on this shortlist very justifiable.
4. Isaiah Spiller
|
Overall Rushing min 50 att 2020 Rank (30) |
Success Rate |
Y/R |
First Down+ TD Rate |
Broken Tackle Rate |
EXR Rate (10+) |
Gumption Rate |
Negative Rate |
YBC AVR |
YAC AVR |
PPA/ play |
|
I. Spiller |
51.3% (9th) |
5.59 (6th) |
31.6% (11th) |
30.5% (12th) |
17.1% (6th) |
5.35% (9th) |
9.09% (19th) |
2.60 (8th) |
2.98 (7th) |
0.24 (5th) |
Isaiah Spiller was a very good backfield option as an underclassmen. While positional attrition opened to door to more playing time, his stout play earned him the role of Texas A&M’s bellcow. By volume, he rushed for the conference’s 3rd-most yards, broke the 3rd-most tackles, and secured the 2nd-most first downs conversions. Only Larry Rountree, Najee Harris, and Kevin Harris totaled a higher percentage of their team’s designed carries. But while Spiller received plenty of touches, a good amount of his efficiency stats cracked the conference’s top10. As the Maroon Goons found their footing as veterans, the Aggies became one of the SEC’s most-dedicated and best rushing attacks. In meaningful minutes, no team bested their rush yards before contact average. With a noticeable buffer between him and defenders, Spiller snatched the 6th-best Yards/Carry and Explosive Run Rate. His own personal YBC clip was top8-worthy. But even though his yards after contact average also crossed that threshold, both his Broken Tackle Rate and First Down+TD Rate fell outside the top10 in 2020. Despite failing to impress, Spiller’s figure of the latter increased 12 percentage points year-over-year. In the end, Spiller’s consistency, potency, and dependability helped him field one of the best Predictive Points Added/play within the conference. With a boatload of departures and a green passing game, there’s a considerable expectation that Spiller will be the face of the Aggies' offense as well as its main engine.
|
1st Down Efficiency min 20 att, 2021 rank (26) 2020 rank (39) |
Success Rate |
Y/R |
First Down+ TD Rate |
Broken Tackle Rate |
EXR Rate (10+) |
Gumption Rate |
Negative Rate |
YBC AVR |
YAC AVR |
USAGE |
|
I. Spiller |
45.7% (14/19) |
5.51 (9/12) |
20.0% (t-8/14) |
27.6% (11/14) |
15.2% (11/16) |
2.86% (t-18/23) |
8.57% (19/27) |
2.33 (13/20) |
3.18 (8/10) |
56.2% |
Only Kentucky ran the ball more to start a set of downs than TAMU within the SEC. No qualifying ball carrier saw a higher percentage of his carries occur in those spots than Spiller. Though a steady workflow, his production was more middling than anything. Only two of his metrics crack the top10 amongst returners. At least one of them was a stable metric ala his sturdy 3.18 YAC average. With the lack of deviation in attack, defenses did a fairly good job limiting his alleys as his YBC shrunk by about a third of a yard compared to his overall clip. And while breakaways helped pad his yards after contact, his tackle breaking was not as reliable snap-to-snap.
|
3rd Down Running Efficiency min 12 att, 2021 rank (9) 2020 rank (16) |
Success Rate |
Y/R |
AVR to Gain |
Broken Tackle Rate |
EXR Rate (10+) |
Gumption Rate |
Negative Rate |
YBC AVR |
YAC AVR |
USAGE |
|
I. Spiller |
55.0% (5/8) |
5.20 (2/3) |
6.40 (1/1) |
15.0% (5/11) |
15.0% (4/4) |
5.00% (7/11) |
5.00% (5/5) |
3.40 (1/1) |
1.80 (6/8) |
10.7% |
|
Short Yard Efficiency min 12 att, 2021 rank (14) 2020 rank (21) |
Success Rate |
Y/R |
Broken Tackle Rate |
EXR Rate (10+) |
Gumption Rate |
Negative |
YBC AVR |
YAC AVR |
USAGE |
|
I. Spiller |
75.0% |
5.84 |
37.5% |
15.6% |
9.38% |
9.28% |
2.44 |
3.41 |
17.1% |
|
Red Zone Rushing min 12, 7 att 2021 rank (16) 2020 rank (25) |
1D+TD Rate |
Y/R |
Broken Tackle Rate |
YBC AVR |
YAC AVR |
Goal to Go TD Rate |
Goal to Go YBC AVR |
Goal to Go YAC AVR |
Goal to Go Broken Tackle Rate |
RZ USAGE |
|
I. Spiller |
43.8% (5/7) |
3.44 (6/11) |
40.6% (2/4) |
1.0 (12/22) |
2.44 (3/4) |
41.7% (t-6/10) |
0.92 (4/9) |
1.00 (t-6/13) |
16.7% (t-4/10) |
17.1% |
Though he was a successful rusher on the money down, he mostly let his dudes up front do the heavy lifting. No conference ball carrier benefited from as much cushion on 3rd downs than Spiller’s 3.40 YBC clip. Despite rocking the highest average yards to gain, his Success Rate, Y/C, and Explosive Run Rate all crack the top4 ahead of this fall. Despite the push, Spiller showed he wasn’t a total freeloader in these spots. His Broken Tackle Rate will be the SEC’s 5th-best amongst returners and his YAC average sits inside the top6. In true short yardage situations, the Aggies' prowess punishing fronts continued, but Spiller seemingly ran with more determination. Once again he was blessed with a top5 before contact average that overly aided the rest of his result-based metrics. But since nearly a fifth of these runs experienced defensive engagement behind the line of scrimmage, Spiller was forced to take matters into his own hands. He responded with a top3 Broken Tackle Rate and YAC average plus a top8 Gumption Rate. Spiller also accomplished that feat inside the red zone despite TAMU’s rushing attack losing its mojo. Slipping out of takedowns was more by necessity than choice. Whether just inside his opponent’s 20 or on a goal-to-go carry, Spiller only averaged about a yard before contact, which muted his profile in this area of the field.
|
Behind the Chains min 12 att, 2021 rank (16) 2020 rank (28) |
Success Rate |
Y/R |
First Down+ TD Rate |
Broken Tackle Rate |
EXR Rate (10+) |
Gumption Rate |
Negative Rate |
YBC AVR |
YAC AVR |
USAGE |
|
I. Spiller |
34.2% (10/14) |
5.71 (8/13) |
20.0% (t-7/11) |
40.0% (4/5) |
22.9% (5/7) |
11.4% (4/4) |
14.3% (13/21) |
3.06 (4/9) |
2.66 (9/16) |
18.7% |
Spiller’s output behind the chains was mixed. His YBC clip cracked the top10, which aided his great Explosive Run Rate. But when he wasn’t ripping off ten-plus yard carries, he was forgettable in this context. Barely a third of his total carries accomplished situational goals. Despite run defenses typically loosing up in these spots, opponents continued to pressure Spiller. He was hit in the backfield on an insane 25% of his such carries — by far the most by any qualifier. Per his top5 Broken Tackle Rate, Spiller went down swinging and touts a top10 YAC average ahead of this fall. That should help rose-scent his output from this unstable situation.
|
Zone Rushing Efficiency min 30 att 2021 rank (25) 2020 rank (36) |
Success Rate |
Y/R |
First Down+ TD Rate |
Broken Tackle Rate |
EXR Rate (10+) |
Gumption Rate |
Negative Rate |
YBC AVR |
YAC AVR |
USAGE |
|
I. Spiller |
51.2% (9/12) |
5.35 (7/12) |
35.9% (5/9) |
32.8% (6/8) |
16.0% (6/11) |
6.87% (3/3) |
6.11% (8/16) |
2.19 (13/21) |
3.16 (7/9) |
70.0% |
Exactly 70% of Spiller’s runs occurred on zone designs so they played a big hand in his final bottom line. Though the Aggie sported a 51% Success Rate in both facets, he himself was a more consistent option off zones. Spillers such First Down+TD Rate was over 14 points higher, his such Broken Tackle Rate was almost ten points better, and his such YAC average was about a half a yard more than his power counterparts. All of those stats cracked the SEC’s top10 last year despite a 2.13 YBC average that upped the ante.
|
Power Rushing Efficiency min 17 att 2021 rank (15) 2020 rank (26) |
Success Rate |
Y/R |
First Down+ TD Rate |
Broken Tackle Rate |
EXR Rate (10+) |
Gumption Rate |
Negative Rate |
YBC AVR |
YAC AVR |
USAGE |
|
I. Spiller |
51.1% (6/10) |
6.34 (3/4) |
21.3% (11/21) |
23.4% (9/12) |
19.2% (3/5) |
2.13% (12/18) |
17.0% (11/23) |
3.66 (3/4) |
2.68 (6/8) |
25.1% |
Despite experiencing a more cushion on average, none of those clips reached that threshold on gap scheme runs. These plays as literal counters to the Aggies’ zone-based attack, were turbulent even if half of them worked. A fifth suffered from defensive contact behind the line, but Spiller managed to boast a top4 Y/C and top5 Explosive Run Rate last year. Though not as strong as other contexts, his Broken Tackle Rate and YAC average were still relatively fine compared to his contemporaries. It’s amazing that a sixth of his power runs resulted in a loss and yet his cumulative figures remained firm.
Spiller was the only qualifier to don a top10 overall YBC and YAC average. He’s work after engagement hasn’t wavered much and his tackle breaking has gotten better with more reps. Losing quality linemen will sting and TAMU’s pass game doesn’t appear to have many answers on solving their splash play woes so those stable metrics are sure to be put to the test in the near future. Spiller’s efficiency is bound to regress. But if he can control his carries and perform under the gun, his volume should keep him healthily in the discussion for RB1 as 2021 progresses.
3. Jerrion Ealy
|
Overall Rushing min 50 att 2020 Rank (30) |
Success Rate |
Y/R |
First Down+ TD Rate |
Broken Tackle Rate |
EXR Rate (10+) |
Gumption Rate |
Negative Rate |
YBC AVR |
YAC AVR |
PPA/ play |
|
J. Ealy |
49.9% (13th) |
5.07 (11th) |
32.7% (9th) |
31.9% (8th) |
18.4% (4th) |
4.08% (18th) |
10.9% (24th) |
2.39 (18th) |
2.68 (13th) |
0.21 (8th) |
Jerrion Ealy is a firecracker. He’ll either excite and delight or disappoint with a dud. Rarely is there middle ground with his carries. Though some of his big play stats failed to match last year’s totals, his Explosive Run Rate and Broken Tackle Rate each again crossed the 18% and 31% plateaus, respectively. He didn’t always break free, but he usually made bringing him down a chore for opponents. Despite the fire, his yards after contact average deteriorated by nearly two yards year-over-year. Though losing Rich Rodriguez hurt continuity, early defensive contact was the prime culprit as to why Ealy looked less potent. While being hit behind the line on over 15% of his attempts this season, only six SECers logged a higher Negative Run Rate. These consistent dings kept his Success Rate and Yards/Carry outside of the conference’s top10, but his big gainers allowed his First Down+TD Rate and Predictive Points Added/play to cross that threshold. Per Pro Football Focus, 48% of his runs gained at least 3 yards after contact, which was the 8th-best mark in the power5. Breakaway runs aren’t supposed to be a consistent running back trait in the eyes of analytics, but Ealy seems to be leading the charge rebelling against that notion.
|
1st Down Efficiency min 20 att, 2021 rank (26) 2020 rank (39) |
Success Rate |
Y/R |
First Down+ TD Rate |
Broken Tackle Rate |
EXR Rate (10+) |
Gumption Rate |
Negative Rate |
YBC AVR |
YAC AVR |
USAGE |
|
J. Ealy |
48.1% (11/14) |
4.87 (17/21) |
24.6% (5/6) |
23.4% (18/25) |
19.5% (8/11) |
2.60% (20/25) |
12.9% (21/32) |
2.56 (11/18) |
2.31 (18/22) |
52.4% |
On first downs, Ealy was a pretty middle-of-the-road product. Some would even be so bold to say he was overly subpar. Though nearly a quarter of his such runs resulted in a conversion or a score and his Explosive Run Rate bested his overall clip, a gaudy 12.9% Negative Run Rate dampened his output. In the end, less than half of his carries found situational success and his Y/C on firsts finished under five yards. Perhaps it was the added pace Ole Miss featured, but Ealy just didn’t hit holes with gusto consistently. Though one of the top returners in YAC average ahead of 2020, his clip in these spots fell inside the bottom4. The Rebels turned in an even-keel Run:Pass Ratio, but these muted returns indicate the Rebels might be better off passing more to start a set of downs.
|
Short Yard Efficiency min 12 att, 2021 rank (14) 2020 rank (21) |
Success Rate |
Y/R |
Broken Tackle Rate |
EXR Rate (10+) |
Gumption Rate |
Negative Rate |
YBC AVR |
YAC AVR |
USAGE |
|
|
J. Ealy |
68.4% (t-9/12) |
3.53 (9/14) |
36.8% (4/5) |
10.5% (5/10) |
10.5% (t-5/5) |
2.26% (5/7) |
1.42 (7/13) |
2.11 (9/13) |
12.9% |
|
|
3rd Down Efficiency min 12 att, 2021 rank (9) 2020 rank (16) |
Success Rate |
Y/R |
AVR to Gain |
Broken Tackle Rate |
EXR Rate (10+) |
Gumption Rate |
Negative Rate |
YBC AVR |
YAC AVR |
USAGE |
|
J. Ealy |
52.6% (6/9) |
4.53 (6/8) |
4.26 (3/5) |
47.4% (2/3) |
15.8% (3/3) |
5.26% (6/10) |
5.26% (t-6/6) |
2.63 (4/4) |
1.89 (5/7) |
12.9% |
|
Red Zone Rushing min 12, 7 att 2021 rank (16) 2020 rank (25) |
1D+TD Rate |
Y/R |
Broken Tackle Rate |
YBC AVR |
YAC AVR |
Goal to Go TD Rate |
Goal to Go YBC AVR |
Goal to Go YAC AVR |
Goal to Go Broken Tackle Rate |
RZ USAGE |
|
J. Ealy |
46.7% (4/5) |
4.97 (1/1) |
33.3% (3/6) |
2.53 (1/3) |
2.43 (4/5) |
41.7% (t-6/10) |
-0.25 (11/20) |
1.75 (2/4) |
16.7% (t-4/10) |
20.4% |
On third downs, Ealy was better than most; it’s always nice to finish on the good side of 50% on these snaps. Amongst returners, his Success Rate just missed making the top5 despite averaging the conference’s 5th-highest yards to gain figure. The Rebel still experienced contact behind the line on over a tenth of his tries; but on the do or die down, he often cranked it up a notch. Ealy’s 47.4% Broken Tackle Rate only trailed Tank Bigsby’s and helped inflate his overall clip. Just under 13% of Ealy’s carries came on third down, which is the 3rd-highest clip ahead of 2021 within the SEC. He was equally adequate within the red zone. His such Success Rate, Broken Tackle Rate, and YAC average all made next year’s top4. Plus, no SECer trumped his 4.97 Y/C in this area of the field. But on goal-to-go carries, Ealy was slowed a bit by terrible blocking. No qualifier sported a worst yards before contact clip. In other instances with three yards or less to gain, his final results were relatively whatever. But the Rebel showed fight and continued to live up to his reputation as a hard man to bottle up.
|
Behind the Chains min 12 att, 2021 rank (16) 2020 rank (28) |
Success Rate |
Y/R |
First Down+ TD Rate |
Broken Tackle Rate |
EXR Rate (10+) |
Gumption Rate |
Negative Rate |
YBC AVR |
YAC AVR |
USAGE |
|
J. Ealy |
44.7% (4/5) |
6.84 (6/8) |
28.9% (5/6) |
42.1% (3/4) |
23.7% (4/6) |
5.26% (9/13) |
5.26% (8/11) |
2.76 (5/13) |
4.08 (4/5) |
25.9% |
When behind the chains, defenses presented some breathing room anticipating a pass. And with opponents on their heals, Ealy wasn’t afraid to take it to and punish undermanned boxes. In addition to boasting a top5 Success Rate, YAC average, First Down+TD Rate, and Broken Tackle Rate, Ealy’s zeal helped log an explosive carry on almost a quarter of his attempts. Considering the high degree of difficulty, these are the value plays that make him a back worth touting.
|
Zone Rushing min 30 att 2021 rank (25) 2020 rank (36) |
Success Rate |
Y/R |
First Down+ TD Rate |
Broken Tackle Rate |
EXR Rate (10+) |
Gumption Rate |
Negative Rate |
YBC AVR |
YAC AVR |
USAGE |
|
J. Ealy |
47.5% (14/17) |
4.99 (10/15) |
30.7% (12/17) |
34.7% (5/7) |
13.9% (10/15) |
2.97% (15/27) |
6.93% (11/20) |
2.27 (12/19) |
2.72 (11/13) |
68.7% |
With the offensive braintrust staying intact and Corral daring keeping secondaries at bay, Ealy should experience some positive improvement assuming the new offensive line coach can get Ole Miss’s big boys into shape. Schematically, Jeff Lebby probably won’t alter things too much on the ground. Last year, just over two-thirds of Ealy’s carries occurred on zone looks, which is on the low side compared to most SECers. With these plays often rooting Ole Miss’s early down efforts, zones were overly plug and chug designs with low ceilings. Despite his admirable Broken Tackle Rate, his Explosive Run Rate on these snaps was about ten percentage points worse than his such clip on power schemes.
|
Power Rushing Efficiency min 17 att 2021 rank (15) 2020 rank (26) |
Success Rate |
Y/R |
First Down+ TD Rate |
Broken Tackle Rate |
EXR Rate (10+) |
Gumption Rate |
Negative Rate |
YBC AVR |
YAC AVR |
USAGE |
|
J. Ealy |
55.9% (5/8) |
4.59 (11/16) |
32.4% (6/10) |
23.5% (t-7/10) |
23.5% (2/3) |
5.88% (t-4/6) |
17.7% (12/24) |
2.21 (6/12) |
2.38 (10/15) |
23.1% |
Ealy’s boom or bust nature was on full display on gap plays. His 17.7% Negative Play Rate was abhorrent even by his standards, but his 23.5% Explosive Run Rate buoyed his entire profile. Counterintuitively, this caused his Success Rate to be one of the conference’s best while his Y/C fell outside the top10. Still, Ealy seeing over half of these runs beat situational goals despite being hit in the backfield on nearly a quarter of his tries is damn impressive if you ask me.
Ealy should out-touch Snoop Conner barring injury. But, whoever is in the backfield won’t be efficient if the dudes upfront continue to be halfcocked. Though Ealy did better than most dealing with these circumstances, he’s far from an eraser. Only ten of his 27 runs that experienced defensive contact behind the line of scrimmage resulted in a positive gain. No conference qualifier logged a worse such conversion rate. He’s absolutely one of the hardest rushers to tackle in the SEC once he gets some forward inertia going, but a little bit of extra cushion can go a long way for Ealy. His potency can only be so effective juxtaposed against his dozens of negative downs.
2. Tank Bigsby
|
Overall Rushing min 50 att 2020 Rank (30) |
Success Rate |
Y/R |
First Down+ TD Rate |
Broken Tackle Rate |
EXR Rate (10+) |
Gumption Rate |
Negative Rate |
YBC AVR |
YAC AVR |
PPA/ play |
|
T. Bigsby |
52.2% (8th) |
6.04 (4th) |
36.9% (3rd) |
42.0% (1st) |
16.7% (7th) |
7.97% (3rd) |
6.52% (11th) |
2.53 (12th) |
3.51 (4th) |
0.20 (9th) |
There’s no getting around Tank Bigsby’s fantastic freshman campaign. Due to his modus operandi, age, and being Auburn’s main offensive attraction, he’s a trendy pick for RB1 as well as a Heisman dark horse. War Eagle is screeching to the high heavens about this kid’s talent, and not too many are dismissing his upside. In fact, Pro Football Focus has the soon-to-be sophomore as “the clear favorite to claim the title of No. 1 running back in 2021”. What backs do after contact typically helps them stand out favorably via analytics. Concisely, any back can hit an open hole to space; not everyone can make a dude miss or compile yardage after that encounter. Living up to his namesake, Bigsby’s Broken Tackle Rate reigned supreme over the entire conference in 2020. By volume, only Najee Harris totaled more than his 58. Behind these bountiful bust-outs, his Yards/Carry, yards after contact average, Gumption Rate, and First Down+TD Rate all cracked the SEC’s top4. For good measure, his Success Rate, Explosive Run Rate, and Predictive Points Added/play were top10 worthy.
|
1st Down Efficiency min 20 att, 2021 rank (26) 2020 rank (39) |
Success Rate |
Y/R |
First Down+TD Rate |
Broken Tackle Rate |
EXR Rate (10+) |
Gumption Rate |
Negative Rate |
YBC AVR |
YAC AVR |
USAGE |
|
T. Bigsby |
50.0% (t-8/12) |
7.22 (3/3) |
26.3% (4/5) |
46.1% (3/3) |
22.4% (4/5) |
7.89% (5/5) |
3.95% (11/13) |
3.16 (5/8) |
4.07 (3/3) |
55.1% |
Auburn’s line was better than advertised last year (in meaningful minutes the Tigers averaged the SEC’s 3rd-best rush yards before contact average), but they still succumbed to plenty of defensive Havoc plays. In regards to Bigsby, his 3.15 YBC average was a top5 clip, yet over a seventh of his tries experienced contact behind the line of scrimmage. Though that dropped down a few points, his clip on first downs still reached the double digits. This inconsistency, however, did little to upend the Tank as his Broken Tackle Rate, Gumption Rate, and Explosive Carry Rate all finished as the best clips among the rushers featured in this piece. Exactly half of his carries to start a set of downs were successful. Plus his Y/C and YAC average weren’t far off from the conference’s top spot.
|
3rd Down Efficiency min 12 att, 2021 rank (9) 2020 rank (16) |
Success Rate |
Y/R |
AVR to Gain |
Broken Tackle Rate |
EXR Rate (10+) |
Gumption Rate |
Negative Rate |
YBC AVR |
YAC AVR |
USAGE |
|
T. Bigsby |
91.7% (1/1) |
4.92 (3/4) |
1.83 (8/15) |
50.0% (1/t-1) |
8.33% (7/t-8) |
16.7% (t-1/1) |
0.0% (t-1/1) |
1.67 (7/11) |
3.25 (1/2) |
8.70% |
|
Short Yard Efficiency min 12 att, 2021 rank (14) 2020 ran (21) |
Success Rate |
Y/R |
Broken Tackle Rate |
EXR Rate (10+) |
Gumption Rate |
Negative Rate |
YBC AVR |
YAC AVR |
USAGE |
|
T. Bigsby |
80.0% (3/4) |
4.15 (7/10) |
50.0% (2/2) |
5.00% (11/16) |
15.0% (2/2) |
15.0% (12/17) |
1.10 (8/15) |
3.05 (3/5) |
14.5% |
|
Red Zone Rushing min 12, 7 att 2021 rank (16) 2020 rank (25) |
1D+TD Rate |
Y/R |
Broken Tackle Rate |
YBC AVR |
YAC AVR |
Goal to Go TD Rate |
Goal to Go YBC AVR |
Goal to Go YAC AVR |
Goal to Go Broken Tackle Rate |
RZ USAGE |
|
T. Bigsby |
50.0% (2/2) |
4.00 (4/6) |
40.9% (1/3) |
1.14 (10/18) |
2.86 (2/2) |
42.9% (5/9) |
1.57 (t-1/2) |
0.29 (11/20) |
0.0% (t-10/18) |
15.9% |
Though more-than-serviceable on early downs, Bigsby’s talent really shined through in the spots where you’d like your back to take care of business. Ball carriers tend to earn their stripes on later down or short yardage situations, and the Tiger certainly came through in these respects. Like his overall profile hints, no returning SECer can challenge his short yardage, 3rd Down, or red zone Broken Tackle Rate. While also being top3 in YAC, all three of his respective First Down+TD Rates meet that criteria as well. Thanks to some misfires around the conference during bowl season, Bigsby is the SEC’s undisputed most efficient back on the money down. He prevented logging a single negative 3rd down try despite being hit behind the line on a seventh of his attempts. Though his profile dipped a little in true short yardage situations, he still was a top performer. Plus, Bigsby joins Brian Robinson as the only returner to see at least half of his red zone tries result in either a conversion or a score. Cumulatively, this high level of proficiency on these clutch runs allowed Bigsby’s Wins Above Average to finish as college football’s 5th-best clip in 2020 when excluding QBs per PFF.
|
Behind the Chains min 12 att, 2021 rank (16) 2020 rank (28) |
Success Rate |
Yards/Run |
First Down+ TD Rate |
Broken Tackle Rate |
EXR Rate (10+) |
Gumption Rate |
Negative Rate |
YBC AVR |
YAC AVR |
USAGE |
|
T. Bigsby |
35.1% (9/13) |
5.00 (t-10/18) |
27.0% (6/7) |
29.7% (9/14) |
13.5% (10/17) |
2.70% (11/17) |
2.70% (5/7) |
2.19 (12/24) |
2.81 (5/9) |
26.9% |
The only unstable situation in which Bigsby failed to standout was when he carried the rock behind the chains. On these snaps, his bottomline was average at best thanks to the fact he, for whatever reason, wasn’t as keen of busting out of tackles. Though still relatively good, his Broken Tackle Rate fell outside the top5. And these mediocre figures come despite Auburn’s line only allowing defenders to hit Bigsby behind the line on 5.2 %percent of his carries behind the chains — by far one of his most generous environments. In the grand scope of things, however, this hardly is a concern. Behind the chains runs — like short yardage, 3rd down, and red zone carries — are called unstable situations because they rarely forecast future results. Though valuable, predictable these snaps are not.
|
Power Rushing min 17 att 2021 rank (15) 2020 rank (26) |
Success Rate |
Y/R |
First Down+ TD Rate |
Broken Tackle Rate |
EXR Rate (10+) |
Gumption Rate |
Negative Rate |
YBC AVR |
YAC AVR |
USAGE |
|
T. Bigsby |
43.3% (11/17) |
4.77 (8/13) |
23.3% (9/18) |
20.0% (t-12/16) |
6.67% (12/21) |
3.33% (10/16) |
0.0% (t-1/1) |
2.10 (8/15) |
2.67 (7/9) |
21.4% |
Despite starting the season with the 2’s and injury limiting late season reps Bigsby finished as the SEC’s 9th-most featured ball carrier. Captain Obvious wanted me to relay to you that the odds are fairly high that he’ll command the conference’s top market share in 2021. With Mike Bobo now in charge of the offense, Auburn’s run game stands to undergo some facelifts. Up-tempo pace and space with ample read options, bubble screens and the occasional tackle counter will no longer be the core of this attack. Heck, my money is on the Tigers even getting a little funky with the anti-spread and pro-style favorite I-formation. I bring this up because Bigsby was an underwhelming rusher on power schemes. In fact, amongst qualifiers he sits inside the SEC’s bottom4 ahead of this fall in such Success Rate, Y/C, First Down+TD Rate, Broken Tackle Rate, YAC average, and Explosive Run Rate. For what it’s worth, no SEC offense allowed power looks to command a higher play share than Bobo’s South Carolina squad.
|
Zone Rushing min 30 att 2021 rank (25) 2020 rank (36) |
Success Rate |
Y/R |
First Down+ TD Rate |
Broken Tackle Rate |
EXR Rate (10+) |
Gumption Rate |
Negative Rate |
YBC AVR |
YAC AVR |
USAGE |
|
T. Bigsby |
56.3% (4/7) |
6.55 (2/2) |
42.7% (2/2) |
48.5% (1/1) |
20.4% (2/4) |
7.77% (2/2) |
8.74% (19/24) |
2.78 (6/10) |
3.78 (2/2) |
74.6% |
That said, zones should still have a big role. Balance between schemes was a major emphasis for Gamecocks. Only a few points separated that offense’s zone and power makeups last year. Honestly, that’s good news for Bigsby. Because as crappy as he was on gap designs, he was just as exemplary on zones. Looking at his table, he essentially dons the conference’s silver medal across the board. The new scheme and mentality will have an effect on his result-based numbers like Success Rate and Explosive Run Rate. So while there’s hope those improve for the better, his rock solid stable metrics like his Broken Tackle Rate and YAC average provide much more solace and confidence he’ll build upon his eye-catching rookie season.
1. Chris Rodriguez
|
Overall Rushing min 50 att 2020 Rank (30) |
Success Rate |
Y/R |
First Down +TD Rate |
Broken Tackle Rate |
EXR Rate (10+) |
Gumption Rate |
Negative Rate |
YBC AVR |
YAC AVR |
PPA/ play |
|
C. Rodriguez |
65.6% (1st) |
6.59 (1st) |
42.0% (1st) |
32.8% (6th) |
13.5% (16th) |
3.36% (21st) |
2.52% (1st) |
2.39 (17th) |
4.20 (1st) |
0.31 (1st) |
Chris Rodriguez is the SEC’s best running back. I’ll say it again for those of you who are trying to drown out this proclamation: Chris Rodriguez is the SEC’s best running back. As tantalizing as it is to take the young buck on the Plains, C-Rod’s overall numbers cannot be challenged by any returning SECer largely because he stood head and shoulders over the rest of the pack last fall. While logging the conference’s best Success Rate, First Down+TD Rate, yards after contact average, and Predictive Points/play, Pro Football Focus has him as the top graded returning rusher in all of college football (Well, among guys that didn't opt-out in 2020). Naturally with all these honors, PFF.com thought it wise to rank the Wildcat as the 8th-best back ahead of this season. (Yes, that was a dig at their contradictory content) But even if you think advanced stats are too “out there” or hard to grasp, Rodriguez came through for the old-timers securing the conference’s best Yards/Carry in 2020. While given the nickname “Baby Benny” thanks to a similar playing style to former UK ball carrier Benny Snell, it’s time to morph that moniker to “Better Benny”. Despite Snell’s voluminous numbers, he lacked efficiency, which sure as hell hasn’t been Rodriguez’s problem since receiving significant touches.
|
1st Down Efficiency min 20 att 2021 rank (26) 2020 rank (39) |
Success Rate |
Y/R |
First Down +TD Rate |
Broken Tackle Rate |
EXR Rate (10+) |
Gumption Rate |
Negative Rate |
YBC AVR |
YAC AVR |
USAGE |
|
C. Rodriguez |
68.0% (1/1) |
7.86 (2/2) |
28.0% (3/3) |
40.0% (6/7) |
20.0% (t-5/8) |
0.0% (t-21/30) |
2.0% (4/4) |
2.96 (7/11) |
4.90 (1/1) |
42.0% |
It’s been no secret the Cats have been the conference’s most run-heavy offense the last few years. Though a number of offenses are starting to take to the skies more often to start a set of downs, UK scoffed at that trend and clung to its dependable ground game. Looking at Rodriguez’s production in these spots, that approach was rather sound. Like his overall clips, his Success Rate and Yards/Carry looked down on the rest of the conference. Plus, he was often his best self busting out of tackles and generating breakaways in these spots. But as an overly bruising runner, UK opted to utilize him as a short yardage specialist. No qualifying running back saw a lower percentage of his carries occur on first downs besides Rodriguez.
|
Red Zone Rushing min 12, 7 att 2021 rank (16) 2020 rank (25) |
1D+TD Rate |
Y/R |
Broken Tackle Rate |
YBC AVR |
YAC AVR |
Goal to Go TD Rate |
Goal to Go YBC AVR |
Goal to Go YAC AVR |
Goal to Go Broken Tackle Rate |
RZ USAGE |
|
C. Rodriguez |
38.7% (8/12) |
2.77 (11/19) |
25.8% (8/14) |
0.90 (13/22) |
1.87 (10/15) |
46.7% (3/6) |
0.80 (6/12) |
0.93 (8/15) |
6.67% (9/17) |
26.1% |
|
3rd Down Efficiency min 12 att, 2021 rank (9) 2020 rank (16) |
Success Rate |
Y/R |
AVR to Gain |
Broken Tackle Rate |
EXR Rate (10+) |
Gumption Rate |
Negative Rate |
YBC AVR |
YAC AVR |
USAGE |
|
C. Rodriguez |
78.9% (2/2) |
4.84 (4/5) |
1.58 (9/16) |
5.26% (8/14) |
10.5% (6/7) |
0.0% (t-8/12) |
5.26% (t-6/6) |
3.21 (3/3) |
1.63 (9/14) |
15.9% |
|
Short Yard Efficiency min 12 att, 2021 rank (14) 2020 rank (21) |
Success Rate |
Y/R |
Broken Tackle Rate |
EXR Rate (10+) |
Gumption Rate |
Negative% |
YBC AVR |
YAC AVR |
USAGE |
|
C. Rodriguez |
82.8% (2/2) |
4.79 (4/6) |
17.2% (11/17) |
10.3% (6/11) |
0.0% (t-11/18) |
6.90% (6/8) |
2.72 (3/4) |
2.07 (10/14) |
24.4% |
Inversely, his 24.4% clip in situations with three yards or less to gain was a conference-high. With plenty of phone booth runs, his yards before contact average skewed downward and finished below the conference average. In fact the last two years, his overall Yards Before Contact Makeup placed as the SEC’s 5th-lowest out of 30-plus qualifying ball carriers. Considering his YAC average led the league back-to-back years, Rodriguez has managed his workload quite well. But despite his hard running style and knack for moving the chains, he was disappointed in separating himself from his scheme on short yard, 3rd Down, or Red Zone carries. Situational success often followed, but neither of his Broken Tackle Rate, YAC average, or Gumption Rate in these spots were desirable.
|
Behind the Chains min 12 att, 2021 rank (16) 2020 rank (28) |
Success Rate |
Y/R |
First Down+TD Rate |
Broken Tackle Rate |
EXR Rate (10+) |
Gumption Rate |
Negative Rate |
YBC AVR |
YAC AVR |
USAGE |
|
C. Rodriguez |
41.7% (5/6) |
8.75 (1/2) |
16.7% (t-11/19) |
50.0% (2/2) |
12.5% (13/20) |
12.5% (t-2/2) |
0.0% (t-1/1) |
1.58 (14/26) |
6.71 (1/1) |
20.2% |
At least, Rodriguez donned efficient numbers behind the chains. Though a couple of long carries inflated his league-best Y/C in these spots, his Broken Tackle Rate and Gumption Rate held the conference’s silver medal last year. Plus, his Success Rate is the 5th-best ahead of this fall. Yet, his usually amazing First Down+TD Rate took a hit and fell into the bottom-6. Despite his ability to get his offense back on track, his ho-hum showings in short yardage, on 3rd Down, and in the red zone hurt his Wins Above Replacement standing. But to reiterate, while these situations are prime spots to display value, they aren’t sturdy prognosticators for future performances thanks to the copious variables involved. For what it’s worth, CRod stood out with his stable metrics in most of these situations last year. And to reiterate, his overall numbers are more than fine entering 2021. Based on his two-year track record, there’s no reason to believe can’t step it back up. Still, this apparent shortcoming opens the door for another SECer to challenge his crown.
|
Zone Rushing min 30 att 2021 rank (25) 2020 rank (36) |
Success Rate |
Y/R |
First Down+TD Rate |
Broken Tackle Rate |
EXR Rate (10+) |
Gumption Rate |
Negative Rate |
YBC AVR |
YAC AVR |
USAGE |
|
C. Rodriguez |
66.3% (1/1) |
6.68 (1/1) |
44.9% (1/1) |
29.6% (9/11) |
12.2% (16/22) |
2.04% (20/30) |
2.04% (2/2) |
2.50 (8/13) |
4.18 (1/1) |
82.4% |
Rodriguez should be due for his highest usage of his career. Outside of Alabama’s Brian Robinson, no one in this piece accounted for a lower market share of his team’s designed carries than CRod’s 30.5% clip. Regardless of the concept, 82.4% of Rodriguez’s carries were categorized as zones. That concentration paired with his efficiency overly fueled his top-tier figures. Zones should remain a big part of what the Cats do with the ball, but new play caller and ex-LA Rams staffer Liam Coen is believed to lean heavily into Sean McVay’s offense, which will trade in UK’s bread and butter Inside Zone Reads for Outside Zone Off-Tackles as its base concept. Like you might expect from the dude who logged the conference’s highest Zone Makeup, Rodriguez’s 16.8% Power Makeup was an SEC-low. Despite the narrow approach with his carries, CRod shouldn’t be pigeon-holed as a zone-only rusher. As you can see, he was just as effective executing power schemes with no one topping his Success Rate, Yards/Carry, YAC average, or Broken Tackle Rate.
|
Power Rushing min 17 att 2021 rank (15) 2020 rank (26) |
Success Rate |
Y/R |
First Down+TD Rate |
Broken Tackle Rate |
EXR Rate (10+) |
Gumption Rate |
Negative Rate |
YBC AVR |
YAC AVR |
USAGE |
|
C. Rodriguez |
65.0% (1/1) |
6.35 (2/3) |
30.0% (7/11) |
45.0% (1/1) |
20.0% (3/t-4) |
5.00% (6/t-9) |
5.0% (5/t-10) |
2.15 (7/14) |
4.20 (1/2) |
16.8% |
Overall, Rodriguez was only hit seven times in the backfield last year and owned the SEC’s lowest Negative Run Rate in the process. But while his Gumption Rate was dismissible, four of these runs turned into a positive gain through the Wildcat's efforts. Only Brian Robinson and Damion Pierce rocked better conversion clips amongst qualifiers. Though he failed to replicate his league-leading 42% Broken Tackle Rate from SEC play in 2019, his clip from this past season was more than healthy. Rodriguez isn’t entirely flashy, but he is without a doubt dependable and consistent. Thanks to his proven ability to fall forward, slip through mitts, excel off numerous looks, and capture conversions, he’s my RB1 ahead of 2021.
Where the qualifiers stand overall ahead of 2021
|
Overall Rushing min 50 att 2020 Rank (30) |
Success Rate |
Y/R |
First Down+ TD Rate |
Broken Tackle Rate |
EXR Rate (10+) |
Gumption Rate |
Negative Rate |
YBC AVR |
YAC AVR |
PPA/play |
|
C. Rodriguez |
65.6% (1st) |
6.59 (1st) |
42.0% (1st) |
32.8% (6th) |
13.5% (16th) |
3.36% (21st) |
2.52% (1st) |
2.39 (17th) |
4.20 (1st) |
0.31 (1st) |
|
B. Robinson |
58.2% (2nd) |
5.31 (9th) |
39.6% (2nd) |
31.9% (9th) |
15.4% (12th) |
8.79% (2nd) |
4.40% (5th) |
1.49 (28th) |
3.81 (2nd) |
0.14 (17th) |
|
Z. White |
54.9% (3rd) |
5.41 (7th) |
34.7% (4th) |
22.2% (23rd) |
12.5% (19th) |
6.25% (7th) |
6.25% (10th) |
2.83 (4th) |
2.58 (17th) |
0.23 (6th) |
|
T. Davis-Price |
52.9% (7th) |
4.31 (26th) |
25.9% (22nd) |
25.9% (17th) |
6.73% (30th) |
3.85% (19th) |
4.81% (6th) |
1.71 (26th) |
2.63 (15th) |
-0.1 (12th) |
|
T. Bigsby |
52.2% (8th) |
6.04 (4th) |
36.9% (3rd) |
42.0% (1st) |
16.7% (7th) |
7.97% (3rd) |
6.52% (11th) |
2.53 (12th) |
3.51 (4th) |
0.20 (9th) |
|
I. Spiller |
51.3% (9th) |
5.59 (6th) |
31.6% (11th) |
30.5% (12th) |
17.1% (6th) |
5.35% (9th) |
9.09% (19th) |
2.60 (8th) |
2.98 (7th) |
0.24 (5th) |
|
D. Pierce |
50.9% (10th) |
4.73 (16th) |
26.4% (20th) |
31.1% (10th) |
8.49% (27th) |
7.55% (6th) |
3.77% (3rd) |
1.93 (23rd) |
2.79 (12th) |
0.13 (13th) |
|
J. Ealy |
49.9% (13th) |
5.07 (11th) |
32.7% (9th) |
31.9% (8th) |
18.4% (4th) |
4.08% (18th) |
10.9% (24th) |
2.39 (18th) |
2.68 (13th) |
0.21 (8th) |
|
T. Smith |
47.8% (15th) |
5.30 (10th) |
26.1% (21st) |
21.6% (24th) |
13.4% (17th) |
4.48% (14th) |
5.97% (9th) |
3.17 (3rd) |
2.13 (24th) |
0.20 (12th) |
|
K. Harris |
44.3% (21st) |
6.15 (3rd) |
31.9% (10th) |
25.4% (18th) |
16.2% (9th) |
4.32% (16th) |
11.4% (25th) |
3.35 (2nd) |
2.80 (11th) |
0.30 (2nd) |
|
2020 SEC AVR |
48.5% |
5.12 |
29.9% |
27.4% |
14.0% |
4.73% |
7.89% |
2.44 |
2.68 |
** |