2020 Offensive Play Calling: Arkansas
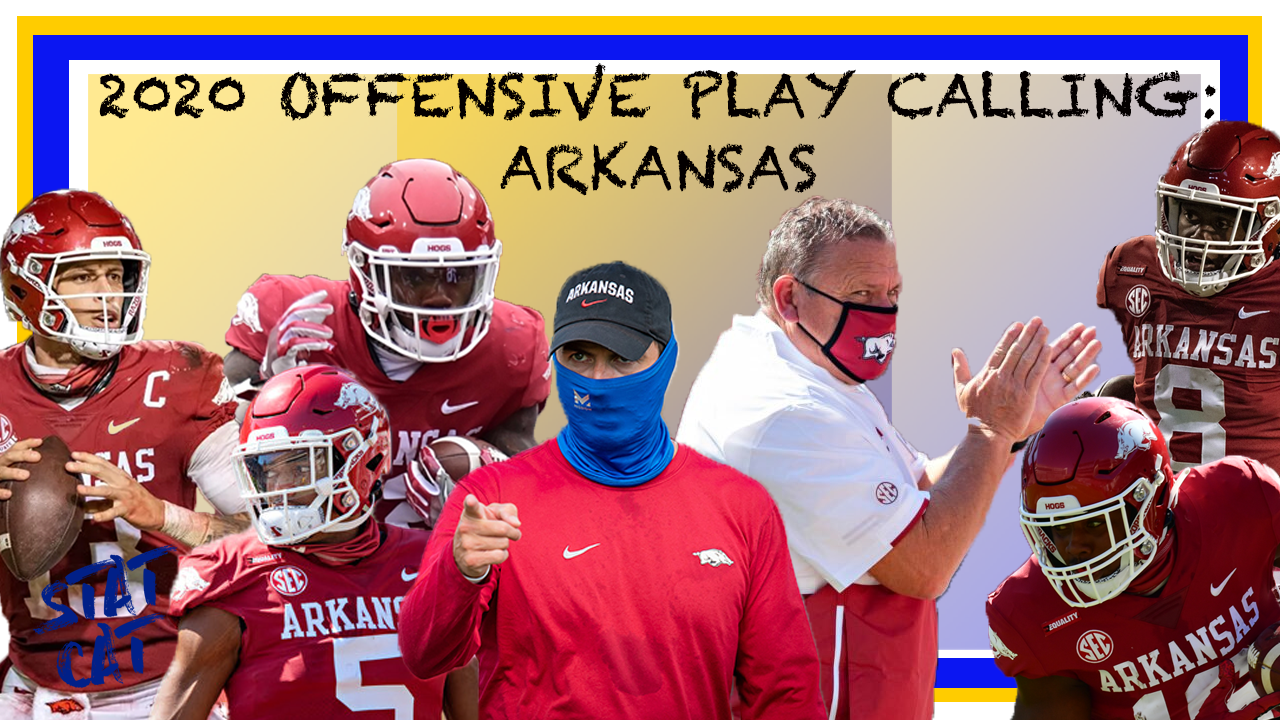
2020 Offensive Play Calling: Arkansas
Though the Hogs had a nice run at the start of the decade, it could be said success was not in Ar-Kansas anymore, Toto. As horrible as a lede as that was, recent falls in Fayetteville proved to be even more appalling for Razorbackers than that crappy pun. After pursuing one side of the spectrum that called for copious tight ends and a physical run game, Arkansas followed up that effort with Chad Morris and his spread principles preaching the exact opposite approach. Of course with that stark change in philosophy, this job would have been a hard gig for any coach to turnaround in the short term. Despite holding onto a few positives, things quickly went south, and it all came crumbling down in humbling fashion.
Enter Sam Pittman, the position coach lifer. His hire was hardly met with significant fanfare, but the grizzled vet sported his wisdom in bringing on two of the nation’s top play callers to guide the Razorbacks on both sides of the ball. And while only Vanderbilt entered 2020 with less expectations within the conference, Pittman and his crew quickly showed they were up to the task of this daunting rebuild. Even with an atypical offseason, the energy he and his staff injected into the program was palpable. The offense planned to be full of juice, and the defense strove to force opponents to make the squeeze.
While most are quick to dismiss their 3-7 record, the Razorback’s strung together multiple conference victories for the first time since 2016. Barry Odom’s squad jumped off the conference floor in terms of Defensive Success Rate, Yards/Play, rush yards before contact, and TD Rate allowed to middle of the pack. With more movement and eye candy, Kendal Briles style begat a ten percentage point increase in Offensive Success Rate along with general gains in Explosive Play Rate, 3-and-Out Rate, and Turnover Rate. Though the team’s Broken Play Rate remained in the double-digits for honor of the SEC's worst, the Hogs’ TD Rate improved over 63% and just missed finishing inside the conference’s top5.
To get a better idea of how this offense aimed to operate, I looked at snaps when Arkansas was either up or down 18 points. That way, less garbage time snaps skewed the output and gave us a better depiction of their true play calling in the heat of battle. Though there was considerable year-over-year improvement, it wasn’t like the Hogs completely erased displays of bad football. With that parameter applied, I examined this offense’s favorite run and pass plays, the looks that gained the most yards, and Arkansas’ most successful concepts from 2020.
MOST FEATURED RUN CONCEPTS
1. Inside Zone Slam Read: 6.59% Play Share, 3.82 Y/A, 50.0% Success Rate
Since the Razorbacks entered each weekend with a talent deficiency relative to their conference opponents, the newly-installed offensive braintrust opted to keep defenses off-balanced with a bevy of looks. Four different run concepts logged between 30 and 38 reps in meaningful minutes. Other than Florida — whose run game was maddeningly inconsistent — and Alabama — whose run game was resoundingly dominant — Arkansas was the only SEC offense to dedicate less than a tenth of its calls towards its top rushing concept. In the end, the Inside Zone Slam Read finished as the Hogs’ most-repped play in our sample. Despite that honor, the Slam Read’s usage tended to be matchup-reliant. Less than eight were logged the first month of the season while half of the concept’s overall tries on the season occurred during the three-game stretch between Ole Miss, TAMU, and Tennessee. And while every other SEC offense’s favorite play earned the top play share to start a set of downs, that was far from the case for Arkansas’ Slam Read. Hell, it didn’t even finish as a top3 look in that regard when applying our point parameter. While its output was rather ho-hum on firsts (and even thirds), second down produced a 64.7% Success Rate and 4.3 Y/A, which clearly buoyed the concept’s overall numbers. For what it’s worth, the plurality of the look’s attempts were logged on seconds in our sample and only Meshes received more tries on the money down.
Though this offense had plenty of fun wrinkles, the Slam Read was generally the most boring part of Kendal Briles’ scheme. Ordinarily a low-floor, versatile design that allows easy inclusion for route tags and mechanisms to tip the numbers in the offense’s favor, this play was overly a plug and chug design to help the Hogs manage their down and distance situations. Maybe that’s apparent per its 50% Success Rate, but only 6% of its carries went for more than ten yards. For the most part, the Slam Read was straightforward and no-nonsense. Even though Arkansas used at-the-snap motion on about a quarter of its 2020 snaps (compared to 18% in Chad Morris’ last stand), our concept in question only logged two such reps all season long. But, that was kind of the point. Arkansas forced defenses to respect this play, which typically lead to interesting counters and eye candy once foes were suckered in. For whatever reason, the Hogs were much better executing this look on straight read attempts rather than RPOs. On handoffs when route tags were present, the Slam Read’s Success Rate plummeted to 36.8%. Plus, all three of the concept’s explosive carries were on straight reads.
2. Counter + Read: 6.06% Play Share, 5.71 Y/A, 42.9% Success Rate
With a basic Inside Zone Read at the forefront, Counters didn’t finish too far behind on Arkansas’ script. This is consistent with how the previous staff did things. In 2019, read and straight-up Counters accounted for nearly 7% of this offense’s plays and also finished as the Robin to the Slam Read’s Batman. Chadman aside, deception and misdirection were important cogs to Briles’ scheme. Since the Razorbacks couldn’t really play bully ball or sling it all over the yard, Arkansas predominately had to manufacture small victories for itself, which meant it often had to set foes up before knocking them down. To reiterate, the Slam Read mostly acted as bait to accentuate other elements of this attack and allow the Hogs to play complimentary football. That philosophy is nothing new, but sometimes it can be overlooked by the laymen and casual fans. Though Counters weren’t the only method of misdirection, they are natural compliments to zones due to how the designs breakdown.
Unlike gap schemes that call for divergence across the line, zone runs are much more coordinated and cookie cutter up front. With that, they are pretty easy for defenses to diagnose and hence stop. When opponents get itchy playside, they reveal vulnerabilities on the backside. The initial down blocks on Counters read like normal zone flows. But once the defense over-pursues, the weakside lineman seal them inside while a pair of pullers sets our new hard-nosed hole. Though there are a few renditions of Counter, Arkansas primarily used the guard-tight end variety. Since this form of Counter pulls a tight end as a lead blocker, it naturally has to work towards the weakside of the formation. That is unless you get cheeky. To prevent opponents from getting too comfortable against the same look, Briles occasionally toyed with this design’s orientation with “Bluff Counters”. After first feigning a split zone action away, the tight end would swivel back towards the playside and follow the edge-setting backside guard before operating normally as a lead blocker.
Across the 51 combined Inside Powers and Inside Power Reads in our sample, 35 — or over two-thirds — of them were the guard-tight end form of Counter. Meant to mimic the Slam Read, Counters’ usage was often tied to the hip of Arkansas’ lead look. In the three-game span where the Hogs’ main zone logged half of its yearly tries, our concept in question repped 20 of its 47 attempts. It only received more plays than the Slam Read in three games, two of which occurred the final month of the season. Counters donned their best returns on second down, which is also the spot that saw its highest usage; just like the Slam Read. All in all, the Hogs at least managed to produce more splash gains off this misdirection in comparison even if a 12.6% Explosive Run Rate is rather mediocre.
3. Outside Zone Read: 5.76% Play Share, 4.03 Y/A, 34.4% Success Rate
With four of its five favorite run looks being concepts designed to win between the bookends, the Outside Zone Read had a nice role in this offense as Arkansas’ preferred approach to test run defense on the perimeter. Unlike Inside Zones that need some form of blocking on the defense’s second level, Off-Tackles are overly concerned with reaching immediate threats rather than blowing them backwards, which results in the line taking a much flatter path in comparison. This coordination also presents a more clear-cut read defender on the backside. And thanks to the horizontal blocking away, these players typically are more susceptible to being caught flat-footed on QB keeps. For what it’s worth, Feleipe Franks accounted for over a fifth of this concept’s attempts while boasting a team-high 5.4 Y/A, 3.6 rush yards before contact average, and 50% First Down+TD Rate. No other Razorback with multiple Outside Zone Read attempts managed to see at least half of their reps work situationally.
Much of this play’s lousy metrics was the result of the Razorbacks failing to win at the point of attack. Though Trelon Smith’s 35.3% Success Rate played a role, Rakeem Boyd shouldered much of the Outside Zone Read’s inefficiency. On his ten such tries, he gained a grand total of ten yards while sporting a negative rush yards before contact average and logging the team’s only such fumble. If we were to omit Boyd’s carries, the look’s Y/A would tick up to 5.14 and its Success Rate to 41.4%. Though wishy washy, almost a fifth of this concept’s carries resulted in a gain of at least ten yards. Interestingly enough, all of them occurred in the outside left quadrant despite both sides of center virtually seeing equal tries. All in all, Arkansas was much more effective on leftwards carries regardless who was the rusher per its 5.95 Y/A and 47.4% Success Rate. Even though over a quarter of these attempts faced contact behind the line of scrimmage, the exact same figure represented this look’s such Explosive Run Rate on leftward runs.
Like the rest of the run game, usage was often matchup dependent rather than dogmatic. Half of its reps occurred in the games versus Mississippi State, Auburn, and Tennessee. But, the Outside Zone was this offense’s favorite run play to incorporate Orbit Motion. Of the nine reps (19.1% play share) to use at-the-snap motion, eight used a form of Orbit, which was a great source for swing screen RPOs. Other than that, slant+flat combos were very common route tags. The Outside Zone Read operated as an RPO on 25/32 snaps in our sample. Though an occasional source for an explosive carry, Arkansas’s Success Rate dipped to 32% on such RPO attempts.
4. Inside Zone Bluff Read: 5.20% Play Share, 4.90 Y/A, 46.7% Success Rate
Unlike the Slam Read that asks all blockers to coordinate on our playside zone flow, the Bluff Read is designed to have some divergence since its a split zone design. Rather than working with the OLine on their zone combos, a playside off-set TE or fullback fires against the grain to set a hard edge on the backside. This accomplishes two things. First, it creates a natural cutback lane just in case our orchestrated zone flow is stuffed. Second, it toys with defenders for a beat while they attempt to diagnose the play. Since the action somewhat resembles a Counter, opponents in the box have to think quickly on what technique to utilize in order to thwart the design. If their eyes stay backside towards the “trapper”, the play side zone usually has no trouble reaching and sealing defenders as planned.
Though Arkansas’ straight zone action lacked frills, this offense’s split zone designs were full of color even if its returns failed to pop. Over the course of the season, nearly 42% of the Bluff Read’s reps utilized a form of Jet motion. Though most used conventional methodology of asking a receiver to run full speed across the formation to either tip the defense’s rotation, act as eye candy, or function as a quick outlet, Arkansas was one of the few SEC offense to utilize “inertia motion” with its tight ends. Rather than just motioning one back in from out wide and re-settling in the box, a tight end continues gathering momentum before morphing his Jet path into his split zone flow.
A good portion of the Bluff Read’s usage came during the first four games of the season, but four of its five explosive carries occurred between the TAMU and Missouri matchups from games 5 and 9. LSU’s defense was the only one in that span that didn’t allow our concept to log a ten-plus yard attempt. Though a 13.1% Explosive Run Rate is serviceable, that figure still leaves plenty to be desired. Like its brother concept, the large majority of the Bluff Read’s tries occurred on early downs. In fact, both of Arkansas’ Inside Zone Reads each logged the same number of tries in those spots in our parameter. But since this staff seemingly trusted the Slam Read more in crunch spots, it finished as this offense’s favorite. Oddly enough like most of the Razorbacks’ go-to ground looks, the Bluff Read found its most success on second downs where it rocked a 50% Success Rate.
5. Y-Insert: 3.60% Play Share, 4.65 Y/A, 50.0% Success Rate
To recap, Arkansas used its tight ends to work the edge on its straight Inside and Outside Zone Reads, as a trapper/edge setter on its split zones, and as a puller on its primary Counter design. So to round out that position group’s blocking profile, Arkansas asked them to perform as lead blockers between the bookends. Since most of the Razorbacks’ rushing attack was anchored on zones, this gap design presented Arkansas another weapon with which to bash box defenders. With that in addition to allowing offenses to maintain spread principles, Y-Insert is gaining popularity across the conference. Think of this play as the new-age way to run the old slobber knocker Iso. But instead of coming from the I-Formation, it can come from most base or trey sets. None have helped the look gain notoriety more than LSU’s juggernaut from 2019 that saw this look sport a 11.1 Y/A and 75% Success Rate. Thanks to the Tigers yearning to recapture that magic, they were the only SEC offense to out-rep Arkansas on this look. Though the Hogs obviously failed to execute the Y-Insert at that elite level, this concept was another low-floor play that helped this offense snatch bite-sized chunks of yards and win marginally. And again, it complimented Arkansas’ other tight end actions quite nicely much to the chagrin of second and third level defenders. Even though only three Y-Insert attempts resulted in explosive carries, play fakes off this design further provided this offense value.
All but two of this concept’s reps in meaningful minutes were off RPO designs. In that facet, only the Outside Zone Read and Slam Read logged more chances. Though a couple of reps showed up on later downs -- RPO or no -- Y-Insert distributed most of its tries equally across first and second downs with nine attempts a piece in our sample. But while the Hogs’ other rush looks typically posted their most preferable figures on seconds, this play proved to be its best self to start a set of downs with a laudable 77.8% Success Rate. Staying true with his run game philosophy of keeping opponents on their toes, Briles hardly overcommitted when it came to this look. Including RPO throws, play actions, and logged rush attempts, this concept was only featured eight times in a single game once this season. Four games logged one attempt or less with the majority of the concept’s snaps occurring against Auburn, Tennessee, and Florida. That trio of games were the only instances where Y-Insert received four or more reps.
MOST FEATURED PASS CONCEPTS
1. Slant Variations: 9.01% Play Share, 5.27 Y/A, 46.2% Success Rate
Curbing the pass rush has been an issue for Arkansas’ offense the last three seasons. Last year in SEC play, the Razorbacks sported the conference’s 3rd-worst Pressure Rate; and things hardly improved on that front in Pittman's first year at the helm. Since there was a good chance the dudes upfront would fail to mold pristine pockets, Kendal Briles opted to lean heavily into the quick game. Knowing the heat was coming, Slant Variations allowed the Hogs to play hot potato. Since slants are quick, underneath routes, they only need a beat to develop. Both the reads and potential throws are relatively easy, which allowed for the inclusion of tempo with its execution. Plus with Feleipe Franks’ strong accuracy and Arkansas’ receivers collective route running, there was no reason to overthink why this concept group was the most important cog in the Razorbacks’ passing game. Outside of being this offense’s most featured look, slants were outright targeted 37 times over the course of 2020 -- 15 more than the next route in line. In our sample, Slant Variations almost doubled this offense’s beta aerial look in reps. Heck if you were to break out the four subconcepts I chart (Solo Slant, Tosser, slant+flat, and slant+curl), only isolated slants would fail to finish among Arkansas’ favorite passes.
No SEC team was as balanced as Arkansas to start a set of downs. In our sample, their First Down Pass Rate was exactly 50%. Though the offensive braintrust did a fantastic job of keeping opponents guessing on what would come on the ground, Slants were overwhelmingly the Hogs’ top pass to target on early downs. These variations logged a double-digit gap between them and the next look in line on both first and second downs. Nearly half of the groups’ tries occurred on the latter, but Slant Variations undoubtedly stunk in those spots. Outside of slant+curl patterns, no subconcept experienced at least a 33.3% Success Rate on first down. The group’s collective clip was a mere 37.5%. Though its usage dwindled on each subsequent down, the group’s Success Rate improved to 50% and 57.1% on second and third down, respectively. Naturally with the amount of read options the Razorbacks featured, over half of Franks’ attempts off of this concept group were categorized as an RPO; another quarter or so deployed the concept in the dropback game with play action.
2. RPO Flat/Slide: 4.68% Play Share, 4.89 Y/A, 55.6% Success Rate
With the majority of Arkansas’ run game built around deception and unpredictability, this offense’s favorite RPO outlets accentuated Briles belief in toying with box defenders. In addition to having his tight ends work the edge on zone reads, seal the backside on split zones, and lead block towards the weakside, strongside, and up-the-middle on gap schemes, Briles kicked it up a notch with Flat/Slide outlets. Whether from static alignments or on attempts with at-the-snap motion, these quick completions created conflict perfectly when coupled with Arkansas’ favorite ground look. Thanks to the balance Briles bestowed both of the Razorbacks’ core Inside Zone Read, these outlets were all the more effective. Rather than firing against the grain as is custom on split zones, tight ends instead would just simply run a little route to the perimeter.
Since these often worked away from the run flow and attempted to isolate a flank defender, Flat/Slide outlets typically found themselves open. These read men were overwhelmingly caught out position, which fueled the admirable Success Rate above. Among the pair’s combined 36 snaps this season, these routes were targeted 29 times. Excluding the three broken reps in our sample, only one fell incomplete, which happened to be a drop. Thanks to the consistent catches and the clever designs, half of its completions resulted in a fresh set of downs despite all of these targets being at or behind the line of scrimmage.
This element was a fairly unique characteristic to Arkansas’ scheme. No SEC offense targeted these outlets more than 13 times all year. The Hogs, of course, more than doubled that in our sample alone. Though some tries occurred outside this context, flats and slides finished as this offense’s 2nd and 3rd-most targeted route in 2020. All in all, RPO Flat/Slide outlets logged at least two attempts in every game this season, but none saw more than four. The most productive outing occurred against TAMU. All four of the Flat/Slides resulted in a first down, and De’Vion Warren logged their lone explosive gain.
3. Rub Variations: 2.95% Play Share, 6.29 Y/A, 35.3% Success Rate
Since a good portion of Arkansas’ passing offense aimed to work short, defenses often crowded the box or played sticky man coverage to clog up throwing lanes. As a counter, Briles used Rubs to orchestrate some separation for his receivers. Despite his well intentions, the Hogs failed to execute these looks consistently. All in all, this offense featured four Rub renditions: Mesh, Pick Screen, RB Wheel Rub, and slant+wheel/fade. Most team’s go-to variant is Mesh, and Arkansas was hardly an exception to that trend. Of the 17 Rubs in our sample, 11 were a form of that look. The only subconcept that delivered value, however, was the slant+wheel/fade combo “Pickaxe”. Though the rest of the group obliged to work underneath, that pattern’s vertical element birthed three completions beyond ten yards downfield with two resulting in an explosive gain as well as Rub’s two scores.
Thanks to Arkansas riding Mesh as a trendy later down play, Rubs experienced their highest usage on thirds. But, only two of the 11 such chances resulted in a conversion. Even when excluding broken snaps, this offense struggled to generate completions off of this group. Arkansas passers went a combined 5/13, but only a couple of targets were deemed uncatchable. This offense was just as likely to log a drop as a first down+TD on Rubs. Though he wasn’t one of the trio of Razorbacks who saw three Rub targets, De’Vion Warren finished as this group’s most productive receiver thanks to his lone attempt resulting in both an explosive gain and a tuddy.
4. True Screens: 3.12% Play Share, 1.72 Y/A, 22.2% Success Rate
To occasionally help with its line to deal with pass rushes, this offense turned to True Screens as avenues to attempt to get the ball to a playmaker in space, which tended to be a running back. Arkansas targeted five different variations: RB Slip Screen, Swing Screen, Tunnel, Bubble, and Convoy/Jailbreak Screen. The latter three only received one try a piece. Slip screens accounted for over half of the concept group’s reps and was its main driver. Of the four successful Screens in meaningful minutes, three were this variety. Maybe that low volume of successful reps gave it away. But, this offense was not close to being a good Screen team. No conference offense averaged less per attempt, and only South Carolina and UK posted a less preferable Success Rate.
Though True Screens combined to be one of this offense top6 most-repped looks on third downs, half of this group’s tries occurred to start a set of downs. The rest of the varieties threw up a goose egg, but all three of our successful Slip Screens were seen in these spots. To reiterate, these designs were overly ways to get the ball to Arkansas’ backs. All but one Screen in our sample was directed towards that position group. Rakeem Boyd just edged out Trelon Smith as this group’s go-to with eight targets, six catches, and 17 yards. Along with failing to secure a first down across their 15 combined targets, Arkansas’ backs dropped three chances between them.
5. Sail: 2.60% Play Share, 8.87 Y/A, 53.3% Success Rate
Floods Variations combined to be this offense’s 2nd-most featured concept group in the dropback game. But since Sail made up the majority of its reps, I’m going to focus on that pattern for this section. Though some games featured this strongside Flood more than others, this look logged at least one target in every game in 2020 even if not all of them fell inside our applied parameter. This pattern is all about outnumbering defenders outside the numbers by presenting a three or two-man high-low along the side line. It’s designed to provide an out versus multiple zones, and the deep out-breaker often can win matchups against man coverage. Since the Hogs frequently had to deal with pockets breaking down, Briles and Co. leaned on a “Dash” wrinkle to buy his downfield routes more time to develop. Of the concept’s 20 featured snaps, all but five utilized a delayed rollout. Of course, it didn’t take long for that design to make a splash. Way back in Week 1, Arkansas’ 49-yarder on its second drive helped the Hogs briefly hold a lead against Georgia. Sail only produced a single explosive gain to remainder of the year despite being an okay source for moderate completions.
Two games composed almost half of this Flood’s attempts on the year. In addition to the Georgia game that saw five tries and the aforementioned crown-jewel completion, the Razorbacks featured it a handful of times against TAMU with three receiving out-right targets. (The two others targeted a backside cross and attempted to set up a tight end throwback screen behind the Dash). All in all, Trelon Burks was this look’s most productive target. Along with being on the receiving end of that 49-yard score in Week 1, he racked up 65 yards on his four other Sail catches across the season. No one else managed to crack two such catches or 13 such yards.
TOP YARDAGE GAINERS
1. Slant Variations: 274 yards, 5.27 Y/A, 46.2% Success Rate
Despite targeting Slant Variations the 2nd-most within the SEC, only Mississippi State sported a worse Y/A than Arkansas. In fact, Slants only generated three catches of at least 20 yards in our sample. With that information, it should be clear this group was hardly a source for explosive gains. Though quick patterns, Arkansas still faced plenty of broken snaps ala seven sacks and seven throwaways. While the Hogs performed adequately on this conservative concept within structure, those 14 snaps soured the bottom line. With those snaps omitted, over two-thirds of these attempts were completed, and Slant Variations’ Success Rate would have shot up to 63%. The group’s most productive outing came against Missouri where three of the four targets found success while accounting for 21% of its output in our sample. Treylon Burks and Mike Woods each received 13 such targets and finished with at least 95 such yards. No other Razorback finished with more than 3 and 34, respectively. That said, Burks lead the way in Success Rate, catches, yards, and first downs. But, Woods accounted for both of Slant Variations’ scores.
2. Solo Shot: 250 yards, 31.5 Y/A, 71.4% Success Rate
Arkansas was not a vertically-inclined offense. In addition to owning the SEC’s 4th-lowest average depth of target, Feleipe Franks only dedicated about 10% of his attempts beyond 20 yards downfield. But this scheme’s aversion to taking the top off of defenses wasn’t because of some shortcoming involving the former Florida passer. In addition to rocking the conference’s top Depth Adjusted Accuracy (that applied more risk/reward the further an attempt travels downfield), no SEC QB bested Franks’ 64% Deep Accuracy clip. In fact, the next closest passer failed to crack 50% in that regard. With that precision and secondaries often peaking in the backfield, Solo Shots finished as Arkansas’ top yardage gainer despite logging only seven attempts in our sample. Though manufacturing a one:one homerun ball isn’t overly complicated, there’s nuance into moving third-level defenders out of the way with only a single receiver working deep. Almost all Solos used action off of Insert or Bluff design. Rocking those tactics, 63% of this concept’s yearly yards came off of five completions in a two-game stint against LSU and Florida.
3. Counter + Read: 200 yards, 5.71 Y/A, 42.9% Success Rate
With considerable volume and a handful of big gainers, straight up and read options off the guard-tight end Counter resulted as Arkansas’ most fruitful looks on the ground. While the Slam Read was more line-em-up and go, over a fifth of these incorporated a form a at-the-snap motion. Plus, I already hinted Briles and Co. were more keen on preventing defenses from keying on this concept’s orientation. Aided by this active manipulation to box defenders, Counters proved to be a little better delivering significant gains. By volume, they doubled the Slam Read’s number of explosive carries. As you can imagine being an inconsistent run play, those big gainers were crucial in Counters ending among this offense’s three best yardage gainers. In our applied parameters, roughly 42% of these looks’ production came off one 83-yard carry. With that explosive run and a few other tries, the Florida game was responsible for almost half of Counters’ bottom line.
4. Fox: 154 yards, 19.3 Y/A, 75.0% Success Rate
Since most of this scheme’s passes were directed short, defenses schooched closer to the line of scrimmage to hinder those patterns. Much like how Solo Shots and the Rub wrinkle “Pickaxe” found success duping defenses when their eyes drifted towards the box, fake screen design Fox provided Arkansas another methodology to unlock intermediate to deep completions despite its limited tries. About 3% of this offense’s plays were characterized as true screens. And even though receiver designs were shoved way down the call sheet, the Razorbacks targeted these fake screens more than any other SEC offense. Briles and Co. essentially had two renditions. One came from trips and utilized Wheelie Switch action to maximize the vertical element. The other coupled Fox with Y Cross, which is a pretty common pairing across college football. The look’s best outings occurred against Tennessee and Mississippi State. Regardless of the pattern, over half of the concept’s yards were logged versus the Vols with both of its targets against the Bulldogs resulting in points.
5. Inside Zone Slam Read: 143 yards, 3.82 Y/A, 50.0% Success Rate
Thanks to receiving the most attempts than any other concept in our sample, the Slam Read just made it onto this list. Again, this design may have been the foundation for much of Arkansas’ offense, but it predominately delivered muted returns even if half of its attempts worked situationally. Generally speaking, this concept was a complier. All year, only three carries cracked ten yards; none netted more than 15. Sadly, over a quarter of the Slam Read’s yardage was made up by those three explosive carries. Including the Bluff Read, Inside Zone Reads gained less than three yards on half of their carries and sported an Explosive Run Rate under 7% across the season. The top end runs might have been seldom, but Slams and Bluffs did a serviceable job of keeping the Hogs on track. Nearly a third of these tries resulted in a conversion. Every ball carrier on Inside Zone Reads experienced at least a 50% Success Rate with the exception of QB Feleipe Franks. While rocking a poor 33.3% clip, he was the only Razorback to see a single-digit First Down+TD Rate off Inside Zone Reads.
6. Sprint Draw: 142 yards, 8.35 Y/A, 52.9% Success Rate
Though it just missed out on being including among this offense’s favorite run concepts, Arkansas featured the Sprint Draw more than any other SEC team this past season. Unlike ordinary Draw plays that fake a pocket dropback, this variant used an element of eye candy and movement to facilitate its execution. Sometimes with help of a fake toss towards the boundary, Sprint Draw played off of Arkansas’ “Dash” (or delayed rollout) wrinkle. Once the defense was duped into thinking a run/rollout was working away, the ball carrier would swivel back towards the formation and hit inside. Looking at its bottom line, this concept’s usage was justified. No other run with at least eight tries topped this look’s 8.35 Y/A or 52.9% Success Rate. Though other elements of deception had trouble generating cushion, the Razorbacks’ averaged 6.11 rush yards before contact, which no doubt helped Sprint Draw finish with a 31.6% Explosive Run Rate. At the end of the day, Trelon Smith was the team’s most successful and productive rusher on this look. While logging a team-high 12 attempts,100 yards, and 66.7% Success Rate, five of his such runs resulted in either a first down or TD with none going for a loss.
MOST SUCCESSFUL CONCEPTS
1. Fox: 1.44% Play Share, 19.3 Y/A, 75.0% Success Rate
With only eight attempts in meaningful minutes, these fake screen wrinkle just made the cut in order to qualify for this list. Yet, Fox was Arkansas’ best play. Sure, other designs might have averaged more Y/A; but the value this look delivered in its limited reps cannot be matched by any other concept. Three attempts resulted in a TD with three others snatching explosive completions. Five different pass catchers saw a Fox target. Blake Kern and Trelon Burks, however, were the only Razorbacks to field multiple tries. Interestingly enough, both finished with exactly 59 yards. No other receiver managed to total more than 20 in our sample.
2. Vertical Shots: 1.80% Play Share, 30.7 Y/A, 70.0% Success Rate
Again, going deep really wasn’t a major characteristic of this scheme. Shots failed to log a single attempt the first four games of the season. But thanks to elite prudence and precision, this group finished as the most potent looks for Arkansas’ offense. By itself, Solo failed to qualify due to lack of reps. But make no mistake about it, much of Shots’ production as a concept group came off that variant. Lest not forget, no single look gained as many yards, and its own individual Success Rate tops the rest of the group’s collective figure. In our sample, Mike Woods drove much of Shots’ output. In addition to logging the most targets (5), catches (4), and yards (182), Woods accounted for three of the group’s four first downs and one of its two scores.
3. Curl+Slant: 2.43% Play Share, 7.86 Y/A, 64.3% Success Rate
This slant pattern was featured on roughly 3% of Arkansas offensive plays, but barely fielded over a dozen targets in our applied parameter. Including features and attempts, 12 of its 21 snaps occurred during the first month of the season. It was only seen twice the final three games. Even though the combination’s usage waned as 2020 progressed, it was the only Slant Variation that logged over five tries to see half of its reps work situationally. In order to occupy, test, or freeze the linebackers in the vicinity, “Slur” (our shorthand term for this combo) was utilized via RPOs or play action on all but one of its attempts all year. The lone try outside of that threshold came from empty. In the dropback game off play fakes, it was commonly mirrored to both sides of the formation. Though half of these attempts worked, all four of “Slur’s” RPO targets in our sample found success.
4. RPO Flat/Slide: 4.68% Play Share, 4.89 Y/A, 55.6% Success Rate
Since Flat/Slide RPOs were married to Arkansas’ zone game, their usage often mirrored those base concepts. Still, the Hogs managed to distribute these targets fairly well. No down logged more than ten or fewer than eight chances in our sample. Like most of this offense’s concepts, these outlets experienced their worst results on first downs. Only three of its ten chances found success while averaging 2.4 Y/A. But thanks to the deception element applying pressure on linebackers to choose wisely in a timely manner, RPO Flat/Slide’s clips increased on each subsequent down as the average yards to gain diminished. While finishing as Arkansas’ 2nd-most featured look on the money down, 75% moved the chains in those spots. Hudson Henry ended as the team’s most prolific receiver on such attempts with nine targets and catches, five first downs, and 38 yards. But, fellow Y-man Blake Kern was the Hogs’ most efficient. Despite seeing four less targets than Henry, Kern finished with only two less yards and one less first down. For what it’s worth, only one outright target was directed towards an outside receiver.
5. RPO Curl/Hitch: 1.69% Play Share, 4.67 Y/A, 55.6% Success Rate
Along with slants, slide, flats, and bubble screens, Arkansas sprinkled isolated curls and hitches on the backside of its read options. Though far less popular than horizontal routes, these outlets still provided simple completions if the defense bailed to stop the run or surrendered adequate pre-snap cushion on the outside. But come on; I’m not going to pretend it was a magnificent well for sexy gains. After all, these only combined for nine targets in meaningful minutes. Only two of them resulted in a first down. Trelon Burks and Tyson Morris were only pass catchers with multiple targets to catch all their chances. But thanks to no other concept putting up a preferable Success Rate, here it is closing out this piece.