2020 Offensive Play Calling: Auburn
2020 Offensive Play Calling: Auburn
Though he helped bring SEC offenses out of the Stone Age, bring glory to the Plains, and held his own against Nick Saban, Gus Malzahn’s Auburn tenure ran its course after 2020’s underwhelming performance. The once mighty tempo-driven and RPO-laden scheme that captured excitement across college football morphed into a constipated and plodding attack. Sure, the Tigers could still beat up on the lower-level teams they faced, but War Eagle seemingly had plateaued making ground towards the sport’s other elites. The offense that used to own a top billing soon became stuck in the rut that is mediocrity and just could escape. At least, recent defensive showings allowed the Tigers to stay competitive.
As an attempt to reinvigorate his scheme and find someone who could whisper helpful hints to QB Bo Nix, Malzahn called on his old pal and freshly dismissed Arkansas head coach Chad Morris. Since the two share similar philosophies, it was thought to be a nice marriage. To say the least, the move was bold and interesting. Year-over-year in SEC play, the Tigers passed more, used significantly more at-the-snap motion in the read/RPO game, sported a preferable overall Success Rate, increased its reliance on RPOs, delivered more explosive gains per snap, and experienced a modest improvement in average rush yards before contact. No SEC offense sported a better Turnover Rate than its 1.19% clip. That said, Auburn’s TD Rate worsened, its Points/Play was cut in half, and a quarter of the Tigers’ offensive snaps experienced a form a Havoc. With a sixth of its passes and a third of its runs facing a form of those elements on average, Auburn entered the off-season sporting the SEC’s 2nd-worst Broken Play Rate with a 12.6% clip. Despite the moving the needle positively in some areas, War Eagle was less prone scoring points and more likely to display misfires. Obviously, those elements played a huge rule in the university’s braintrust opting to take this program in another direction.
I’m not going to bullet point each week of Malzahn’s slow burn of a final season on the Plains. But, this offense had a difficult time putting itself back together after it was torn apart by Georgia in Week 2. To get a better idea of how this offense aimed to operate, I looked at snaps when Auburn was either up or down 18 points. That way, less garbage time snaps skewed the output and gave us a better depiction of their true play calling in the heat of battle. With that parameter applied, I examined this offense’s favorite run and pass plays, the looks that gained the most yards, and the Tigers’ most successful concepts from 2020.
MOST FEATURED RUN CONCEPTS
1. Inside Zone Slam Read: 20.2% Play Share, 5.59 Y/A, 48.4% Success Rate
Despite bringing in his own personal spin, Chad Morris overly stuck with Auburn’s core Inside Zone attack. Already composing a quarter of this offense’s snaps in Gus Malzahn’s last stint calling plays, Slam and Bluff Reads saw even more reps against conference foes year-over-year. This fall, the latter compiled a play share over 14 percentage points more than the next concept in line. By volume, the Slam Read logged 90 more tries than this offense's beta look. Only Kentucky’s zealous zone scheme dedicated more snaps to the Slam Read than War Eagle. For years, this play hinged Malzahn’s Hurry Up, No Huddle offense. With relative simplicity that enabled the Tigers to play fast, this concept anchored a large portion of Auburn’s RPO game and allowed passers to show off their athleticism with their legs. Like for most offenses, however, the Slam Read hardly is designed to pop off explosive runs at a high clip. Perhaps you’ve heard the coined phrase “death by one-thousand paper cuts.” Though consistent gains of three, four, or five yards don’t seem like much on the surface, the Slam Read helped wear down opposing fronts. When the defense is gassed, confused, or disorganized, the one, small flesh wound could turn into a full-on hemorrhage when fatigue set in.
But as this competitive advantaged started to wane with rule changes that allowed defenses to sub quicker, failing to sign a difference-maker at QB, and the natural evolution of college football’s biggest, strongest, and fastest conference, the Tigers seemingly lost their edge against all but obviously inferior ball clubs. On all Inside Zone’s, Auburn finished in the middle of the pack in Success Rate despite a top5 Y/A within the conference. Trying to add an extra element of stress for the defense and to prevent the scheme from calcifying, Morris instituted more forms of eye candy. About 32% of Auburn’s Slam Reads used a form of motion at the point of the snap. Of the 48 such reps, 30 occurred over the last five games with the most occurring the SEC finale against Mississippi State, which saw 63% of the Tigers’ Slam Reads utilized this tactic.
The Slam Read was Auburn’s favorite play across all three downs in our sample. But naturally, it logged most of its tries on firsts. There, it more than tripled the Tigers’ 2nd-favorite look in tries. This concept’s Success Rate and Y/A had an inverse relationship. Though the Slam Read’s 42.1% Success Rate to start a set of downs was its worst, it’s 6.12 Y/A was its best. The former increased to 50% and 75% with the latter dipping to 5.14 and 3.33 on second and third downs, respectively. Nearly, two-thirds of Auburn’s Slam Read were on RPO designs. As Malzahn’s notable bread-and-butter, bubble and tunnel screens were far and away the favorite route tag. But with Morris calling plays, more Slant, Stick, quick-outs, and slide/flat outlets commanded targets. Either way, the Slam Read sported better numbers without tags. On RPOs, the concept’s Success Rate worsened to 46.3% and its Y/A slunk to 5.42 when Auburn was either up or down 18 points or less.
2. Inside Zone Bluff Read: 6.78% Play Share, 6.74 Y/A, 52.2% Success Rate
The Bluff Read remained Auburn’s beta ground look, but its usage was more sporadic than it would seem. Four games logged three or less reps. Exactly half of its reps in our sample occurred in the two-game stint against LSU and Tennessee. In that span, only three tries separated the Bluff Read from owning this offense’s top play share when accounting all snaps. But despite the tries, our concept in question delivered a Y/A and Success Rate under its season-long clips versus the Bayou Bengals and ole Rocky Top. Unlike the Slam Read that has all box blockers work on a playside zone flow, split zones ask a frontside man — typically an off-set TE or fullback — to fire against the grain and set a hard edge backside. Just in case the initial flow is stuffed, this creates a natural cutback lane should the ball carrier need it. That action can also hold up linebackers an extra beat as they try to diagnose the design as an added bonus.
Like the Slam Read, Morris leaned into providing this concept more at-the-snap motion as the year progressed. Along with Jet and “Return” motion for outside outlets, Auburn was one of the handful of SEC offense to utilize “inertia motion” for its tight ends. While aligning detached from the line in the slot, tight ends would be sent in motion across the formation but morph their path into a block rather than continuing into the flat or resettling on the formation. Over two-thirds of Bluff Reads experienced some form of at-the-snap motion across the season with 82% of such snaps taking place in the final six games.
The Bluff Read was resigned to mostly operating as an early down play for this offense. But at least half of its reps worked across all four downs. Though this concept rocked a 62.5% later down Success Rate, most of its value snaps occurred on firsts. The Tigers averaged a sizzling 9.95 Y/A with over half of its tries going for at least five yards. Though the Slam Read was an RPO favorite for this offense, less than a third of the Bluff Read’s reps were categorized as such in our sample. Per the results, route tags traded off explosiveness for consistency. While the Tigers’ such Y/A sank about a yard, its such Success Rate inched up to 56.3%.
3. Tackle Counter Read: 4.89% Play Share, 4.74 Y/A, 41.9% Success Rate
With two Inside Zone Reads representing a large portion of Auburn’s run game, Malzahn and Co. featured the Tackle Counter Read as its go-to misdirection. Like last year, this concept accounted for roughly 5% of this offense’s snaps in SEC play while putting up a Success Rate around 42%. The reason to why Auburn included the Tackle Counter Read in its script isn’t a grand mystery in the slightest. Generally speaking, Counters were built to turn the tables on over-aggressive defenses. Since zones present a straightforward blocking flow, defenses can start to get itchy after a while and hone in on them. Feigning as a normal backside zone action, a couple of down blocks invite defenders to attack the other side of the center before sealing them inside as a pair of pullers set the new hole. The first puller is almost always the backside guard who will kick out (or “trap”) the end man. Unlike the traditional Counter design that asks an off-set tight end to get their hands a little dirty, the backside tackle performs as this play’s “wrapper”/lead blocker. Along with its two primary zone reads, the QB has the option to keep the ball post-mesh based on how a read defender reacts after the snap. That might sound inconsequential and basic, but not all power designs are set up this way. Take for instance the Duo Dive or one-guard Power that rarely see a backside QB keep due to a wonky read man or unclear path. On gap schemes like those, most offenses instead substitute route tags as outs just in case the playside design is doomed.
The Tackle Counter was exclusively an early down play. All 31 reps in our sample occurred on ether first or second down. Despite designed to catch defenses with its guard down, this concept hardly knocked back opponents on firsts. There, it sported a forgettable 3.44 Y/A and 38.9% Success Rate. Not that the Tackle Counter’s second down output was otherworldly, but 6.54 and 46.2% respective clips in comparison at least attempted to rose-scent the look’s bottom line. For what it’s worth, a little over half of this concept’s total reps were on RPO designs, which really weighed down the look’s metrics. Auburn only mustered a 4.24 Y/A and 35.3% Success Rate on these plays. On all attempts, at-the-snap motion was seen on 44.1% of the Tackle Counter’s tries. In addition to the dual pullers, the ample eye candy with “inertia”, Jet, “Return”, and flair motion really toyed with linebackers. But obviously, no too much ala this concept unassuming stats.
4. Counter Read: 2.21% Play Share, 5.64 Y/A, 50.0%
While Tackle Counter was a part of Gus’ scheme, this version was all Chadman. At Arkansas, traditional Counter action was usually a part of Morris’ attack. In 2019, roughly 7% of the Hogs’ offensive snaps were composed of guard+tight end Counters. By default, Counter is meant to hit the weak side of the formation. Once the defense over-commits towards the strength, we sucker them with brawn on the backside. With a tight end functioning as a puller, the path is basically set in stone unlike Tackle Counter that can have more leniency with its orientation. To help with their blocking vision and release towards the backside, tight ends commonly align in a "sniffer" position or off-set from the formation. Not too many sane play callers would ask an on-ball tight end to pull as a lead blocker — But hey, you never know.
Looking at the macro, the Counter Read doubled its play share year-over-year in SEC play. Considering this offense already had a form of Counter, it’s fair to question why Auburn gave this concept a shot in addition to dismal returns on its limited reps in 2019. Other supporting ground looks this offense had sported previously like Inverted Power Veer, Power Toss Read, and Y-Insert were shoved aside in lieu of this look. At least, Morris coached them up to the tune of a 50% Success Rate and 20% Explosive Run Rate. While Bo Nix was quite good at working Inside Zone Reads per a 65.6% Success Rate and 15.6% Explosive Run Rate, he was far more muted on his Inside Power Read keeps. Across his five such carries he only gained 14 yards with no first downs or touchdowns all season long. This offense favored calling its Inside Power Reads to the right. Nearly two-thirds of the concept group’s reps were directed thusly. The Tigers did this for obvious reasons: better results. Six of Inside Power Reads’ explosive carries came on attempts to the right of center.
5. Outside Zone Read: 1.58% Play Share, 5.80 Y/A, 60.0% Success Rate
Besides the previous four plays, the Outside Zone Read was the only other ground concept in our sample to log double-digit attempts. Basically three-fourth’s of Auburn’s rushing attack came off of its favorite quartet of run looks. Behind this concept, no other rushing play finished with more than five tries in our parameter. Let’s just say, War Eagle hardly deviated from its go-tos on the ground. But with a good deal of its attack being oriented between the bookends, the Outside Zone provided a way to reach defenders who overly peaked inside. Though in years past the aforementioned Inverted Veer and Power Toss Read acted as this offense’s changeup run concepts to the outside, those two looks combined for a measly 1% play share with Morris in charge. At least, this off-tackle design mostly worked. Actually that’s putting a little too lightly. I know it’s sample size is small; but no other run concept bested the Outside Zone Read’s 60.0% Success Rate.
Though a 5.80 Y/A is nothing to dismiss, only one of this look’s 12 attempts on the season gained at least ten yards. Thanks to that Tanks Bigsby tenner and two other tries, the Tennessee game saw made up over a quarter of the Outside Zone Read’s yearly production. Despite the lack of breakaways, none of these tries resulted in a loss. That’s because the Tigers seemingly secured the edge quite well. While the team’s cumulative rush yards before contact average was 2.45, that figure jumped up to 3.25 on these attempts.
MOST FEATURED PASS CONCEPTS
1. RPO Bubble + Tunnel Screens: 5.58% Play Share, 6.08 Y/A, 55.6% Success Rate
Chad Morris failed to present a look through the air the Tigers could consistently execute. Outside of Slant Variations, no single dropback design delivered a Success Rate of at least 50% that logged at least a dozen attempts. Thanks to its broken aerial attack, this offense was forced to depend on RPOs to make up the difference. Though these can’t be forced (after all RPO outlet screens are extensions of the run game and are only targeted when the defense is outnumbered or compromised on the perimeter), Bubble and Tunnel screens ended as this scheme's most-repped looks thanks to copious read option chances. Individually, Bubbles and Tunnel screens were targeted 21 and 15 times in our sample, respectively. All Verts was the only other pass concept to see that many targets by itself. This is nothing new for Malzahn’s offense. Last year, all RPO outlets (bubble, tunnel, swing, and slides) pooled together to total 6% of this offense’s snaps in SEC play. The team’s overall RPO Play Rate owned the SEC’s silver medal with a 31.5% clip. Both figures ticked up in 2020. Representing the conference ceiling, nearly 37% of War Eagle's snaps constituted as an RPO with such outlet screens totaling a 7.5% play share.
Auburn had the SEC’s 5th-lowest early down Pass Rate. An alarming 49% of its first and second down pass attempts were directed towards these two outlet screens. Designed to provide situational victories with numbers, both Bubbles and Tunnels saw at least half of their targets find success. All in all, they were their best selves to start a set of downs. Across their 23 combined first down chances, these outlets boasted a 71.4% Success Rate and 7.17 Y/A. Since these outlets were coupled to read options, they naturally were seen in spots where those runs saw a lot of love on the call sheet. Among Bubbles and Tunnels combined 36 attempts in our sample, only one occurred on the money down.
From where I sit, the increased element of at-the-snap motion to create positive lateral momentum certainly helped these screens find more wins. As the de facto slot and speedster for this offense, Eli Stove and Anthony Schwartz were Auburn’s two go-to receivers. Only five targets in our parameter went to other pass catchers. Despite dropping four balls, Flash saw a team-high 17 targets, finished with 115 yards, and accounted for five of the eight such first downs. Stove caught all 14 of this chances. But for whatever reason, he just wasn’t as situationally successful as Schwartz. Each snatched an explosive gain off of these outlets. In terms of calculating total yards, I’m not including these looks as a combined entity. But if I did, Bubble’s and Tunnel’s combined 219 yards would have been this offense’s 3rd-highest figure in our sample.
2. Flood Variations: 3.94% Play Share, 5.40 Y/A, 36.0% Success Rate
When its subconcepts came together, no other dropback group bested Flood Variations 3.94% play share in our sample. Simply speaking, these patterns call for route runners to all break the same way and overload a side of the defensive coverage. They are some of the oldest passes in the history of the sport. Though Auburn has used Play Action Bootlegs, Waggles, and Sprints in the past, Morris focused his efforts solely on Cross and Sail patterns in 2020. All but two of Floods’ yearly targets were one of those two designs. Even though his group ended the year as this offense’s 2nd-most featured look through the air, five games only targeted a Flood pattern once. Cross, the which commanded the most tries, is a weak side variant that aims to work away from a formation’s strength. Since this design is mostly directed towards space, a good deal of its targets occur in midfield areas inside the numbers. Sail, on the other hand, is a strong side pattern that aims to work a high-low along the sideline. Generally, its a three-man streak, deep out, and flat combo. But, two-man vertical route wrinkles are fairly common as well.
The South Carolina and Texas A&M games featured Floods the most. Besides those, no other game logged more than three such targets all year long. Over 60% of the concept group’s yards and 36% of its targets occurred in those two matchups. Against the Gamecocks, our two Floods were paired with one another twice. In those instances, Sail was targeted both times and delivered one first down. The Tigers also showed off a delayed rollout (“Dash”) wrinkle— this design’s only try all year — but it didn’t work. Along with a pattern off max protection, Auburn coupled Cross with the Smash Variation Bench thrice. Against the Aggies, all four Floods used power play action by pulling a guard. Though a common tactic for Cross, doing so on Sails is less common. Moreover, so is utilizing your back as a downfield route runner. RBs typically operate as the underneath outlet to the flat on this pattern. But after following the lead of other SEC offenses, Auburn became the latest to dip its toes into R Sail patterns where the back runs the deep outbreaking route. That said, Nix checked down to Schwartz in the flat both times it was dialed up. Outside of those two games, the only pattern that stands out was placing a Drive concept on the backside of Sail.
Excluding sack and scramble plays, Nix only connected on eight of his 20 Flood attempts in our sample. He almost finished with as many uncatchable attempts as completions. Only six of his such throws were deemed accurate. Both Anthony Schwartz and Seth Williams totaled three catches and 2 first downs; but the latter finished as this concept group’s most productive receiver. While logging the most targets with 8, Williams complied 65 yards, two explosive gains, a created catch, and the look’s only score in our sample.
3. Slant Variations: 3.47% Play Share, 7.77 Y/A, 68.2% Success Rate
Considering their bottom line and the number of targets they received, Slant Variations were the most dependable concept group for Auburn’s offense this past season. Despite the Tigers’ acumen for RPO designs, two-thirds of Slants’ targets took place on dropback patterns. Even on snaps where they weren’t targeted, these variations showed up on over 6% of Auburn’s plays all year. As natural manbeaters designed to win quickly, Morris coupled Slant Variations opposite zone toppers like Poker/Curl+Flat, Stick, and Spot as a mean to present a way to beat either coverage type pre-snap. By volume, the Tigers directed the same number of attempts to this route year-over-year. But thanks to less games and less snaps, Slant Variations’ play share grew. Most times, executing this concept group came down to simply playing pitch and catch. Like in 2019, roughly 66% of them resulted in a completion. But, the group’s Success Rate improved double-digits as each caught slant resulted in success. Of the 13 such completions in our sample, Slant Variations combined to total eight first downs and two scores.
Though they appeared in one shape or form in every game, six games targeted this concept group less than twice. The South Carolina, Ole Miss, and Northwestern games were the only instances where Slant Variations logged at least four targets. The largest chunk of the group’s output occurred in Columbia where the Tigers logged nearly 40% of its yearly production. Though the slant+flat combo was the least-targeted variant in our sample, both of its targets delivered a fresh set of downs in that Week 4 loss. Despite being the favorite, Tosser — a dual slant combo — put up the group’s worst returns. Though nobody should bitch about a 58.3% Success Rate, a 4.83 Y/A is hardly a figure to make you giddy. Thanks to maximum malleability as a one-person concept, Solo Slants were commonly isolated on the backside of bunch sets and inverted Stick patterns. These donned a 71.4% Success Rate and 10.3 Y/A on targets when Auburn was up or down 18 points or less.
4. Vertical Shots: 3.47% Play Share, 4.55 Y/A, 13.6% Success Rate
Even though Bo Nix failed to progress as a vertical passer, Auburn allowed two deep concepts finish among its most-repped looks through the air. In our sample, this offense was just as likely to target a Slant Variation as a Vertical Shot. Looking at the numbers, that certainly was a foolish plan of action. Sure, the group was responsible for three TDs and zero INTs; but over half of Nix’s such attempts were charted as uncatchable. Excluding sack, scrambles, and throwaways, Nix connected on only a fifth of this Vertical Shots in our sample. Despite the downfield nature of these designs, Only two of the four connections resulted in a gain over 20 yards. Over half of the group’s yardage came on Eli Canion’s bomb in the bowl game. By volume, the Tigers targeted Vertical Shots the 3rd-most within the conference. Yet, only Kentucky’s floundering scheme, which has finished as a bottom10 pass offense the last three years amongst Power5 teams, posted a worse Success Rate than Auburn’s 13.6% clip.
Solo Streaks and Slot Fades made up most of the group’s targets. Despite the latter going 0/7, Auburn managed to haul in three Solos in our applied parameter. Outside of a four-yard TD on a Goalline Fade in Week 1 versus UK, all of Vertical Shots’ yards came via Solo’s triplet of completions. Along with Canion’s deep score vs. Northwestern, Seth Williams caught a pair against LSU for 46 yards. Including all variants and snaps (even ones outside of our sample), Vertical Shots experienced their highest usage against the Bayou Bengals. The group made up about 12% of Auburn’s offensive calls and just under 30% of its yards in what turned out to be its best win of the season. Anthony’s Schwartz’s 91-yarder in the 4th quarter composed 45% of the group’s yearly output. Too bad that puppy fell outside our point margin.
5. All Verts: 3.31% Play Share, 4.29 Y/A, 23.8% Success Rate
This concept was the only dropback pattern to finish among the Tigers’ most-repped passes in back-to-back seasons. Yet, Auburn was just as dissatisfied with its All Verts chances as Vertical Shots. While a 23.8% Success Rate might seem better in comparison on the surface, that figure is a little fraudulent. When taking away sack, scramble, and throwaway attempts, over half of this concept’s reps in our sample were omitted. With those snaps taken out, Nix only connected on 20% of his All Vert chances— the exact same number of his Vertical Shots. Likewise, Seth Williams was this offense’s go-to pass catcher on these designs. Along with his 11 Vertical Shot targets, Williams tacked on a half-a-dozen All Vert attempts. At least, his lone catch went for 58-yards, which was the longest in our applied parameter. While Shots were more about manipulating one man deep by means of isolating him outside the numbers or having others work exclusively short, All Verts strove to overload the backend of coverages by sending at least three receivers into the defenses third level.
Like its 21 targets would hint, All Verts averaged about two tries a game. But like most of its passing game, its production was centered around a few matchups. The only games that logged three or more reps all occurred within a month of one another. Thanks to two explosive scrambles and a 22-yarder to DJ Williams, the South Carolina game saw its highest usage and ended as its most productive outing. In the two game stint versus LSU and Tennessee that featured All Verts a combined 12 times, Auburn only targeted our concept in question twice outright. The rest were either a check down, sack, or scramble. For what it’s worth, both of the pass targets directed All Verts' way fell incomplete.
6. Stick: 2.21% Play Share, 4.50 Y/A, 42.9% Success Rate
With the previous two deep concepts looking to stretch defenses vertically, Auburn leaned on Stick as a pattern to win short by stretching defenses horizontally. Including all of Auburn’s snaps, Stick was featured on about 5.2% of this offense’s plays but only logged 14 outright targets in our sample. Though great a presenting easy throws, the Tigers had trouble logging situational victories on this concept. Despite completing nearly 70% of these attempts, this offense finished below the SEC-average Success Rate. Taking into account that Auburn featured Stick the 3rd-most in the conference, that subpar rate of return was just another example of this passing game’s toothlessness. At least, four of the nine completed Stick attempts in our sample resulted in a fresh set of downs even if the look failed to produce a single score or explosive rep.
Auburn had two primary renditions of Stick. The first was a version commonly seen from stack or bunch sets consisting of a quick inside hitch and outside out route (“Stout” in our vernacular). Morris preferred Stout to function in exclusively the RPO game. All but two of its targets occurred opposite an Inside Zone Read. “Shock” — an inverted stick from trips— saw the most tries of any variant. Though the inner-most receiver still works the main route, the No. 1 and No. 2 receivers swap responsibilities; the outside man now becomes the threat towards the flat with the middle man getting vertical. Along with being seen on five more snaps across the season, Shock doubled Stout in number of targets 12 to six across the season. Though an early favorite from empty, this pattern was very inconsistent. Because of that, Morris had a hard time justifying giving such a conservative pattern so much love, and its usage faded hard down the stretch. Shock was only seen six times the remaining five games with only a couple of snaps in the final three.
Honorable Mention: Trips Bunch Set Passes on 3rd Down
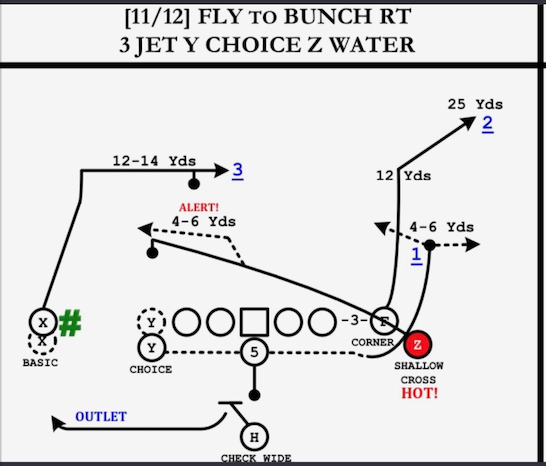
In case you went all Morty’s Mindblowers on us, you probably remember the Tigers played quite a bit of third downs this past season. With that being the default passing down for run-first offenses like Auburn, War Eagle had no shortage of such tries through the air. Only Mississippi State’s Air Raid sported a higher 3rd Down Pass Rate than Auburn within the SEC. Apparently, there was a concerted effort to use trip bunch concepts to confuse zone drops and match pattern assignments. Over a sixth of Auburn’s third down offense repped a version of the design above. Though the backside dig was overly a Solo Slant, Morris also tweaked the frontside pattern to present “Dangle” (Drive+ Angle Trail), Triangle, Stick and Rub looks on occasion. Over half of these plays resulted in a conversion, but results undoubtedly cooled as the season progressed. Despite starting a perfect 7/7, trip bunch set passes went 0/6 to close the year. For what it’s worth, these passes saw their best day against Ole Miss where all four found success.
TOP YARDAGE GAINERS
1. Inside Zone Slam Read: 716 yards, 5.59 Y/A, 48.4% Success Rate
Auburn’s top yardage gainers list starts in an obvious place. As this offense’s favorite concept by a significant margin, the Slam Read more than doubled the next concept in line in terms of yards. A remarkable 20% of Auburn’s total yards in our sample was forged on the back of its bread-and-butter run look. Though half of the Tigers’ Inside Zone Reads failed to gain over three yards, the Slam Read generated 26 carries that went ten yards or more on the season, which translated to a 17.1% Explosive Run Rate. Though lower than the team’s 18.6% cumulative clip, its figure was undeniably sturdy. Bo Nix and Tank Bigsby combined to account for 19 of these chunk runs. As this offense’s breakout ball carrier, Bigsby logged all three of this concept’s attempts that gained more than 25 yards. The Slam Read’s most productive outings occurred against Arkansas and Tennessee. These two games accounted for just under half of the look’s explosive carries on the season and over a third of its output in our sample.
2. Inside Zone Bluff Read: 310 yards, 6.74 Y/A, 52.2% Success Rate
The Tigers were far more prone to trot out two-tight ends when in the mood to test fronts with split zone action. While less than a quarter of the Slam Read’s reps were deployed from 12 personnel, just under 60% of the Bluff Reads in our sample met that criteria. Though JJ Pegues unquestionably made his presence known often performing as the backside “trapper”, the Tigers were less consistent from these sets overall with only a 44.4% Success Rate. Despite the variability in that sense, the Bluff Read was certainly more potent from 12 personnel than other groupings. Of the look’s ten explosive carries over the course of the season, seven occurred with two tight ends on the field. Six were logged in the first five games with the Arkansas and Ole Miss victories each logging three explosive carries a piece. Mississippi State was the only other opponent to surrender multiple ten-plus yarders via the Bluff Read; both came from 11 personnel. At the end of the day, over a fifth of this concept’s carries were deemed explosive when including all snaps.
3. Slant Variations: 171 yards, 7.77 Y/A, 68.2% Success Rate
As I hinted earlier, the majority of Slants' production was fueled by the three game sample versus South Carolina, Ole Miss, and Northwestern. Regardless of margin, a mere 8 targets and 45 yards were logged in the remaining eight games. Four games didn’t target a Slant Variation one time. That’s somewhat interesting considering Auburn’s Success Rate targeting the concept group was the 3rd-best in the conference. Only Alabama and SCar proved to be more consistent within the SEC. You’d think with the overall shortcomings of the dropback game, Morris and Nix might have pressed more with these manbeaters. But by year’s end, the Tigers finished with the conference’s 5th-fewest number of Slant Variation attempts. But despite the wonky usage, no other true pass pattern out-gained this group in our applied parameter.
4. Smash Variations: 155 yards, 8.61 Y/A, 61.1% Success Rate
When this concept group functioned as designed, Smashes proved to be some of this offense’s best pass patterns. Excluding sacks, scrambles, and throwaways, Auburn completed 80% of these looks for a 66.7% Success Rate. A third of its attempts resulted in a gain of at least 20 yards. With those figures juxtaposed against the rest of Auburn’s passing game, I guess you’d have to ask Morris and Malzahn why they didn’t feel the need to hammer Smashes more over the course of the season. Two of its three explosive attempts were logged in Auburn’s final two games. Furthermore if it wasn’t for this group’s 43 yards on its six chances in the season finale, it wouldn’t have wound up on this list. In addition to its plays against Northwestern, Smash Variations combined for another 43 yards on six attempts against South Carolina. Eli Stove was this concept group’s best target. While catching all eight of his such chances, he delivered 77 yards and four of Smashes’ seven first down conversions. No other Tiger finished with more than 2 such targets, 1 such catch, or 25 such yards in our sample.
5. Tackle Counter Read: 147 yards, 4.74 Y/A, 41.9% Success Rate
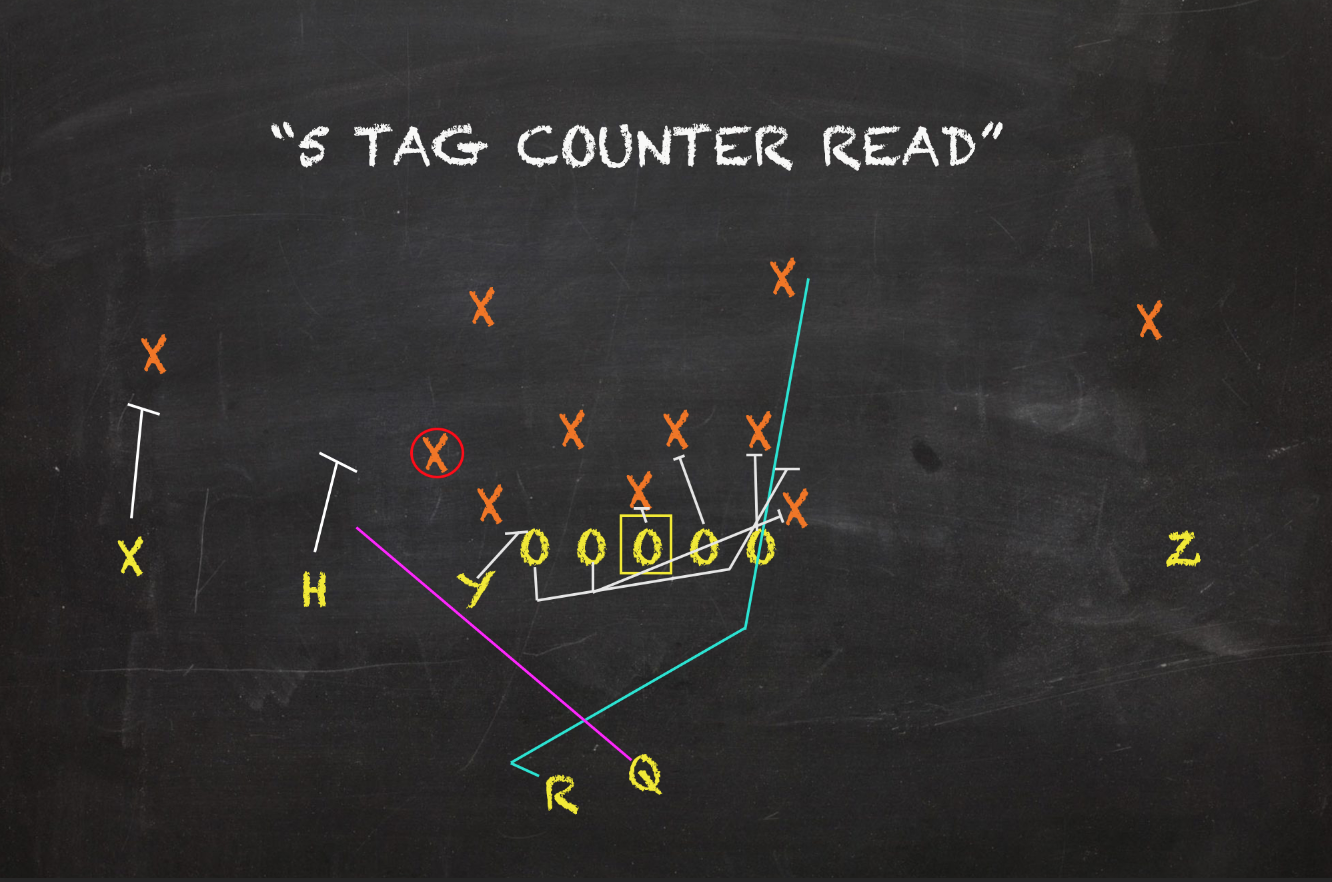
Despite finishing as this offense’s 3rd-favorite concept, its usage fell off a cliff after the fifth game of the season. Two-third of the Tackle Counter’s reps were logged before the LSU game. So obviously, its production was overly dependent on its splash gains in the front half of the Tigers’ schedule. In fact if it wasn’t for the Ole Miss game, there’s no way this concept would be sniffing this list. Auburn featured a Tackle Counter on over a quarter of its offensive snaps against the Rebels producing 81 yards for three explosive carries. Coming into the game, the Tigers only mustered one ten-plus yard attempt. After, this offense delivered a fresh goose egg in that department with a sour 3.33 Y/A and 33.3% Success Rate.
6. Double Post: 139 yards, 23.2 Y/A, 50.0% Success Rate
Auburn only targeted the Double Post pattern six times over our applied parameter, but half of its chances were completed. All three of these attempts occurred within a month of one another between the South Carolina, Ole Miss and Tennessee games. Though this offense struggled immensely to find valuable deep completions, War Eagle found no trouble on this concept’s limited tries. Even with the increased degree of difficulty inherently found on deep tries, no look sported a higher upside. Anthony Schwartz’s 54-yarder on a slot wrinkle of this pattern was the season-long. But, Seth Williams remained Nix’s favorite target. No. 18 caught two of his four such chances, one of which was a creation, for a team-high 82 yards.
MOST SUCCESSFUL CONCEPTS
1.RPO Flat/Slide Screens: 1.58% Play Share, 10.0 Y/A, 90.0% Success Rate
Much of what I wrote about Auburn’s primary RPO route tags rings true for Flat/Slide targets. With Chad Morris displaying craftiness in this facet, outlet screens became less static and brought some color to the Tigers’ stale plan of attack thanks to the increase usage of at-the-snap motions. Used opposite their core Inside Zone Reads, Flat/Slides unabashedly kicked ass with that added element. Sometimes with “inertia motion” and others from static positions on the line, quick flat routes with tight ends opposite Slams played off a split zone flow before continuing past a frozen defender outside the numbers. JJ Pegues was the recipient to all four of his position group’s such targets, two of which resulted in first downs. This offense's other factor catchers, Eli Stove and Anthony Schwartz, chipped in an additional six targets and catches. Though obviously not used in the same exact fashion as the Tigers’ tight ends, the added movement helped these guys capture wins as well.
2. Slant Variations: 3.47% Play Share, 7.77 Y/A, 68.2% Success Rate
Slants were well-dispersed across the three downs, but the group experienced the plurality of its attempts on firsts. Those targets, however, were the main source of disappointment. Only four of the ten such targets found success while sporting a mundane 4.20 Y/A. By those figures, I’m sure you can put together than Slants totally TCOB on other downs. On seconds, all five targets worked as six of the seven money down chances converted. Excluding first down attempts, Auburn averaged roughly 11 Y/A targeting this concept group. Often operating as the isolated matchup creator, Seth Williams was unquestionably War Eagle’s top pass catcher to target on a slant. He hauled in all six of his second+third down attempts with each one resulting in a first down. All in all, Williams totaled 88 yards and seven catches, one of which was explosive, on nine tries. No other Tiger finished with more than 3 such targets, 2 such catches, or 26 such yards.
3. Wheelie Switch: 1.26% Play Share, 13.4 Y/A, 62.5% Success Rate
Across the SEC, this Switch Variant experienced a modest year-over-year increase in usage thanks to a significant rise in rate of return. The Tigers were one of a handful of offenses where the Wheelie Switch finished among either its top yardage gainers or most successful concepts. Meant to mess with two deep coverages or match pattern rules, this inside wheel+outside post/dig combo begat five completions on eight attempts. Three of them were categorized as explosive. The Wheelie Switch’s lone TD occurred in the first game on the concept’s first target of the season: a 4th quarter 21-yarder to Eli Stove that helped seal the Tigers’ win over UK.
4. Smash Variations: 2.84% Play Share, 8.61 Y/A, 61.1% Success Rate
Despite finishing behind Floods, Vertical Shots, Slants, checkdowns, All Verts, and RPO Tunnels, in number of targets in our applied parameter, Smashes combined for this offense’s 2nd-best Success Rate in the dropback game. Only Slant Variations bested these perimeter-oriented high-low combos’ 61.1% clip. Of the three main subconcepts, Bench was the most featured and targeted. Over half of the group’s targets and successful snaps came via Bench. This out+corner combo was paired opposite Cross, Divide/989, Tosser, and operated as a roll-out pattern. But, all variants delivered some value. To beef up this group's collective profile, Traditional Smash and its inverted wrinkle “Corners” each saw at least half of its targets in our sample work.
5. Outside Zone Read: 1.58% Play Share, 5.80 Y/A, 60.0% Success Rate
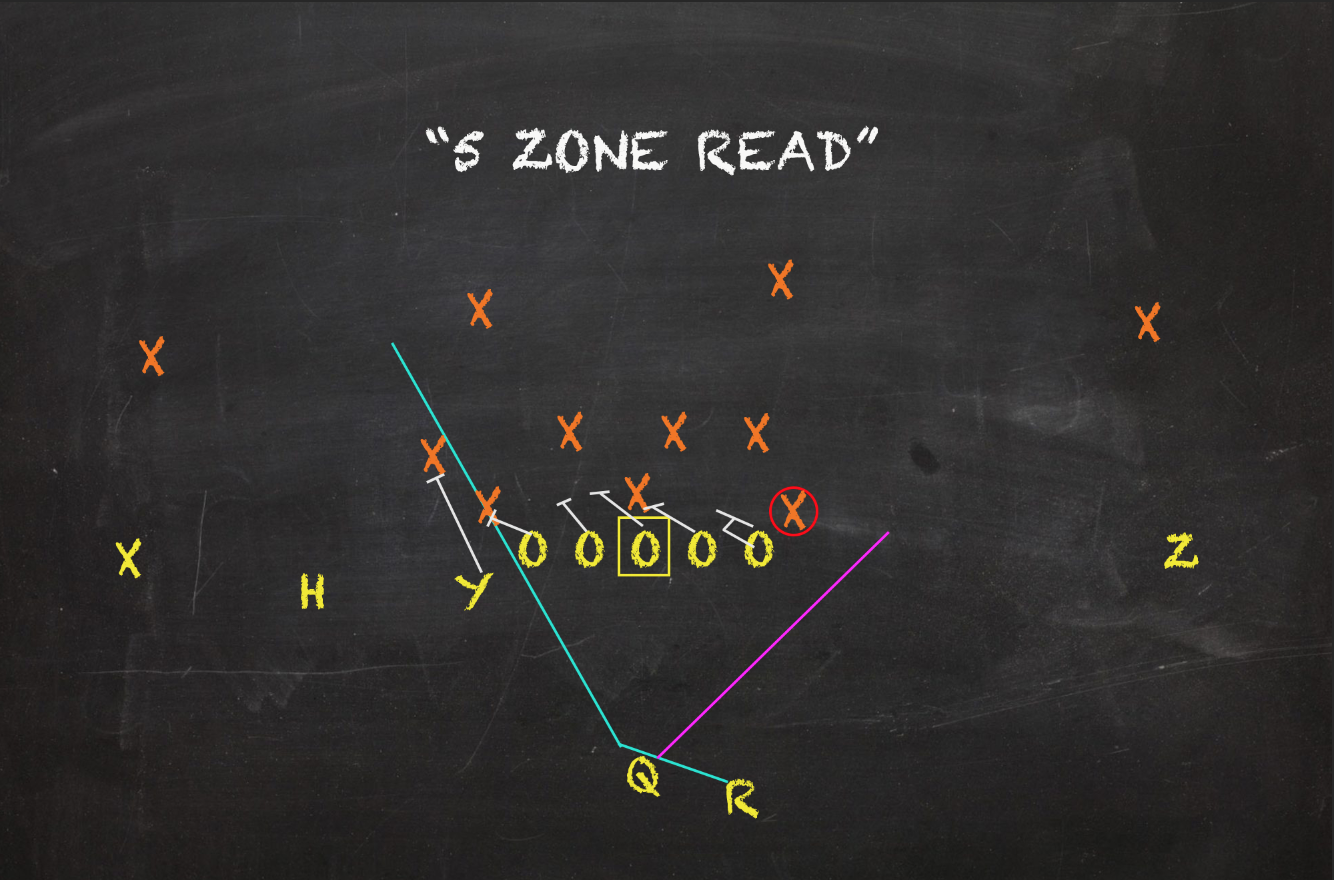
Like Bench, the Outside Zone Read wound up on this list thanks to barely working on over half of its limited tries across 2020. Across its dozen attempts, this concept never surrendered a tackle for a loss despite only generating one gain over nine yards. It was a safe, off-the-beaten-path kinda play to take advantage of opponents who failed to respect the edge. For what ever reason, all of this look’s shortcomings were isolated to Shawn Shivers carries. While only two of his attempts worked, all five of the remaining chances by Tank Bigsby and DJ Williams found success including both of the concept’s conversions. No matter who was the ball carrier, the Outside Zone Read was its best self to start a set of downs. On firsts, this play logged seven of its ten tries in our sample and rocked a 71.4% Success Rate.