2020 Offensive Play Calling: Tennessee
2020 Offensive Play Calling: Tennessee
So that’s that. The Jeremy Pruitt Era is over and Tennessee’s onto the next coach full of promise pledging to bring the Volunteers back to the top of the college football mountain… again. For three years, Tennessee’s offense was erratic and unpredictable. Some of that was on its gun-shy passer. Some of it was on its underperforming line. Some of it was on the difficulty of playing in the SEC. But, the major scheme at work didn’t provide many answers for Tennessee to maximize its offense.
Despite the expectations of competing for a title in the East, Tennessee obviously has undertaken a different trajectory since October. Disregarding the things behind the scenes, the run game commonly delivered iffy returns, the defense finished bottom6 in the conference in Yards/Play allowed and Success Rate, and the Vols turned the ball over at the 3rd-worst Rate in the SEC. With the numerous failures on the ground, the pass game that needed a hand was incessantly kicked in the face by having to shoulder plenty of behind the chains chances with increased difficulty. No SEC offense had a higher 3-and-Out Rate than Tennessee’s 30.4% clip this season. There really isn’t much foundation for the new staff the build upon based on the Vol’s 2020 output.
For my money, Jim Chaney’s scheme was the most boring in the entire conference. Even though a team like Kentucky gave a third of its calls to a single concept, they still displayed more creativity and inguninty than the Vol’s offense in 2020. Tennessee overly wanted to establish the run on first down, work itself into a manageable third down, and do it all again if the process worked. The pass game was secondary. To use a so-so oxymoron, this offense was conservatively aggressive. As Plan B, the air game had to offset Tennessee’s favored, guarded approach on the ground with vertical pass concepts. Sometimes the Vols would go out of their way to take the air out of the ball and only pass deep once defenses were drawn up into the box.
That worked for the Vols in 2019 and helped them win six straight games to close out the year. Jarrett Guarantano entered this year as the SEC’s most accurate deep and 3rd down passer. Tennessee very much hoped to run back a team that finished top2 in Explosive Pass Rate both offensively and defensively in SEC play with an all-conference slate. But we all have hopes and dreams, don’t we.
Though the cupboard is close to being bear, let's take a look at Tennessee's calls when the margin was 18 points or less. Rather than letting desperation calls skew their “normal” modus operandi, omitting those plays give us a better depiction of what its offense was and what its favorite looks were. I examined the Vols most featured runs and passes, the concepts that gained the most yards, and their most “successful” looks across these meaningful minutes.
MOST FEATURED RUNS
1. Inside Zone Slam Read: 17.8% Play Share, 5.19 Y/A, 48.9% Success Rate
No matter where he has been, Chaney’s offenses have been run-first. Establishing the run to tilt the safety count to orchestrate a shot overly has been Tennessee’s offense the last few years. The SEC-wide first down Pass Rate was 50% in our applied parameter this past fall. Tennessee was seven points below the average with the 4th-lowest such Pass Rate in the conference. With the ground-heavy approach, the Inside Zone Slam Read anchored its offensive script. Only UK and Auburn dedicated a higher play share to this look in our applied parameter. When your best lineman is a guard, it makes all the sense in the world to let him lead the way on the ground. I believe that was a critical factor in Chaney making the Slam Read this offense’s core concept.
On the surface, a 48.9% Success Rate and +5 YPC is more than acceptable for a core run play. But, the Slam Read was its worst self to start a set of downs. There, its Success Rate dropped to under 40%. That element naturally had the Vols playing behind the chains quite often, which hindered its floundering passing game. All in all, the play delivered. Despite their play caller often telegraphing to the defense that this concept was coming, the bottom line speaks for itself. Both of Slam Read’s Success Rate and Y/A top the team’s averages (43.2%, 4.55) in meaningful minutes.
Regardless of margin, all Inside Zone Reads saw an explosive carry on every tenth attempt on average. The problem was, however, about 42% of these tries gained three yards or less. Here’s the deal: the Slam Read did its job. But despite its dependability, it can be a lackluster play. Moreover, an offense can lull and lumber if it leans on it too much, which was exactly the case with Tennessee’s offense in 2020.
2. Outside Zone Off-Tackle: 6.18% Play Share, 3.68 Y/A, 32.4% Success Rate
With Slam aiming to hit defenses inside between the tackles, Tennessee naturally featured Outside Zones to attack and outflank fronts towards the perimeter as a compliment. Despite their well-intentioned wishes of getting their backs outside the bookends, the Vols’ offense misfired frequently on Off-Tackles. Because of that, the concept that owned the team’s top play share in 2019 effectively saw its tries cut in half in 2020. Less than a third of its reps in our parameter met situational goals as it averaged less than 4 Y/A. Yikes.
Despite being Tennessee’s 2nd-most featured concept in our parameter, its usage was sporadic. Six games saw two Off-Tackles or less. The look was certainly more potent in the Vols’ back half of the schedule. Of the six 10-plus yard carries, only two occurred before the Auburn game in Week 9.
Most of the Off-Tackle’s reps occurred on first down. Only ten tries were logged on the remaining downs. On firsts, like the Inside Zone Slam Read, this look overly faltered. Its Y/A and Success Rate dropped to 3.54 and 29.2%, respectively. Such abysmal returns paired with considerable volume in these spots should illustrate why the Off-Tackle was a net-negative look this fall. That paired with the aforementioned shortcomings of the Slam Read to start a set of downs should also be telling. Tennessee wanted to predominately and methodically run the ball with its two core zone plays. Though Jet motion usage was average and Orbits increased once Harrison Bailey started getting reps, no SEC offense used less pre-snap motion than Tennessee overall or on first down. So not only were the schemes stale, this offense was overly static pre-snap.
3. Counter (Read): 4.00% Play Share, 6.18 Y/A, 50.0% Play Share
To compliment the heavy zone usage, Tennessee also featured a good amount of Counters. Since zone blocking schemes are uniform and easily identifiable for defenders to key on, this old school design uses the defense’s overaggressiveness and anxiety against itself. Before feinting a zone flow, a couple of blockers will peel around and create a hard edge opposite the initial action. For us, the traditional Counter pulls the backside guard and an off-set TE or fullback to act as the trapper, or edge setter, and wrapper, or lead blocker, respectively. Tennessee used other Counters, but the traditional design was the one the Vols predominately leaned on. With that in mind, Tennessee incorporated both read and non-read Counters into its 2020 script. But for the purposes of this article, I am combining their output. (Just in case you were curious, each posted a 50% Success Rate when the Vols were either up or down 18 points or less).
Counters may not have finished among this offense’s top gainers, but the concept certainly ended as one of its most consistent even if its usage wasn’t. It took awhile for this look to become part of Chaney’s 2020 plan. But once Tennessee made the switch at QB, Counter’s reps really increased. Prior the Auburn game, only three were called; the Vols would call 27 over its last four games. During that stint, UT utilized more Jet and Orbit motions, which were seen on the vast majority of these misdirection’s reps. While Counter naturally is meant to hit defenses when they’re off-balanced, the added eye candy facilitated the operation. With Duo Dives fading from Tennessee’s script year-over-year, Counter became Big Orange’s de facto power play. Besides half of its reps working, it averaged almost a full yard more than the Slam Read.
4. Straight Inside Zones: 3.09% Play Share, 3.59 Y/A, 23.5% Success Rate
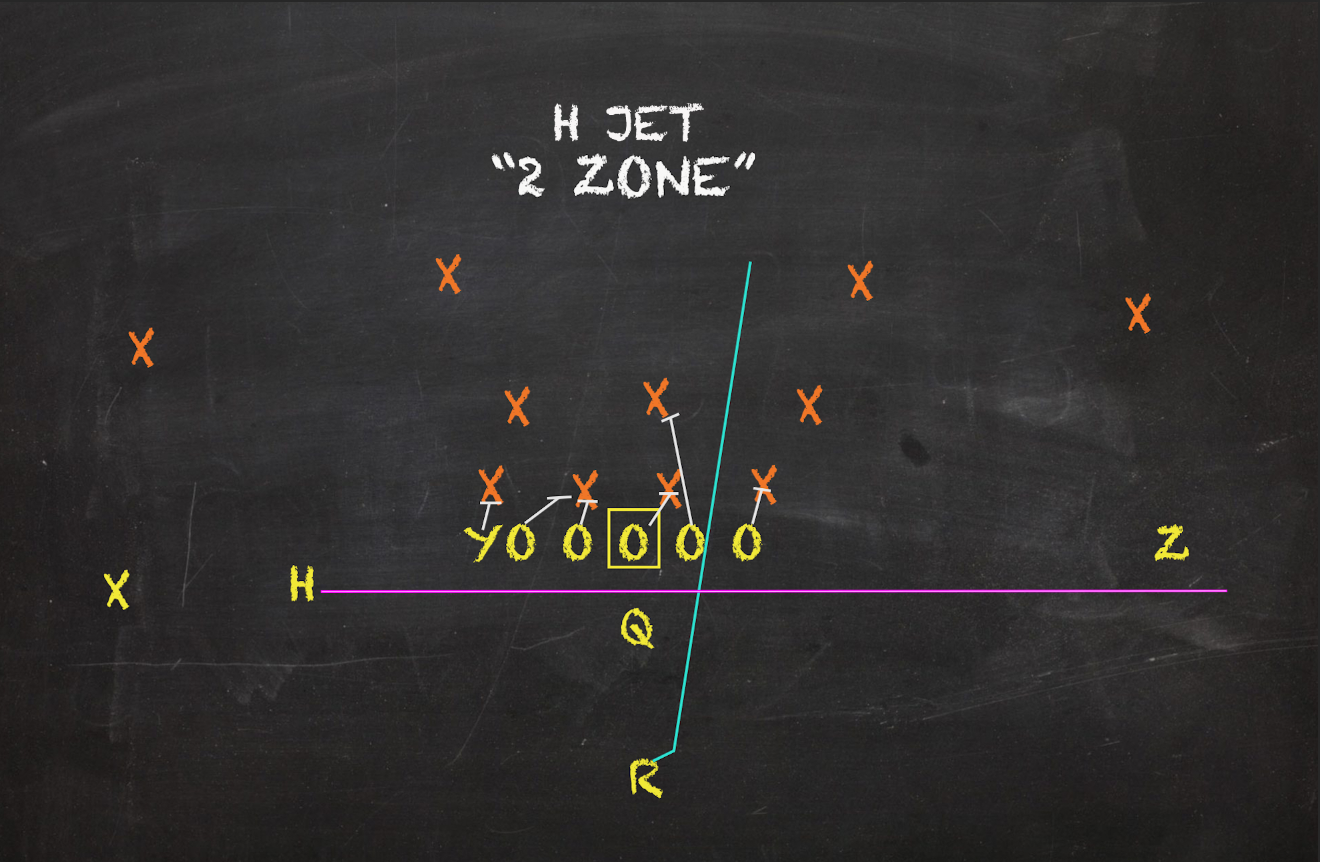
Straight Inside Zones were even worse than its read counterpart. Like Counter, non-read Inside Zones typically utilized Jet or Orbit motion to move defenders laterally prior to the snap. Despite that, this concept only logged one carry that gained over ten yards.
Though I combined Slam and Split Zones together for the purpose of this article, the former was the more featured of the two in the past. But, the non-read Slam design significantly lost play share year-over-year in SEC play. In 2019, this Inside Zone accounted for 7.64% of Tennessee’s plays — over three times more than its clip from this past season. Still, I don’t think I will find many dissenters advocating that these Inside Zones should have received more reps. The overwhelming lack of success from both Slam (20.0%) and Split Zones (28.6%) was a clear black mark on this run game’s record.
5. Outside Zone Read: 2.36% Play Share, 3.08 Y/A, 15.4% Success Rate
Like Off-Tackle, the Outside Zone Read totally sucked this past fall when called upon. Across the 13 OZ Read reps in our parameter, only two met situational goals. And I’m sure you noticed, its Y/A is even worse than its non-read counterpart. Though its overall numbers are better, a 30% Success Rate across 21 tries is nothing to boast about. Over half of Outside Zone Reads resulted in a gain of three yards or less. Both of the concept’s explosive carries occurred after the game was already determined in Week 4 versus Kentucky.
Though a 2.36% play share doesn’t seem like much, it is an increase year-over-year. The Outside Zone Read was not among Tennessee’s most featured run looks last year in SEC play; so it begs to wonder why it secured a decent amount of tries despite an inadequate output. Ty Chandler and Eric Gray had an even workload with ten and eight such carries, respectively. Both produced about 30 yards on their Outside Zone Read tries, too. Tennessee’s quarterbacks failed to log a single rush attempt on this look this past fall.
MOST FEATURED PASS
1. All Verts: 5.82% Play Share, 4.44 Y/A, 37.5% Success Rate
Tennessee paired various vertical passing concepts with its root zone run scheme. None received as many reps as All Verts. By volume, only Mississippi State and LSU called the look more than Chaney’s gang. Excluding our parameter, the Vols dialed up this deep concept 55 times this season. But only 31 resulted as true attempts; 15 other reps ended as either a sack or a scramble. The returns weren’t spectacular in any way. The numbers targeting this pattern to the right were particularly pathetic: 0/11, 2 INTs. The lone TD on this look was a JT Shrout to Velus Jones connection, which was one of the two deep completions this concept accounted for. So considering the amount of plays that were dedicated and the fact only two explosive completions were to show for it, it's safe to say All Verts' output left a lot to be desired.
As to how this look fit into Tennessee’s offense in meaningful minutes, it was the Vols most featured pass concept across all three downs. Plus, UT distributed All Verts’ reps equally with no down having more than 12 or less than nine. While Tennessee’s most called runs collectively sucked on first downs, their go-to pass concept put up a 54.6% Success Rate. But when Tennessee found itself behind the chains, All Verts was far from a dependable play especially on the money down. Defenses were often ready to clamp that look down per Tennessee’s 16.7% Success Rate and 1.08 Y/A. Yes… mutha f******’ ONE POINT ZERO EIGHT.
2. Cross: 3.09% Play Share, 5.53 Y/A, 47.1% Success Rate
After All Verts, Flood Variations combined to accounted for the second highest play share among Tennessee’s pass concept groups. When broken out, Cross logged the most reps. That said, this look’s usage in the Vanderbilt game made up almost half of its targets overall. Outside of that and a couple other late season games, Cross was a one try per game kind of play for this offense. Tennessee really liked to pair this weakside flood with play action. But more often than not, the design would break down either due to bad pass blocking, weary quarterback play, or good coverage. Over the Vols’ last three games, Cross was featured 14 times; nine of those plays resulted in either a sack or a scramble.
Regardless of scoring margin, Tennessee called a Cross design 28 times while targeting it outright 17. Three of its four explosive completions occurred in that game against the Commodores. Despite the ample miscues, Tennessee managed to put up a respectable 47.1% Success Rate on Cross reps.
3. Sail: 2.91% Play Share, 8.69 Y/A, 50.0% Success Rate
Though Cross just edged out its fellow Flood Variation in total tries when our parameter is applied, Sail’s usage was far less sporadic in comparison. Along with being more consistent on Tennessee’s script, Sail was more consistent producing desirable outcomes. Sure, only one rep birthed a completion of 20+ yards; but eight of its 16 overall targets this season resulted in a first down. Most of Chaney’s passes were absolutely uninspired, but I did like his strongside flood designs. And while Cross’s 28 plays came on six patterns, I caught at least eight separate Sails across it 19 featured snaps in 2020. Forgive the jargon, but Sail was paired with concepts like Drive, Shallow, Angler/Texas, Divide/“989”, and some Smash wrinkles.
Regardless of point margin, Tennessee called the SEC’s 4th-most Floods this season behind Alabama, LSU, and Missouri. But in terms of Success Rate, the Vols finished below the conference average. Most of the team’s worthwhile targets occurred towards the right. There, Big Orange passers combined for 79% Completion%.
4. Fades: 2.73% Play Share, 8.07 Y/A, 26.7% Success Rate
Tennessee repped a Vertical Shot play 34 times in our applied parameter, but none logged as many tries as Fade concept. Tennessee’s main example of this look consisted of a “smash fade” combo of a slot fade+outside hitch. Opposite the Fade, the Vols would either unleash a sluggo or a streak. To allow the deep pass develop, this offense frequently turned to max protection on Vertical shots.
Following through with his conservatively aggressive approach of slapping opponents upside the head with copious zones in order to coax them to stack the box before taking a shot, Chaney liked to try Fades on first down. In our applied parameter, over half of its reps were charted to start a set of downs. But unlike the rest of the Vols’ most called pass concepts in those spots, the look put up stinky stats. Only two of the look’s eight tries worked. But alas, that’s the boom or bust reality of banking on vertical passing to buoy an overly listless offensive approach.
5. Tosser: 2.73% Play Share, 5.53 Y/A, 53.3% Success Rate
Tosser — or double/all slant patterns — was featured on more plays than even the Vol’s go-to vertical favorite All Verts. Due to its inclusion in Tennessee’s budding RPO offense, Tosser was seen 58 times over the course of the season regardless of margin; it was only outright targeted 13. Despite the struggles for consistency, the Vols could depend on Tosser. Excluding uncatchable targets, Tennessee receivers caught 11 of their 14 total Slant Variation chances. Slants pooled together to produce a pair of 20+ yard plays and a score. Josh Palmer commanded a third of the team’s Slant Variation targets and yards.
Though Tosser was seen on nine plays in Week 1 when the Vols wanted to play fast, it only totaled ten the next three games combined. The Alabama and Arkansas games in Weeks 8 and 9 composed over half of the plays where the double slant was featured and logged five targets. But, its usage unquestionably waned after that. Tosser was only seen once in each of the Vols last four games.
Only a single double slant was targeted on first down during Tennessee’s meaningful minutes. But slants sometimes are best used behind the chains when the defense might sag and create cushion for the route to do damage. Tosser was its best self for this offense on second down. On its eight targets in our parameter, it posted a 7.38 Y/A and 62.5% Success Rate. It was far less laudable on third. There, Tosser did convert on two of its five tries. But, the double slant pattern put up a shameful 2.40 Y/A on the money down.
6. Hoss: 2.18% Play Share, 3.92 Y/A, 41.7% Success Rate
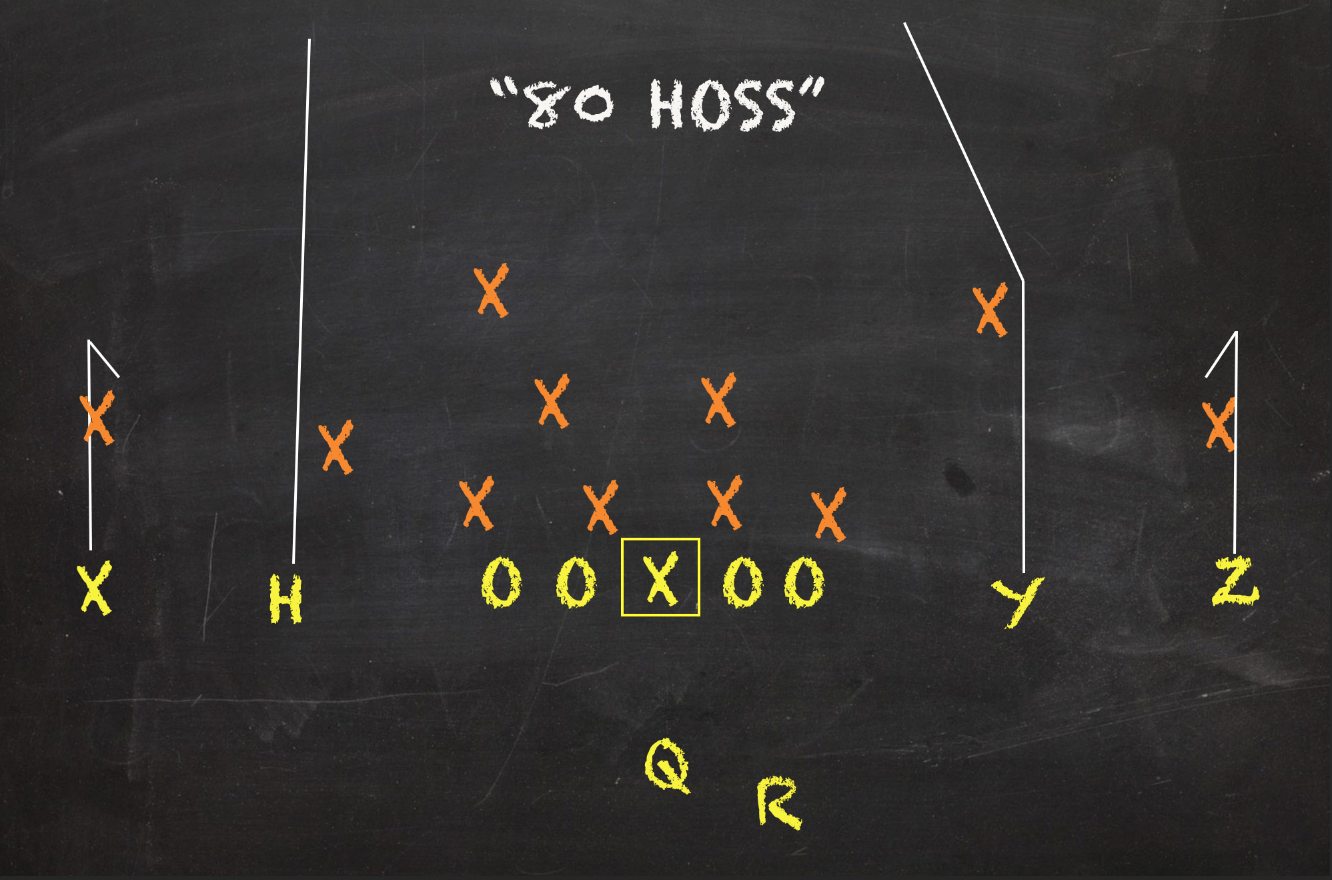
Hoss — a curl+seam combo — is a matchup play. Either from balanced or empty sets, it intends to stretch the defense laterally formationally before working its route combos in an up-and-down pass pattern. Some teams like Florida (and the New England Patriots before them) love utilizing a slot juke route on the inside to pick on slow-footed backers with a shifty slot. Tennessee did call that design once this year, but mostly focused on the basic, mirrored rendition. For some teams, Hoss and the “smash fade” with the slot receiver are the same play. Depending on a coaching point the vertical seam could morph post-snap into a fade. But for our charting, Hoss reps were exclusively where the inside receivers worked the seam.
Tennessee’s completions only came via the underneath curls. Though the downfield targets didn’t produce desired results, the curls presented easy completions on first down for the Vols’ passers to seize. Half of the concept’s tries occurred in those spots; two-thirds of those throws gained at least five yards. But only one of the remaining six reps in our parameter got the job done. Overall, Hoss was a subpar look for Tennessee’s underwhelming passing game.
TOP YARDAGE GAINERS
1. Inside Zone Slam Read: 509 yards, 5.19 Y/A, 47.9% Success Rate
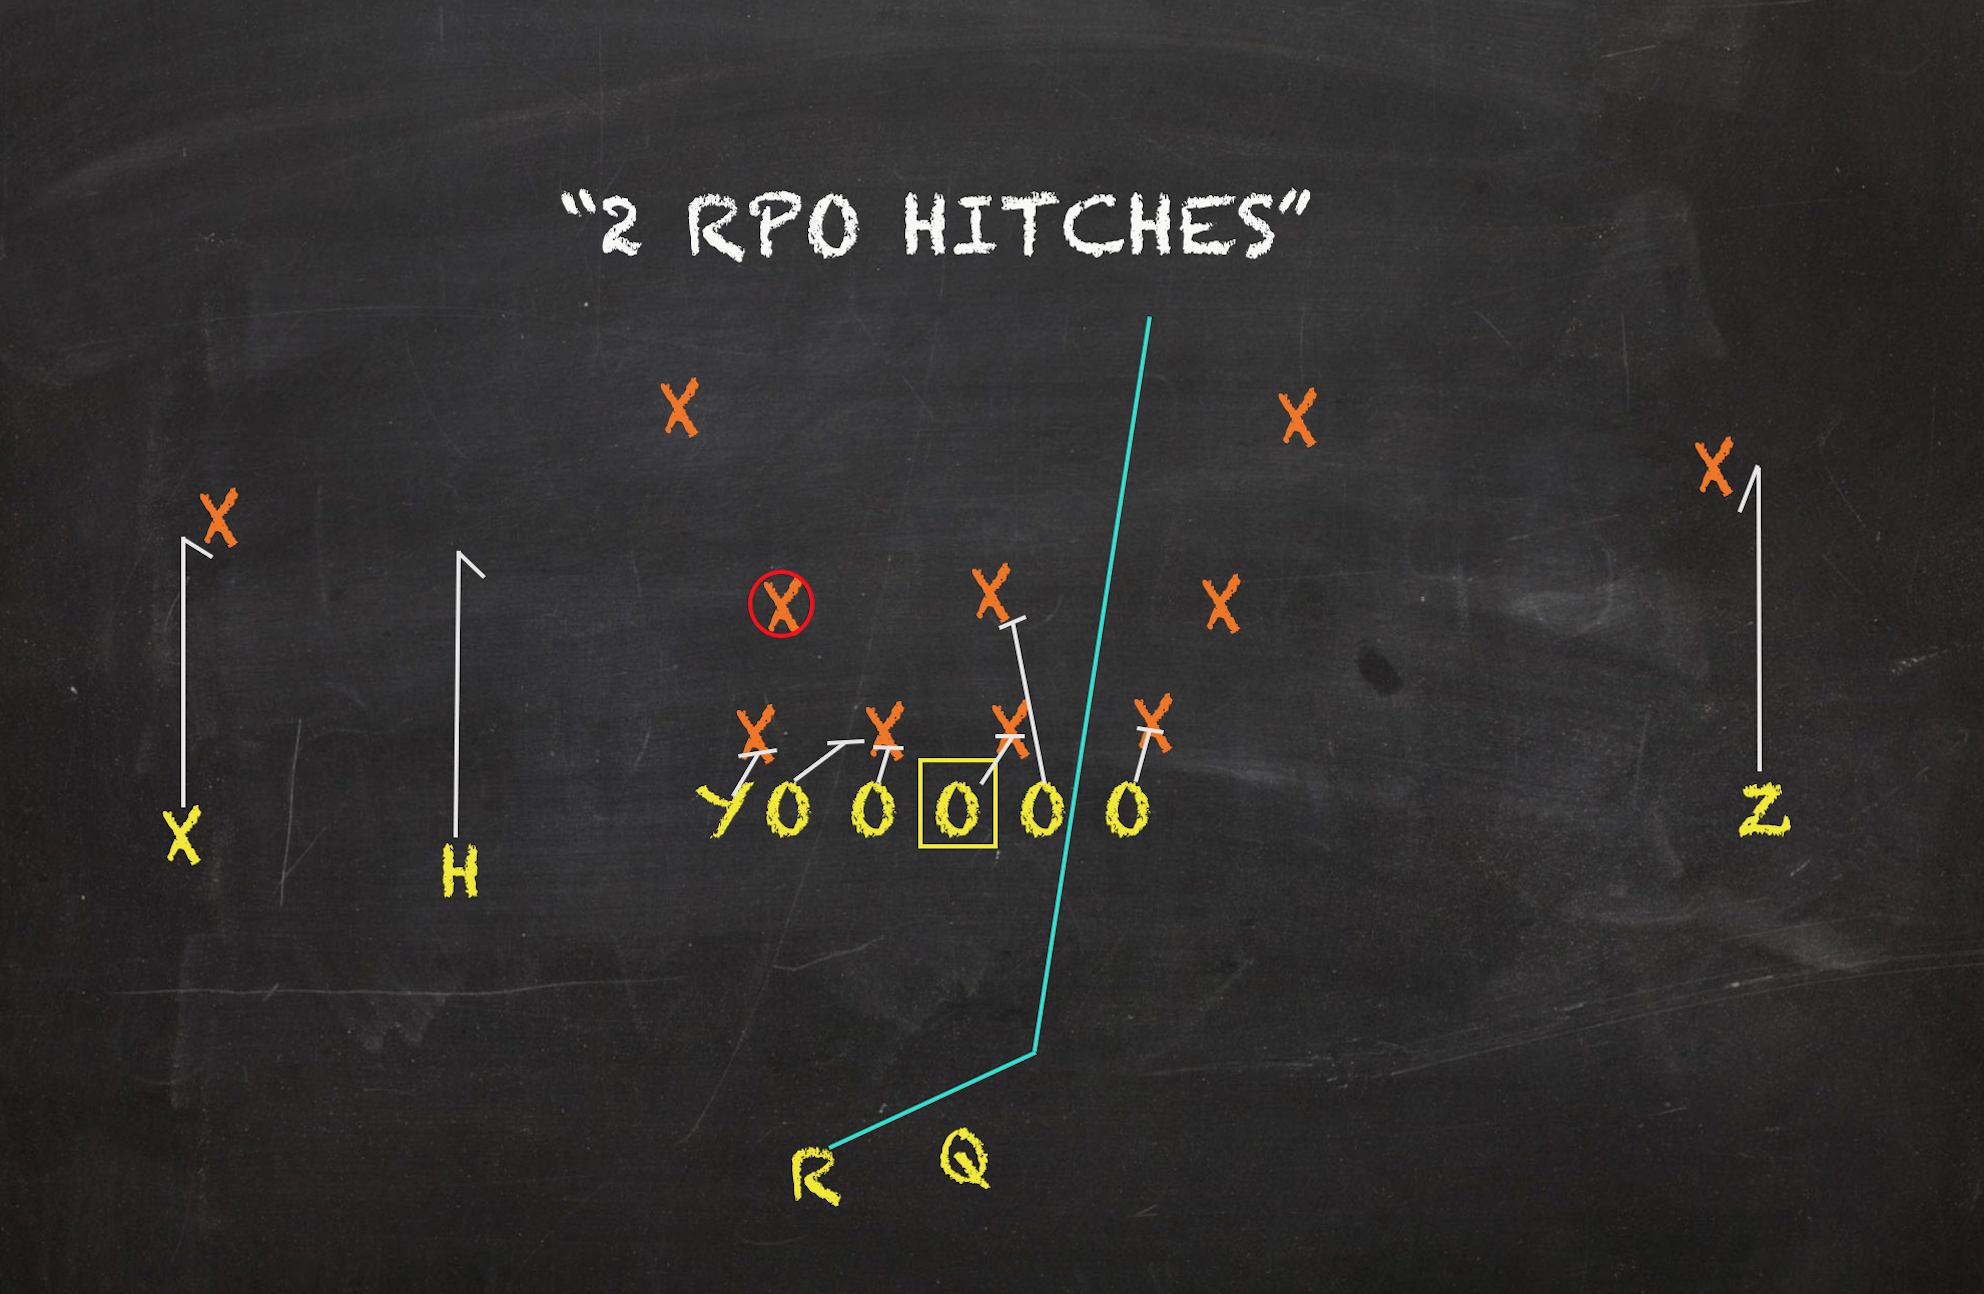
As the team’s most featured play, it makes sense the Slam Read would wind up as UT’s top yardage gainer. In fact, it tripled the next concept in line in output. In case I haven’t hammered this home enough: Chaney really liked this play to move the ball downfield. That said, that wasn’t the case in 2019. Year-over-year, this concept’s usage has basically doubled from 8.87% to 17.6% regardless of the scoreboard margin. In addition to shifting his offense’s focus from an Outside Zone to an Inside Zone Read, I already mentioned Chaney’s tweak in dedicating less plays to non-read Slams. Looking at the macro, the reason for the increase in reps is obvious. While Off-Tackles sported a 46.4% Success Rate in 2019, Slam Read only posted a 33.3% clip. When Off-Tackles soured, Tennessee called them less. The Slam Read became the focal point, and its execution happened to improve.
2. Checkdowns: 161 yards, 7.59 Y/A, 72.7% Success Rate
This is bit of a cop out, but I cannot ignore the total numbers this offense amassed checking the ball down to a back. With the overt verticality in the passing game, underneath completions frequently presented themselves. Eric Gray compiled three-fourths of Tennessee’s yards on these plays catching 15 of his 16 attempts (his lone incompletion was a drop). Though chickenshit football as far as I’m concerned, the results checkdowns begat speak for themselves. Despite the Vols’ receivers’ 1.77 average depth of target on these plays, they put up a 7.59 Yards/Target. Talk about a safety valve.
3. All Verts: 142 yards, 4.4 Y/A, 37.5% Success Rate
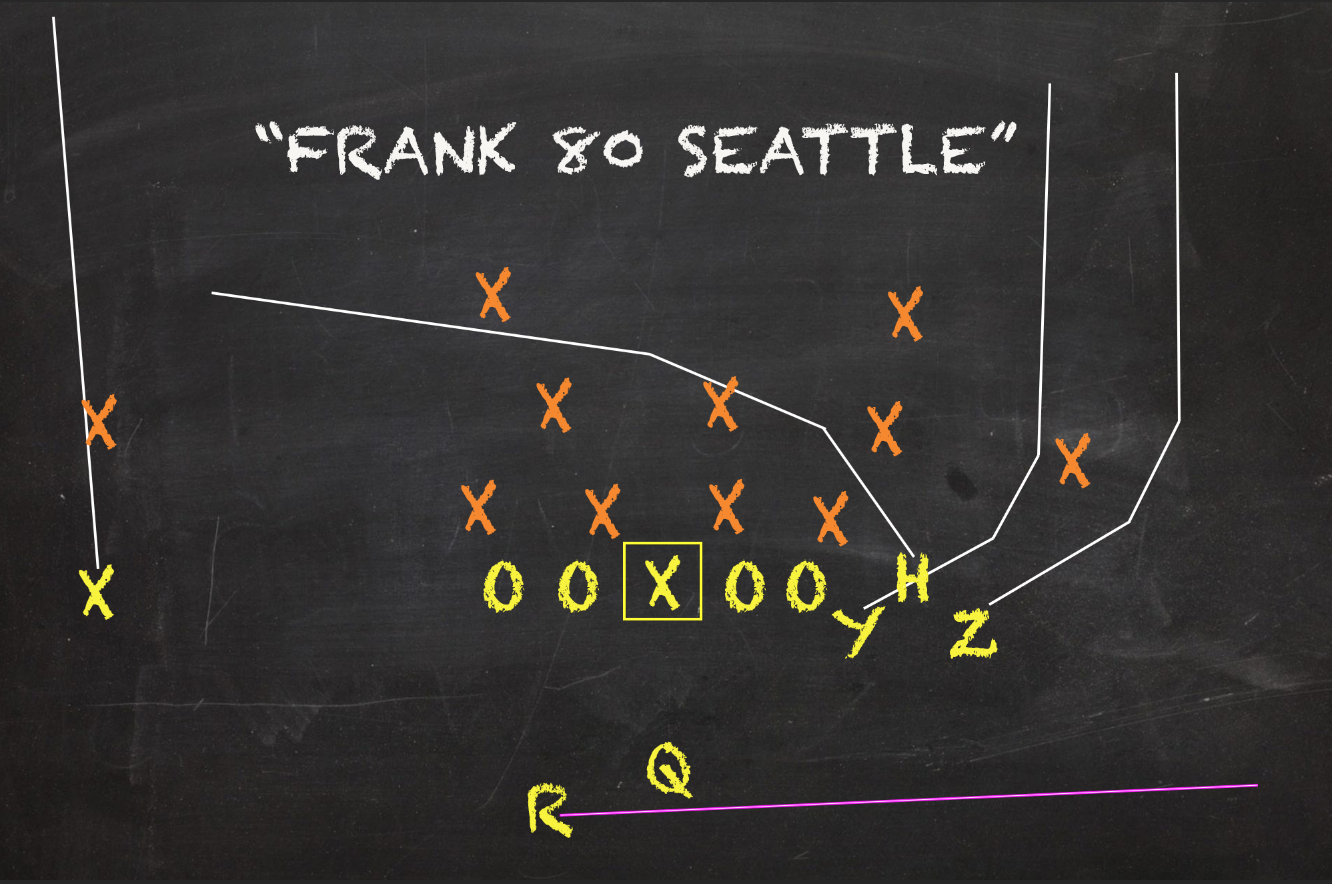
Thanks to the vertical nature of this concept, All Verts didn’t need too many plays to work in order to finish as one of the Vols’ top yardage gainers. And though their completions on this look were relatively mundane, Tennessee’s rate of success on All Verts was one of the better performances in the conference regardless of scoring margin. Granted, broken reps and sacks skewed a healthy portion of the play’s bottom line; but in comparison to other SEC offenses, the Vols beat out all but two conference offenses in Success Rate. Not too shabby considering the amount of reps they dedicated to this look. Still, the fruitful plays were far from electric. While their passers were able to scramble for okay gains on occasion, the only two passes that gained more than 20 yards were the only two completions beyond that depth. Overall, Tennessee’s passers combined for a 30.4% Completion% on All Verts this fall, which is very meh.
4. Sail: 139 yards, 8.69 Y/A, 50.0% Success Rate
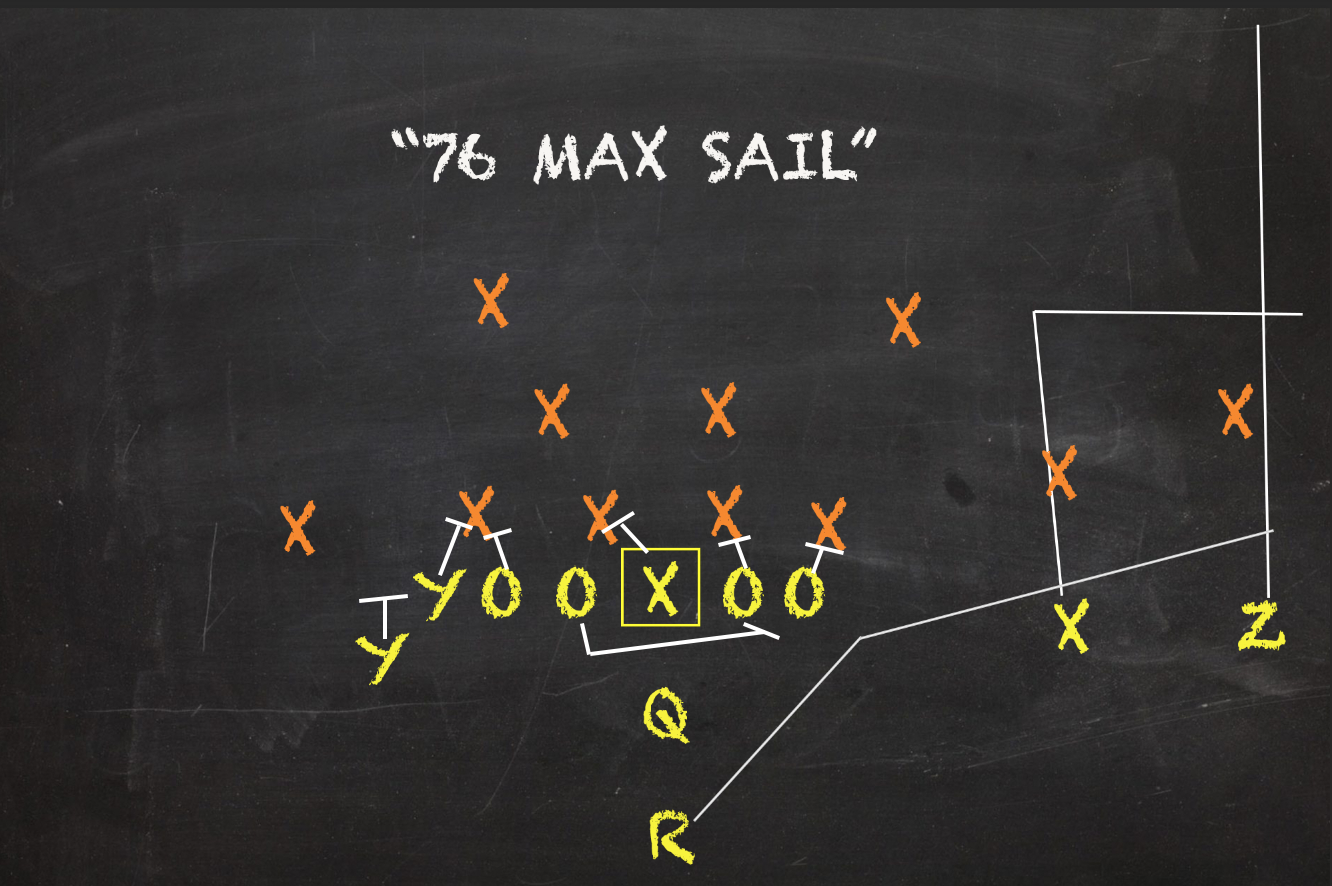
With half of its targets resulting in first downs while being among this offense’s most featured passes, Sail was a shoo-in to finish as one of Tennessee’s top yard gainers. But over a third of this concept’s total yards in our parameter took place on a single 46-yard completion in the last game of the season for the Vols. If not for that, our strongside flood wouldn’t be anywhere close to qualifying for this list. But because of JT Shrout’s gunslinger attitude and Cedrick Tillman’s athleticism, Sail was a mere four yards away from being the top producing pass concept for this offense during its meaningful minutes.
5. Outside Zone Off-Tackle: 125 yards, 3.68 Y/A, 32.4% Success Rate
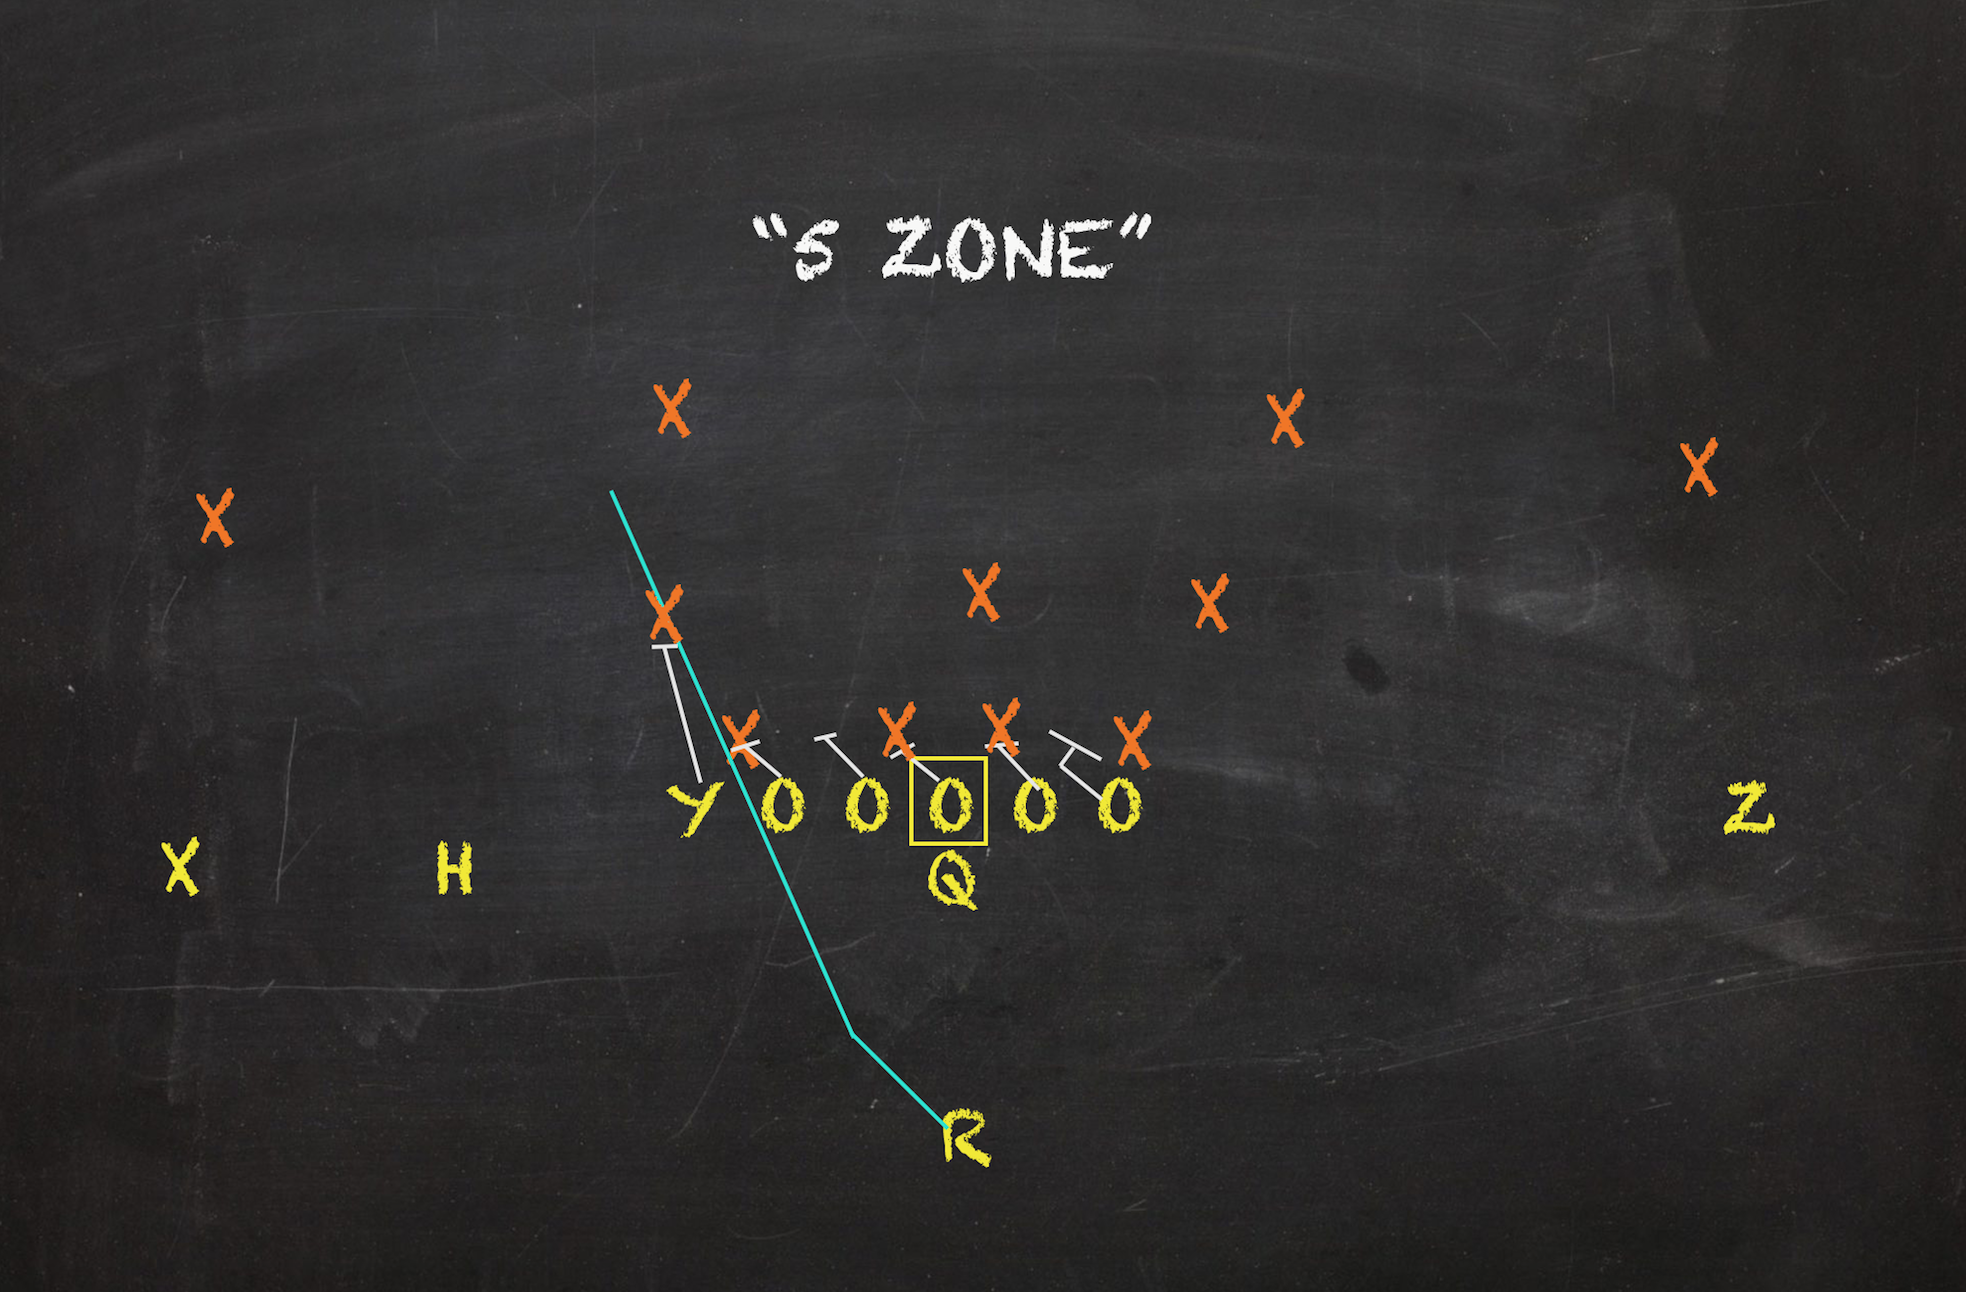
Thanks to repetition and a few splash plays, the Off-Tackle finished as one of this offense’s top yardage gainers. Again, it was predominantly a fruitless design for the Vols in 2020, but it still was one of their play caller’s go-tos to start a set of downs. When half of a concept’s explosive attempts come against a defense like Vanderbilt’s, it’s fair to question its overall effectiveness. At least, Chaney recognized in the off-season this look should probably be used more prudently based on his personnel. The Off-Tackle was better from two-tight end sets despite most of its tries taking place from 11. From those packages, the look put up a 5.36 Y/A and 45.5% Success Rate. Despite a third of the play’s reps coming from 12 personnel, roughly 47% of its yards came from such sets in our parameter.
6. Fades: 121 yards, 8.07 Y/A, 26.7% Success Rate
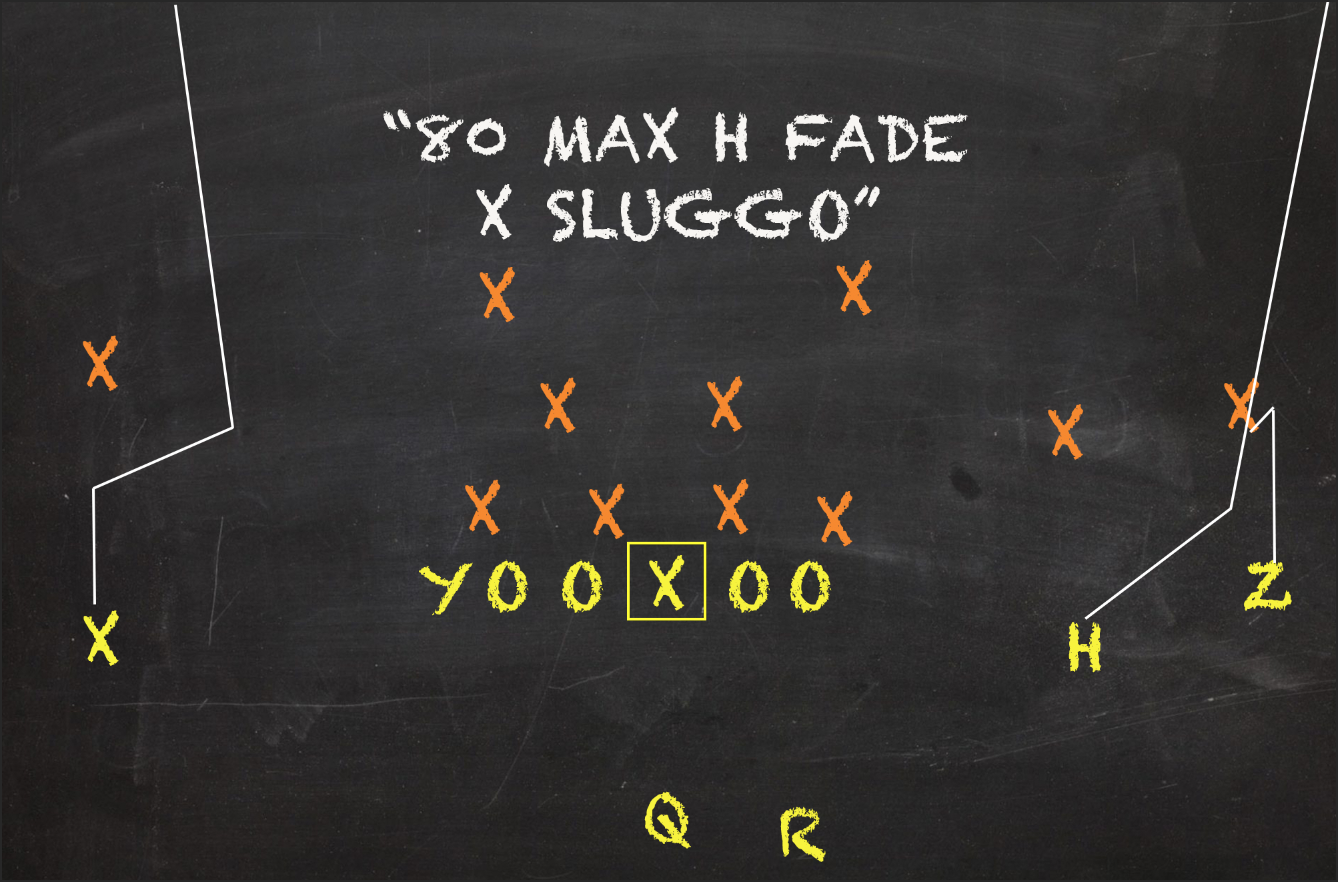
When all the subconcepts of Vertical Shots combine, only Inside Zone Slam Read compiled more yards for this offense in meaningful minutes. When broken out, Fades made up the plurality of the concept group’s yards with 121, which made it just good enough to close out the Vols’ top yardage gainers. Like All Verts, the deep nature of these patterns helped it shoot up the rankings. Though Fades’ Y/A was 8.07 in our parameter, its Yards/Completion was 30.3.
MOST SUCCESSFUL CONCEPTS
1. I-Formation Iso: 1.45% Play Share, 3.75 Y/A, 75.0% Success Rate
Tennessee barely featured this play in meaningful minutes. Over the ten games, Iso was only called eight times. All the ones in our parameter came in the first four games; half were logged in Week 2. But six of those eight tries took care of business. Highlighted by the run in the video above, this was mostly turned to in short yardage spots or on the goal line. Tennessee exclusively ran super fat sets in order to facilitate the face-smashing concept. But outside of the short game, this low-ceiling play received hardly any attention by this offense.
2. Checkdowns: 4.00% Play Share, 7.59 Y/A, 72.7% Success Rate
Tennessee’s offense was so maddeningly inconsistent that freakin’ checkdowns to backs provided the most dependable results in the passing game. In meaningful minutes, dumping it off in this manner boasted a higher Y/A that all but two of the Vols most featured pass concepts. In actuality, these various checkdowns have the needed play share to crack that threshold. But c’mon; I wasn’t about highlight them like that. This is more than enough love for this “concept”. Five of the 16 successful checkdowns in our parameter occurred in garbage time against Arkansas. So…. yeah.
3. Tosser: 2.73% Play Share, 5.53 Y/A, 53.3% Success Rate
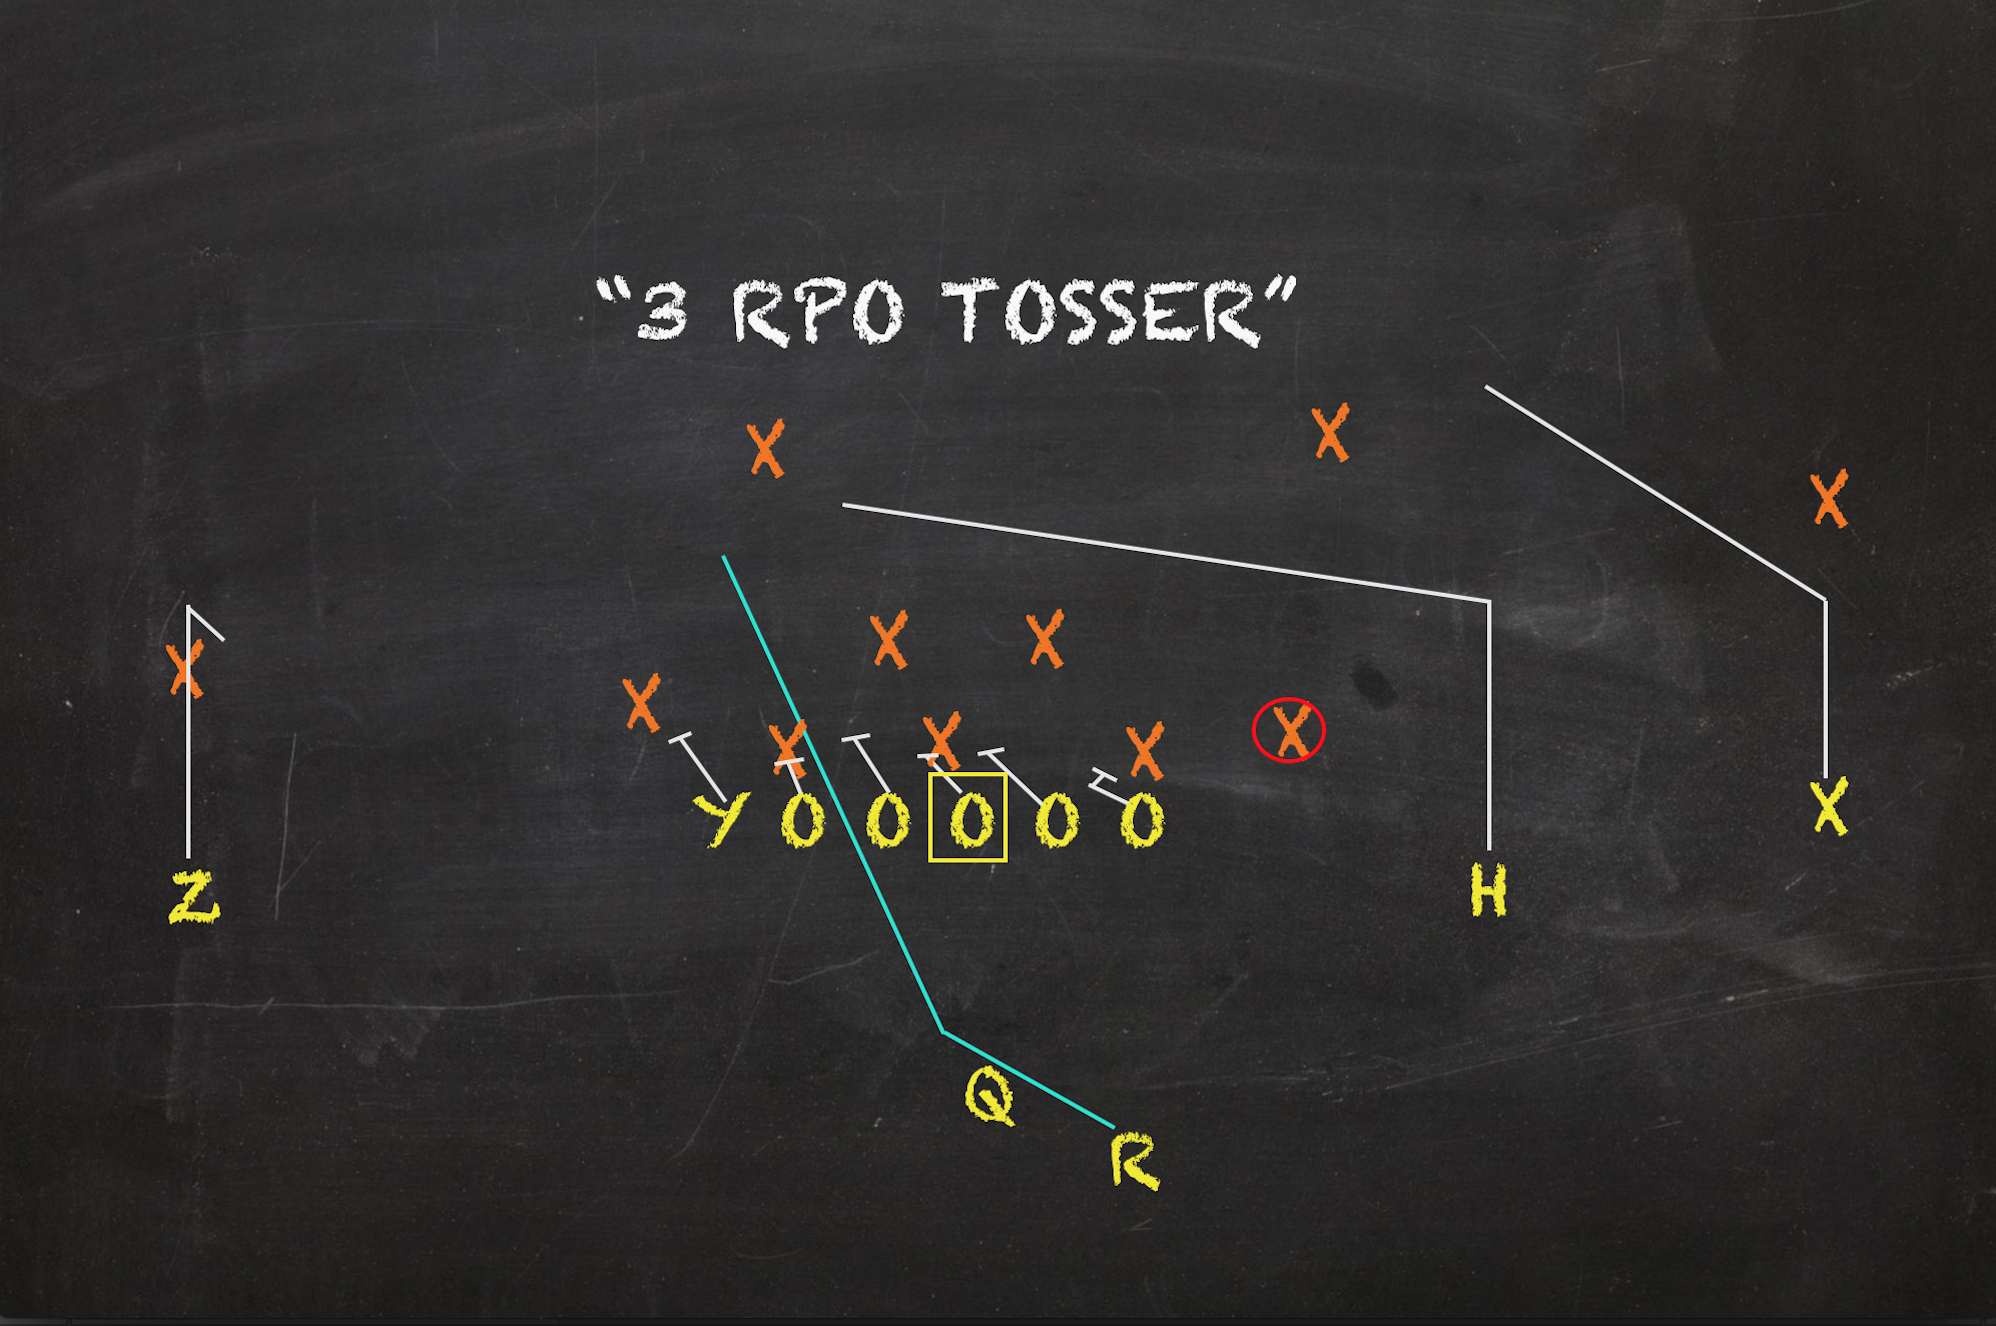
Slants are naturally man-beaters and relatively easy targets for passers. Sure, they are basic. But they are effective. Variations of them should almost always produce net positive results. Besides tagging Tosser on read options, a couple of standards rocked the double slant pattern. Along trailing the backside of a Spot concept, Tosser was seen opposite Tunnel Screens and from max protection with and without play action. Though it was one of the Vol’s most successful looks in 2019, it wasn’t among their most repped plays. With increased volume in 2020, its efficiency noticeably dipped. Tosser still put up sturdy figures but far from a 10.2 Y/A and 66.7% Success Rate.
4. Counter (Read): 4.00% Play Share, 6.18 Y/A, 50.0% Play Share
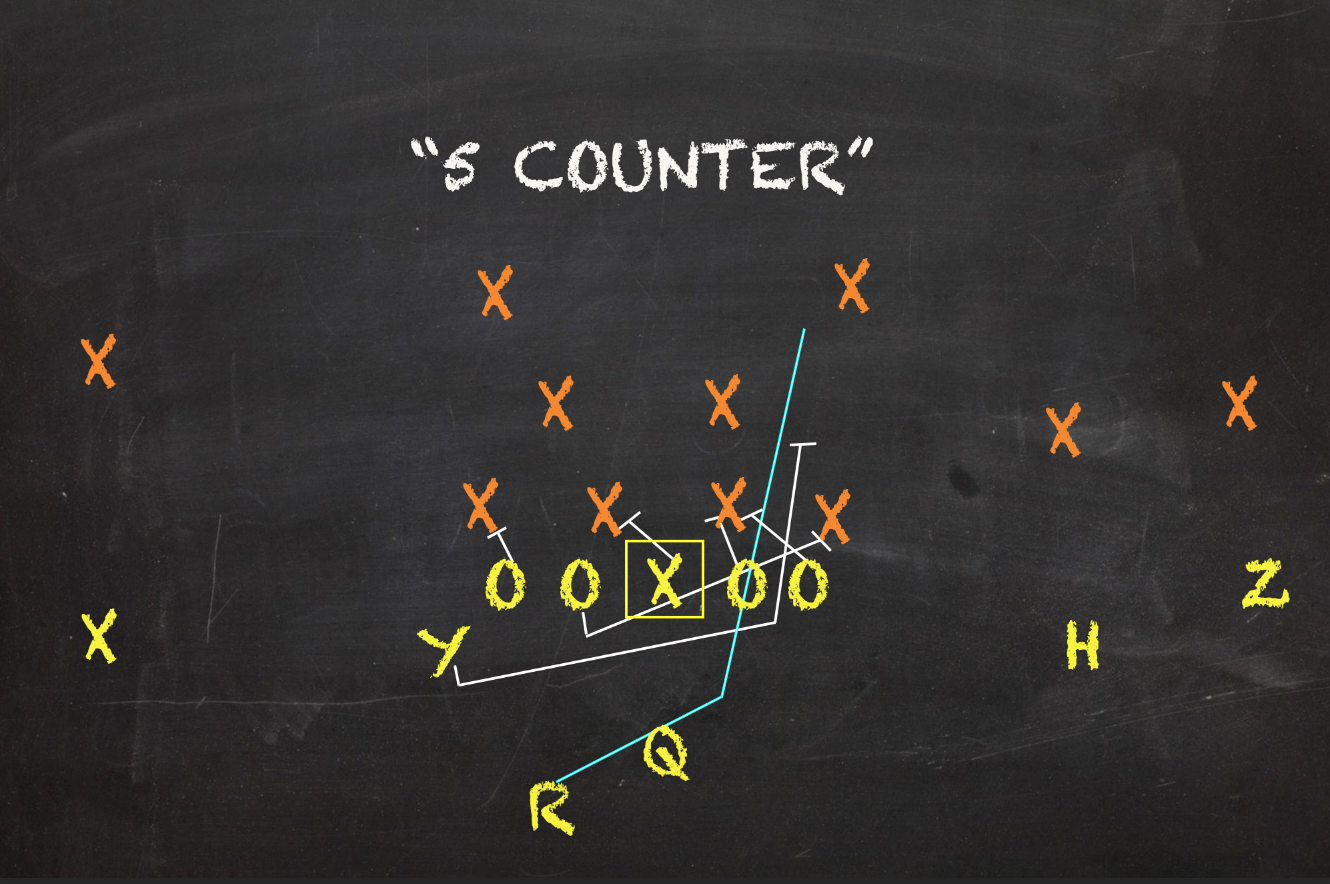
Despite the third snap of the season being a Counter, Tennessee would only feature two more traditional versions of the play until Week 9. From there, however, the look became a noticeable feature of this offense. Over the course of its final four games, Counter owned a 9% play share — good for the 3rd highest in that time frame — while both read and non-read renditions averaged at least 6.5 Y/A. Over 22% of Counters went for a gain of ten yards or more. The Vols’ script-leading Slam Read only outgained this power play by a single yard. Considering how crappy the majority of Tennessee’s ground game was for most of the year, it’s intriguing why this offense sat on this concept for so long. As Tennessee’s top-two ground looks failed to sport a 40% Success Rate on first downs, Counter produced a rather serviceable 46.2% clip.
5. Sail: 2.91% Play Share, 8.69 Y/A, 50.0% Success Rate
If Cedric Tillman’s homerun catch was responsible for Sail finishing among Tennessee’s top yardage gainers, then the offense’s execution of the strongside flood versus Auburn made it one of Big Orange’s most successful concepts. Across the five repped Sails on the Plains, the Vols averaged 10.2 Y/A with four first downs. In the context of our parameter, those completions accounted for half of the concept’s successful tries and about a third of its reps. Coming into that game, only two of the seven Sail plays met their situational goals — both of which occurred in Week 1 against South Carolina. And while a good amount of Tennessee’s other pass designs broke down or suffered from sacks/scrambles, only two reps of Sail were charted as such regardless of margin on the scoreboard.