
2020 Returner Spray Chart: Attempt Distribution
2020 Returner Spray Chart: Attempt Distribution
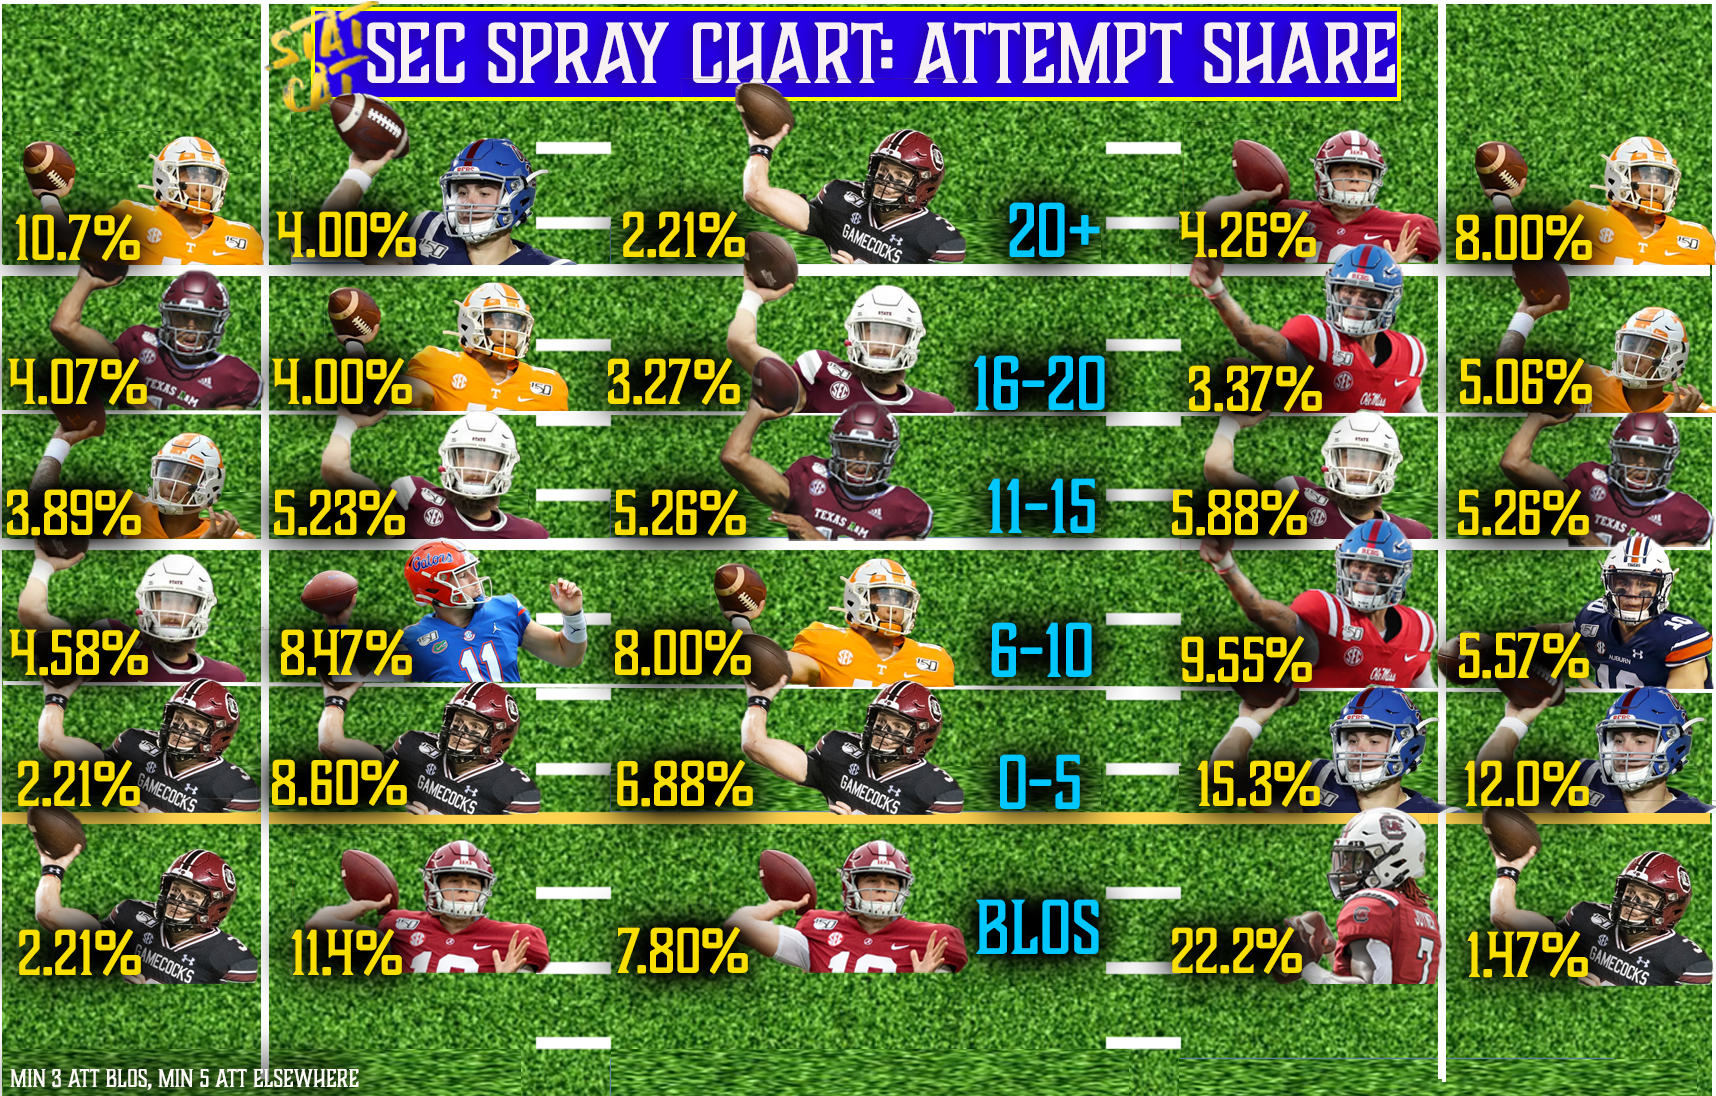
See which SEC passer returning for 2020 directed the highest percentage of their attempts to each of the 30 pass matrixes last season!
|
Usage |
Outside Numbers Left |
Between Numbers and Hashes Left |
Inside the Hashes |
Between Numbers and Hashes Right |
Outside Numbers Right |
|
20+ |
B. Maurer: 10.7% |
JR Plumlee: 4.00% |
R. Hilinski: 2.21% |
M. Jones: 4.26% |
B. Maurer: 8.00% |
|
16—20 |
K. Mond: 4.07% |
B. Maurer: 4.00% |
G. Shrader: 3.27% |
M. Corral: 3.37% |
Guarantano: 5.06% |
|
11—15 |
Guarantano: 3.89% |
G. Shrader: 5.23% |
K. Mond: 5.26% |
G. Shrader: 5.88% |
K. Mond: 5.26% |
|
6—10 |
G. Shrader: 4.58% |
K. Trask: 8.47% |
B. Maurer: 8.00% |
M. Corral: 9.55% |
B. Nix: 5.57% |
|
0—5 |
R. Hilinski: 2.21% |
R. Hilinski: 8.60% |
R. Hilinski: 6.88% |
JR Plumlee: 15.3% |
JR Plumlee: 12.0% |
|
BLOS |
R. Hilinski: 2.21% |
M. Jones: 11.4% |
M. Jones: 7.80% |
D. Joyner: 22.2% |
R. Hilinski: 1.47% |