Sideline to Sideline: Vanderbilt 2019
Vanderbilt at a glance
Vanderbilt is the hardest job in the SEC. So, it's a damn good thing the powers-at-be have tempered expectations around their football program. Unable to keep up with the incessant arms race within the SEC or lax their academic standards, the Commodores often have to operate with a stacked deck. Sustained success in Nashville is simply hard to come by. Despite two bowl births as head coach, Derek Mason's career winning percentage entering this season was a appalling 38.7%. But despite the few signs of growth, the brass stuck by Mason as the team was poised to take its next step following its most recent bowl trip.
Kyle Shurmur had been this offense's rudder. Though his physical traits would never blow you away, he was a sound decision maker and on-field leader. His production was average, but he often acted as the glue that kept Vandy's hodgepodge weaponry on the same page. Alpha receiver Kalija Lipscomb would need to get the ball in various ways to keep defenses off his scent, tight end Jared Pinkney operated as both an underneath safety valve and big body receiver beyond ten yards downfield, and Keshawn Vaughn was the sprite, big play runner on the ground. Shurmur was the distributer, the conductor, and the big toe of Vandy's offense for four seasons. Upon his graduation, the little things that Shurmur helped hold together would soon fall through the cracks, and the remaining threats on this offense simply would fail to match their past effectiveness.
Ball State transfer Riley Neal was never built to perform well in a pro style scheme. With Shurmur in there, Vandy's attack was rather rigid but still found ways to make it all work. Neal required an open gameplan with plenty of spread elements that could maximize his athleticism in space. Though the 'Dores kept some elements of their past offense, they obliged to go all in with Neal's preferred way of playing. This meant more read and Run-Pass Options. In 2018, LSU was the only SEC offense that had a lower RPO Rate than the 'Dores' 10.6% clip. Texas A&M's Kellen Mond was the only SEC passer with a lower RPO Throw Rate than Shurmur's 7.34%. Vandy saw read options make up less than 13% of their plays two years ago. This season, the 'Dores remained below the SEC average in terms of RPO usage, but their clip more than doubled year-over-year to 21.6%. On average, about one out of seven of Neal's pass attempts were off an RPO and his rate was the SEC's sixth highest clip.
Though calling more RPOs helped Vandy win some spot battles, this past offensive season was an absolute failure. Between them and Arkansas, it often came down to splitting hairs on who was the worst unit in the conference. Looking at ESPN's SP+ metric, Vandy's offense just edged out the Razorbacks in the final ratings (104 to 105) as the two had similar overall ratings as well. As far as down-to-down Success Rate and yards/play are concerned, their 34.4% and 4.80 clips, respectively, were the worst the SEC had to offer. But, Vandy's shortcomings extended beyond consistency. Vandy also owed the worst Touchdown Rate (2.84%), Havoc Rate Allowed (29.3%), Three-and-Out Rate (33.8%), points/game (16.5), yards/game (296.4), and Sack Rate (3.91%). Plus, they owned the second worst Explosive Play Rate (9.18%), third worst Broken Play Rate (9.31%), and fourth worst Pressure Rate (33.6%) within the conference. Captain Obvious wanted me to point out this is not preferable production.
Vandy ended the year with the fifth highest Pass Rate in the conference; but that was more out of necessity constantly playing with a scoring deficit and behind the chains. Still, no SEC team had a more "balanced" 1st Down Pass Rate than Vandy's 50% clip, which translated to the fourth highest rate in those spots within the conference. Before you get the idea the 'Dores aimed to dropback and sling it, their two most targeted pass patterns on 1st Downs were Outlet Screens -- most of which were off RPOs -- and True Screens. With Neal's subpar downfield accuracy and limited receiving corps, manufacturing yards after the catch designs were vital to get any bit of production out of this passing game. But with the aforementioned ineptitude, the 'Dores were faced with plenty of 3rd and longs. Only Mississippi State averaged more yards to gain on the money down than Vandy's 7.81, but no SEC offense commanded a higher 3rd Down Pass Rate than Vandy's 81% clip.
It's not much of a secret that passing the ball is a more consistent and effective way to move the ball. While the 'Dores tried to lean into this philosophy passing more hoping it would be more worthwhile than turning to the ground, Vandy was one of the rare exceptions that should have dedicated more plays to running the rock. Though passes averaged 0.03 more yards per play than runs, throwing the ball proved to be much more volatile. As far as Success Rate is concerned, the 'Dores were only slightly below average on the ground with a 42.9% clip. Vandy's Passing Success Rate, however, was on its own level of suckdom. No other offense had a clip below 33.9%; yet, the 'Dores sported a 28.2% rate. Less than 5% of Vandy's pass attempts netted 20 or more yards and less than 10% gained 15 or more.
With more short screens and RPO outlets littering their script, chunk gains through the air rarely materialized unless a Commodore receiver went above and beyond winning a contested downfield pass or being exceptional after the catch. No SEC passer averaged a lower average depth of target within the SEC than Neal's 6.68 clip, and Vanderbilt's YAC average of 3.08 yards was well below the SEC average. Though it might seem common sense, the average SEC quarterback saw about half of his yards come from gains after the catch this past season. Neal's YAC percentage of 63.8% was the highest, and his 8.31% Deep Throw Rate was the lowest in the SEC. Though this conservative approach helped limit the 'Dores' Turnover Rate to one of the five best in the conference, it sabotaged their chances orchestrating field flipping plays through the air.
Multi-tight end sets have been a feature of Vanderbilt's offense the past few seasons. Within the pro style mentality, these sets provided more braun and forced opponents to stick more in base defenses. Even with more spread elements implemented this season, Vanderbilt operated from a set with two or more TEs on nearly 30% of their plays. Only Alabama and Tennessee's affinity for these formations were greater than the 'Dores'. The usage of more tight ends was justified. Though Vandy remained below average with a 42.1% Success Rate, these sets yielded improvements in a number of areas. Outside of seeing their down-to-down success tick up nearly 8 percentage points, the 'Dores' Explosive Play Rate (9.18% to 14.4%), yards/play (4.80 to 5.57), and Havoc Rate Allowed (29.3% to 27.7%) all improved out of multi-tight end sets. Vandy ran the ball nearly 70% of the time from these formations, but both its Rushing and Passing Success Rates were preferable compared to its overall clips.
I already mentioned how this offense increased its RPO usage year over year in order to maximize Neal's strengths. Since he was a shaky dropback passer and appeared more comfortably acting as a spread-run distributor, giving Neal predefined routes towards tender spots of the field did him good. Since RPOs naturally aim to attack numbers mismatches, RPO throws generally help pad passing numbers. If a team's receivers outman DBs three to two on the perimeter, they have favorable numbers and should be able to win more times than not. But if that scenario was reversed, it wouldn't make much sense to target an outlet who had no chance to succeed situationally. Since these throws were mostly outlet screens or isolated curls, the 'Dores averaged less per pass attempt on RPOs than other throws. But their 4.61 clip with and 4.67 clip without are basically the same. Despite similar yardage outputs, RPO Throws saw a 47.1% Success Rate compared to a dreadful 25.6% clip on non-RPO attempts.
Vanderbilt saw a stark difference in its rush and pass outputs on RPO designs. About 35% of the 'Dores ground attempts were off RPO designs. Though they helped Vandy's passers be more consistent, the extra layer hurt their rushers. The route tags helped spur a some big gainers with safeties occupied by the threat of a pass, but Vandy more or less averaged about the same per run whether the play was an RPO or not. RPO runs averaged 5.18 yards/play compared to 4.90 on traditional runs. The big knock was the decline in their Rushing Success Rate, which dipped from 47.2% on non-RPOs to 36.1% on RPO runs. Choosing whether to help their passers with predefined outlets or go about more of a no-nonsense running mentality greatly hindered this offense. Failing to find the right combination birthed the worst offense in the SEC this past season.
Despite Mason being a defensive-minded head coach, his side of the ball was just as bad as the offense. In the eyes of ESPN's SP+ metric, no SEC unit ranked lower than Vanderbilt. Despite having more than five years to recruit and mold his defense to his likings, the 'Dores SP+ ranking at 99 was the worst since Mason was hired. The players he inherited from James Franklin rooted his best units. From 2014-16, Vandy sported the 57th, 16th, and 48th best defensive units in college football, respectively. From 2017-2019, last year's squad was the only one in that span to crack the top60.
You name the defensive stat and the 'Dores were at or near the bottom. Against conference competition, Vanderbilt sported a bottom3 Defensive Success Rate (48.1%), yards/play allowed (7.13), Touchdown Rate allowed (6.68%), Scoring Drive Rate (41.9%), Havoc Rate (15.0%), Sack Rate (4.35%), and average rush yards before contact (2.76). In SEC play, no one owned a worse Explosive Play Rate allowed (16.1%), Rushing Success Rate (48.8%), yards/carry (6.91), Three-and-Out Rate forced (25.6%), Early Down Conversion Rate (76.9%), or Red Zone Drive Rate (43.0%). With an average starting field postion at midfield, Vandy's defense was used to playing with its back against the wall. Since their Takeaway Rate was rate at the SEC average, opponents worked the 'Dores situationally and through explosive gains. Since their Havoc and Sack Rates were putrid, offenses kicked ass so long they weren't their own worst enemy.
Since defense was Mason's expertise, it's fair to ask how he let his side of the ball regress so badly. Doing what he does best, Mason threw his playcallers under the bus to save him some time. With his three best offensive playmakers taking their talents to the pros and plenty of young question marks on this roster, it will be a very hard ask to expect much improvement from the Commodores in 2020. Despite both sides of the ball having elements that could have sparked some success, 2019 was a downright flop. Yet, the Vanderbilt brass is sticking by their guy despite him lacking a single winning season in six tries. Though Vandy is a very hard place to sustain glory, anchoring the program to Mason might cause many to abandon ship.
Vanderbilt's most successful run looks
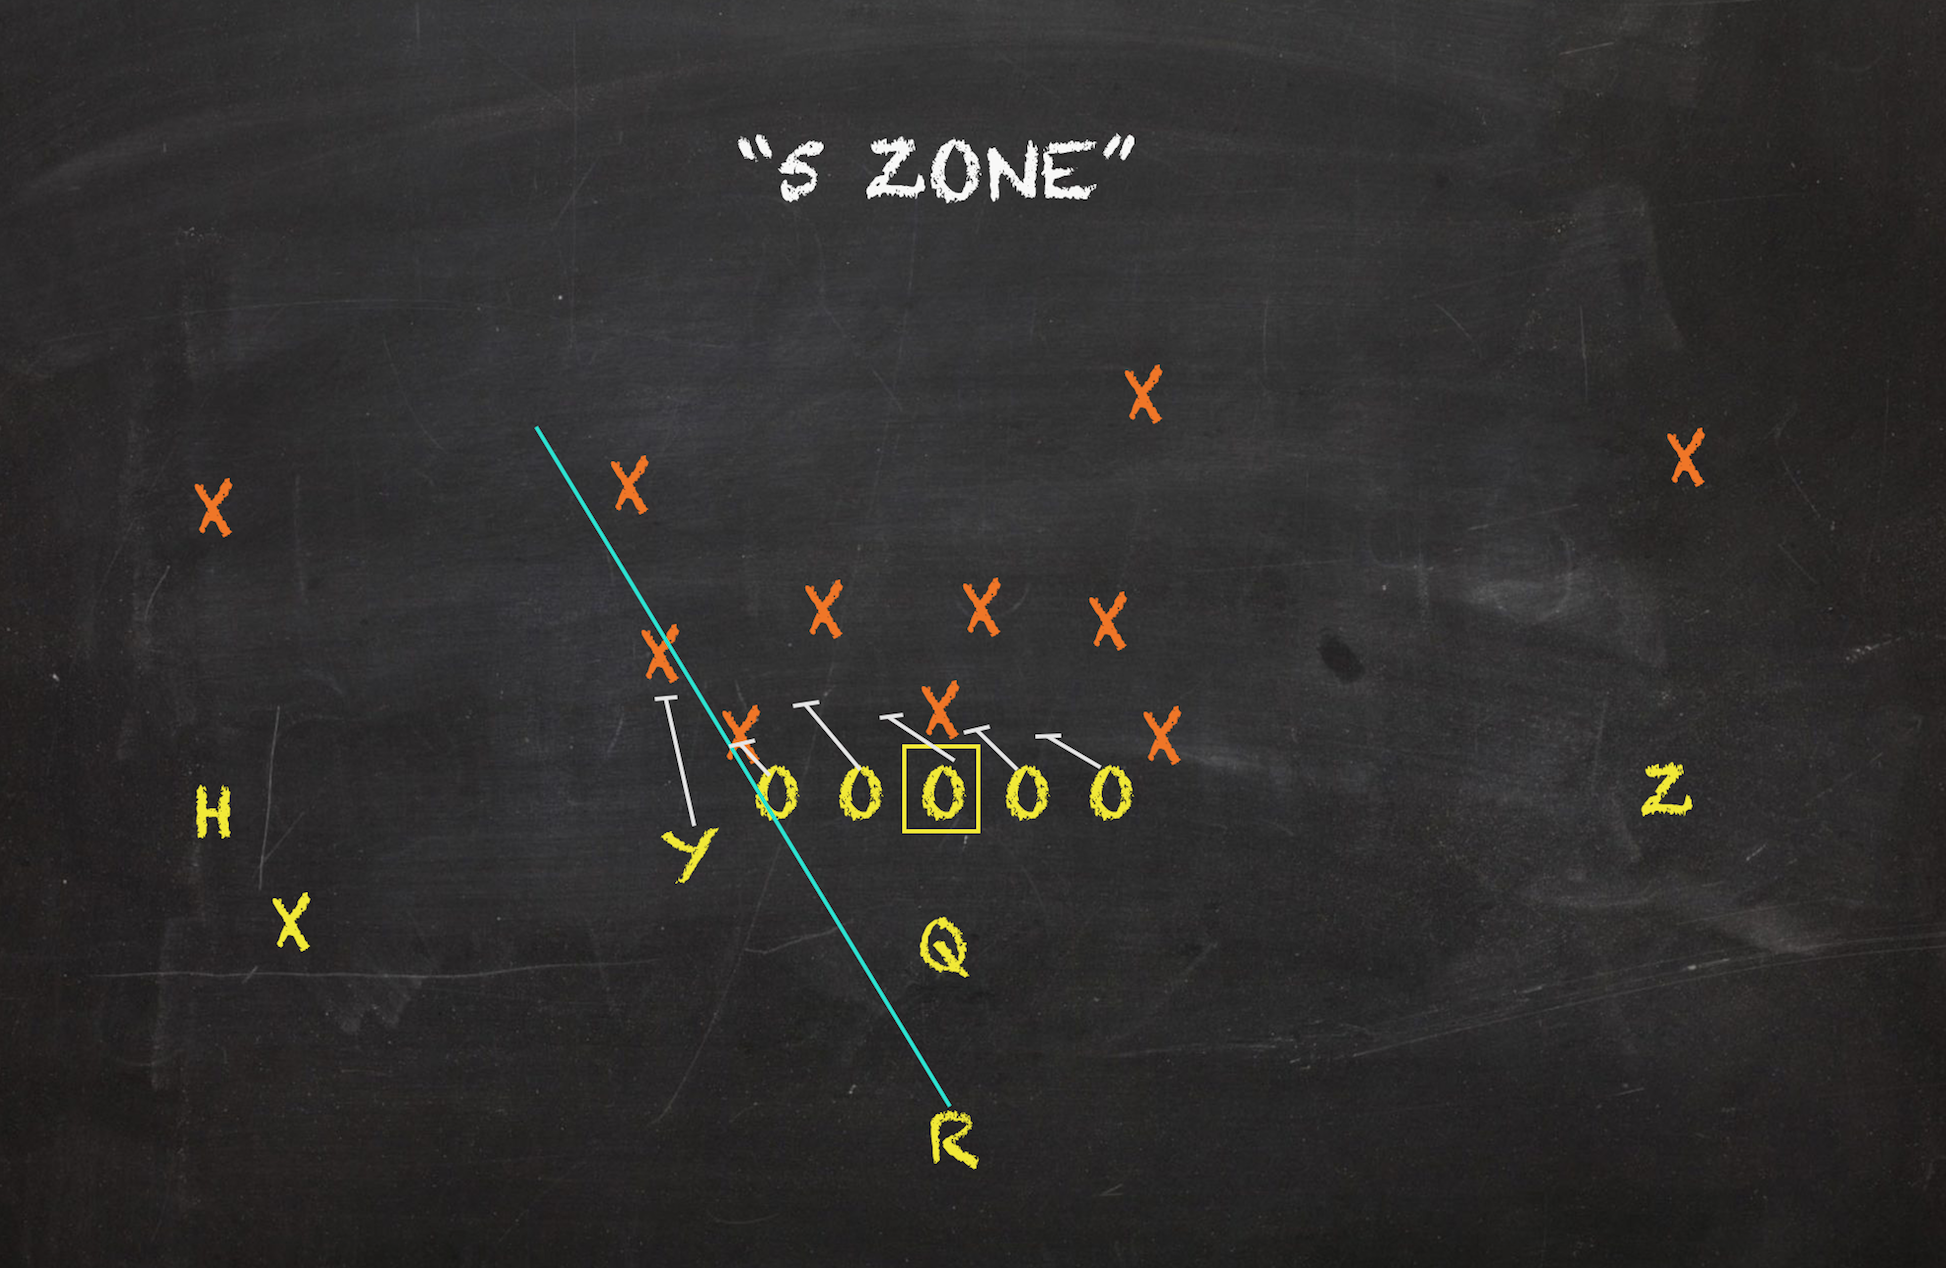
1. Inside Zone Slam Read 14.6% Play Share 4.92 Y/A 37.0% Success Rate
Vandy's favorite concept this past season is a common look in today's game. The Inside Zone Slam Read allows offenses with less size or burst win small battles against opponents with a talent advantage. While gap schemes set to create hard edged run alleys, zones create holes based on how the defense reacts to their coordinated flow post-snap. Reading a backside key defender -- usually the end man on the line of scrimmage -- dictates whether the QB keeps the ball or hands it off the the back. Tagging routes on top of this read option further creates strain for defenses. RPOs with outlet screens, fades, slants, curls, or various other two-man or isolated routes kept defenses from honing in on stuffing this easily diagnosable zone read. Over three-fourth's of Vandy's Slam Reads were RPOs. Vandy saw a slight uptick in output when route tags were attached. On such attempts, the 'Dores posted a 39% Success Rate on a 5.56 yards/carry average.
The Slam Read was overly an early down play for this offense. Of its 108 reps, 101 took place on either 1st or 2nd Down. Only one of its tries on the money down resulted in a conversion. But since it was overwhelmingly the 'Dores' favorite play to start a set of downs, sporting a 31.7% Success Rate in those spots meant Vandy frequently faced second and long. The volume Slam Reads received allowed the look to finish as Vandy's top yardage gainer with 538 -- over 200 yards than the next closest play. From the gun, this look allowed their passers opportunities to steal yards in the run game when prudent. But looking at all Inside Zone Reads, Vandy QBs only kept the ball on less than 14% of the play's run reps with a 40% Success Rate.
2. Outside Zone Off-Tackle 6.21% Play Share 6.43 Y/A 43.5% Success Rate
Keyshawn Vaughn's burst around the edge made Outside Zone Off-Tackles one of Vanderbilt's most explosive plays. With a passing game that failed to get off the ground more often than not, Off-Tackles were their best bet to hit a home run with their rushing attack. Despite being hit behind the line of scrimmage on about a fourth of his Outside Zone attempts, Vaughn boasted a 56.8% Success Rate with 18.2% of these runs going for ten yards or more. By Vandy's standards, this play was about average in terms of Success Rate. Behind Inside Zone Slam Reads, Off-Tackles were Vandy's most featured 1st Down concepts. Roughly 70% of this look's reps occurred on firsts. Like Slam Reads, Off-Tackles were very limited on 3rd Downs. By our charting, the 'Dores only ran one Off-Tackle on the money down.
With most of their early down calls going inside, Vandy was able to gain an extra step towards the perimeter when defenses eyed between the tackles. With Vaughn's big play ability, sometimes that's all it took. But with such a disadvantaged OLine relative to fronts in this conference, this design allowed for a more slashing run play. Instead of aiming to drive defenders straight off the ball or forge a hard-edged run run, Off-Tackles call for lineman to quickly seal the most defenders towards the most adjacent playside hole. This naturally makes the zone flow more flat and down the line of scrimmage than on Slams. From undercenter or out of the pistol, Off-Tackles were far more consistent and productive than their read counterparts. Off-Tackles racked up 296 yards, which was the second most of any look for this offense.
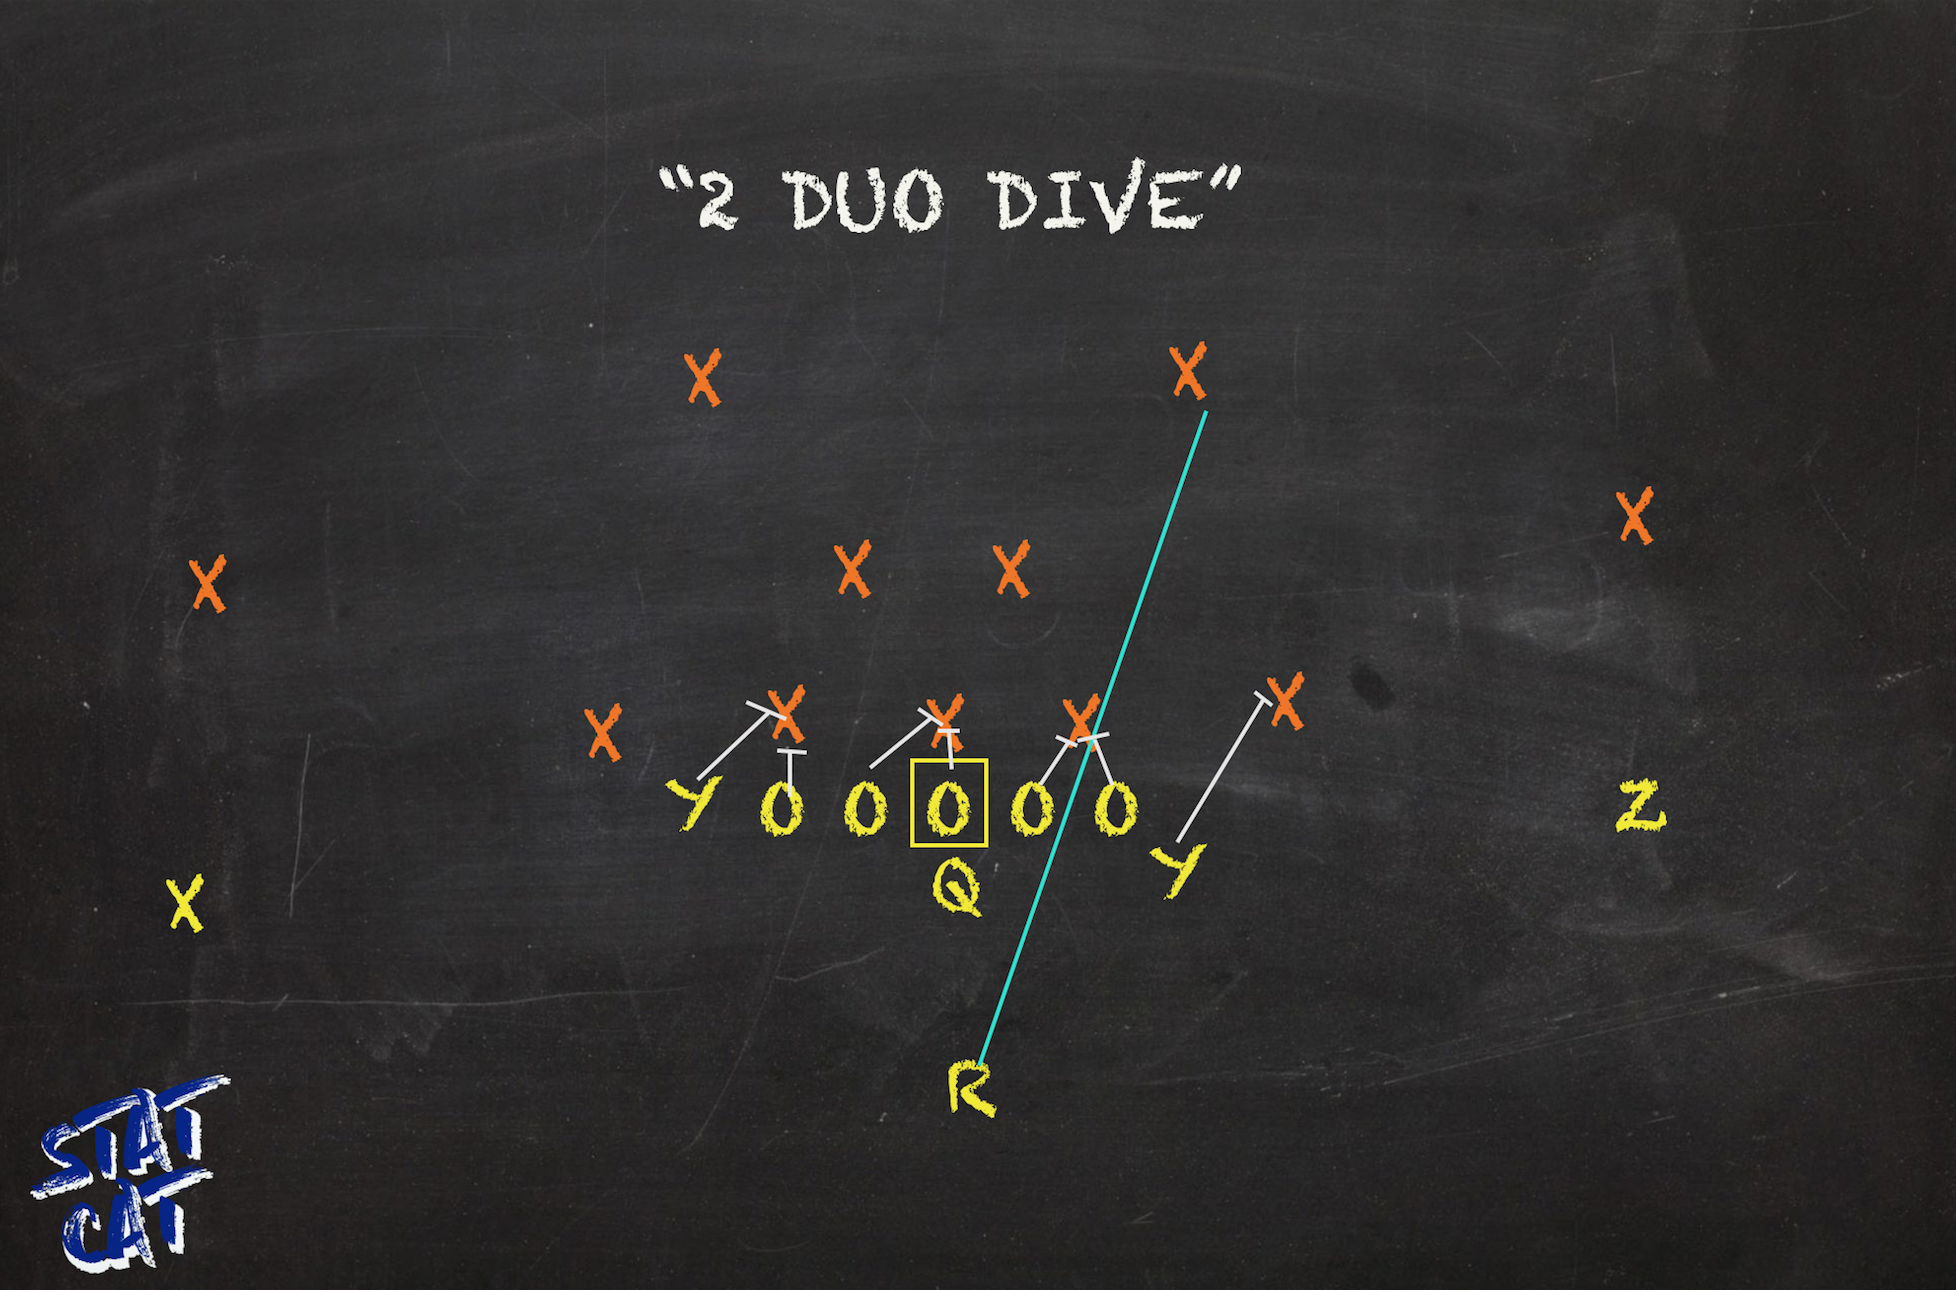
3. Duo Dive 5.26% Play Share 4.67 Y/A 51.6% Success Rate
The Duo Dive was Vandy's favorite power play. Duos are gap plays without pullers or lead blockers. They get their name due to the fact the design aims to create as many play side double teams as possible. Plenty of SEC offenses pair the Duo Dive with Inside Zone Slams since both initially aim to attack the same gap. The two are obviously blocked differently since one is a zone and one is a power play. These slight variation can keep defenders off balanced when trying to diagnose a play. Dives often are quick hitters between the tackles with the lineman mostly taking care of the most immediate threat. Unless a backer is walked up in a gap, they are largely left alone on this concept. As you might suspect, Duo Dives don't go for a lot of chunk gains. Despite averaging less than five yards/carry, the Duo Dive finished among this offense's five most successful looks.
Vandy repped Dives the most on 1st Downs, but that's where the look posted its worst output. The look's Success Rate was above average by Vandy's standards, but a 45.8% clip is rather ordinary at the end of the day. On the 15 combined 2nd and 3rd Down reps Dives received, nine resulted in success. The majority of Duo Dive occurred out of multi-tight end sets. With more braun near the point of attack, Vanderbilt saw more production on Dives. From 12 and 13 personnel packages, the 'Dores sported a 53.7% Success Rate and 4.86 yards/carry average. Again, this play isn't meant to bust a big gain; but rather to consistently gain four to six yards in a cloud of dust and wear down the interior of fronts with double teams.
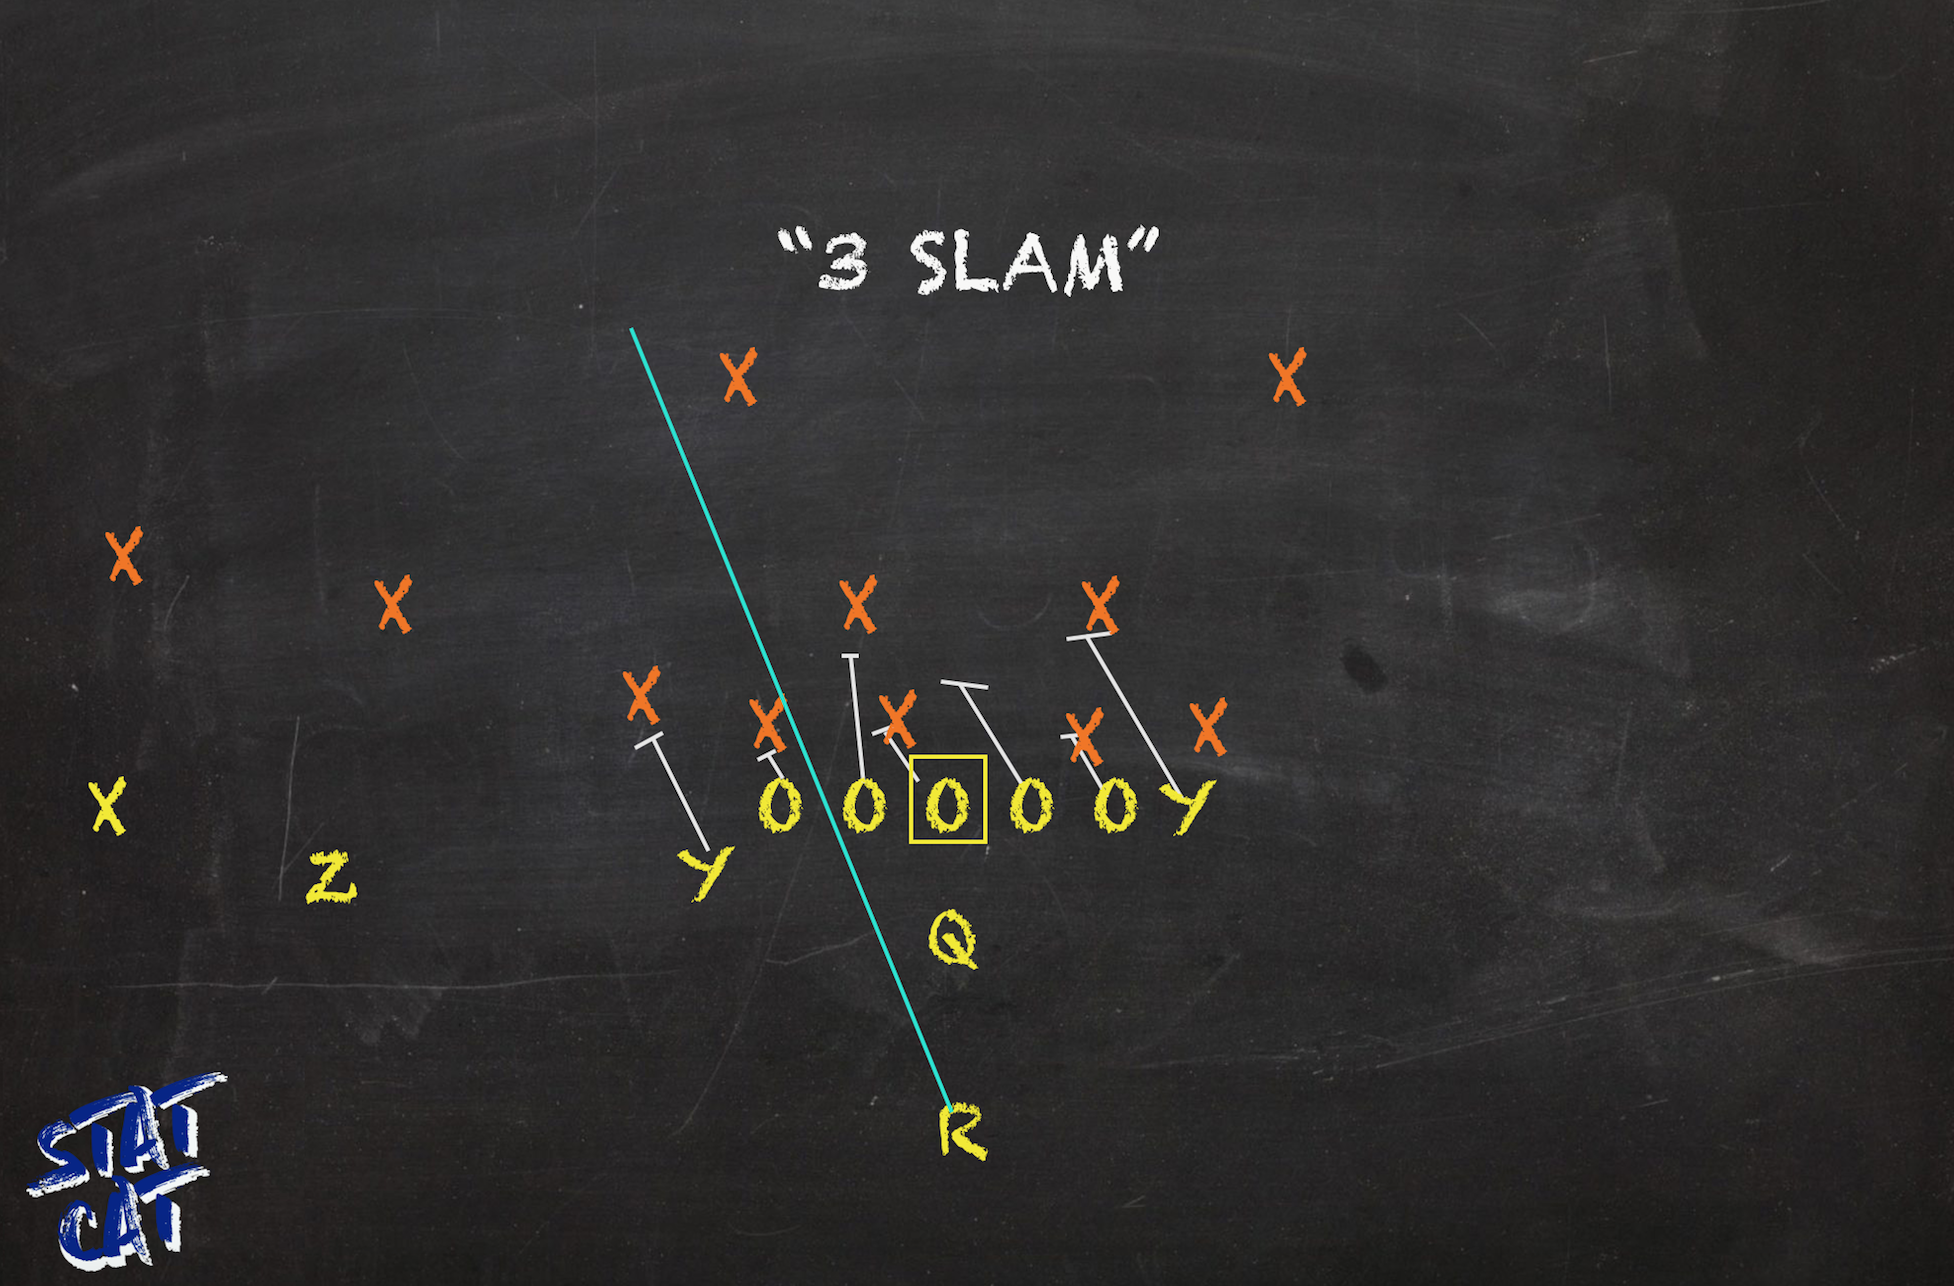
4. Inside Zone Slam 2.43% Play Share 5.28 Y/A 33.3% Success Rate
Vanderbilt sprinkled in a non-read Inside Zone Slam every so often from out of the pistol or from undercenter. That dynamic allowed a cloak and dagger approach due to the look's aforementioned compliment to Duo Dives. While lineman block against the grain or double team at the point of attack on Dives, Slams call for a coordinated flow towards the playside. Like Dives, non-read Slams predominantly were executed from multi-tight end sets. But while Dives' Success Rate enhanced from those personnel packages, Slams were only successful on a pathetic 28.6% of its tries.
With less avenues to threaten the defense and a undersized line, Slams overly failed. While the read rendition of Slams provided chances for Vandy's QBs to hit the backside or flip it to an outlet in space, there was no such safety valve on this design. Even though they averaged more yards/carry than Dives, Slams only saw success on about a third of its tries. With the lack of sustained success, this look wasn't featured too much. Despite being a top5 rush concept by volume, the 'Dores only averaged calling about one or two per game. Two-thirds of Slams occurred on 1st Downs. Though that down saw the look's yards/carry perk up to 6.33, still only a third of its reps met or exceeded situational goals. In general, non-read Inside Zones were a dreadful concept group for this offense. Vandy only averaged 0.84 yards before contact on Slams and Split Zones as nearly a fifth ended in a tackle for a loss.
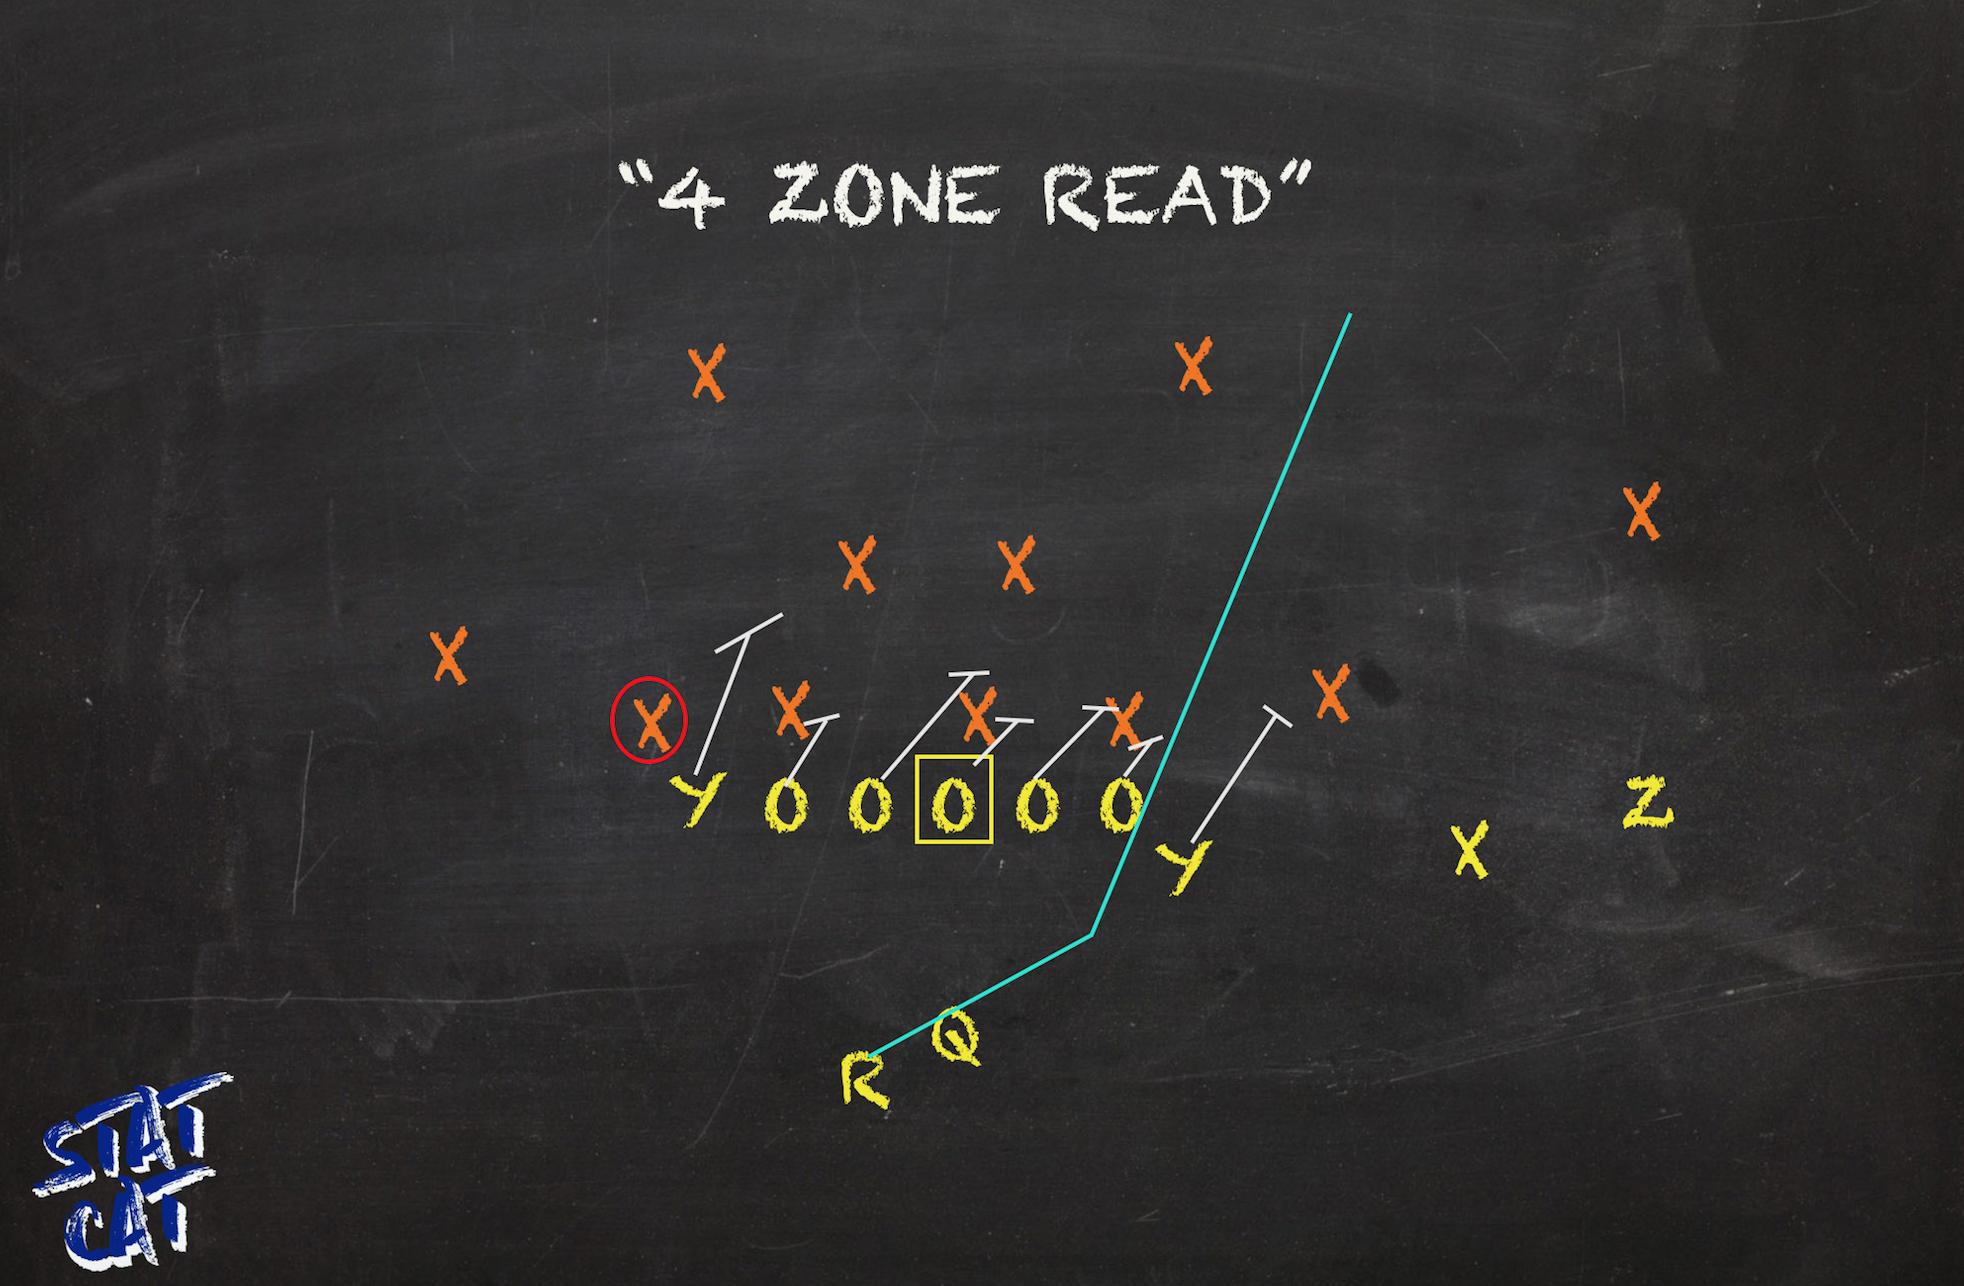
5. Outside Zone Read 2.16% Play Share 5.63 Y/A 31.3% Success Rate
The Outside Zone Read rounded out Vanderbilt's most featured run concepts. But with only 16 reps on the season, it wasn't like these played a major factor. Looking at the play's lowly Success Rate, it's probably a good thing this offense didn't turn to Outside Zone Reads more. Though the look owned the second highest yards/carry clip among Vandy's most called runs, none donned a lower Success Rate. From the gun, this concept allowed Vandy's quarterbacks an option to hit the backside if the defense overly committed to flocking towards the opposite edge. If a certain key defender over-pursue, they had the green light to tuck it and run. Despite this option, the 'Dores' passers didn't log a single rush attempt from an Off-Tackle from the gun this season. Though he was less dynamic on this look compared to its non-read counterpart, Keshawn Vaughn averaged 6.53 yards/carry on a decent 46.2% Success Rate. It was the other ball carries that failed to make this look worthwhile.
Three-fourths of Outside Zone Reads were repped to start a set of downs. On firsts, this look was a tick better in terms of Success Rate (33.3%) and yards/carry (5.92). Still, I am not going to act like that is satisfactory. While the majority of Slam Reads were featured on RPO designs, only half of Outside Zone Reads were categorized as such. The 'Dores were immensely better executing this concept when route tags were not attached. Only one of its RPO tries resulted in success as those wrinkles averaged a mere 1.56 yards/attempt. Non-RPO Outside Zone Reads averaged over 10.5 yards per pop on a 57.1% Success Rate.
Vanderbilt's most successful pass looks
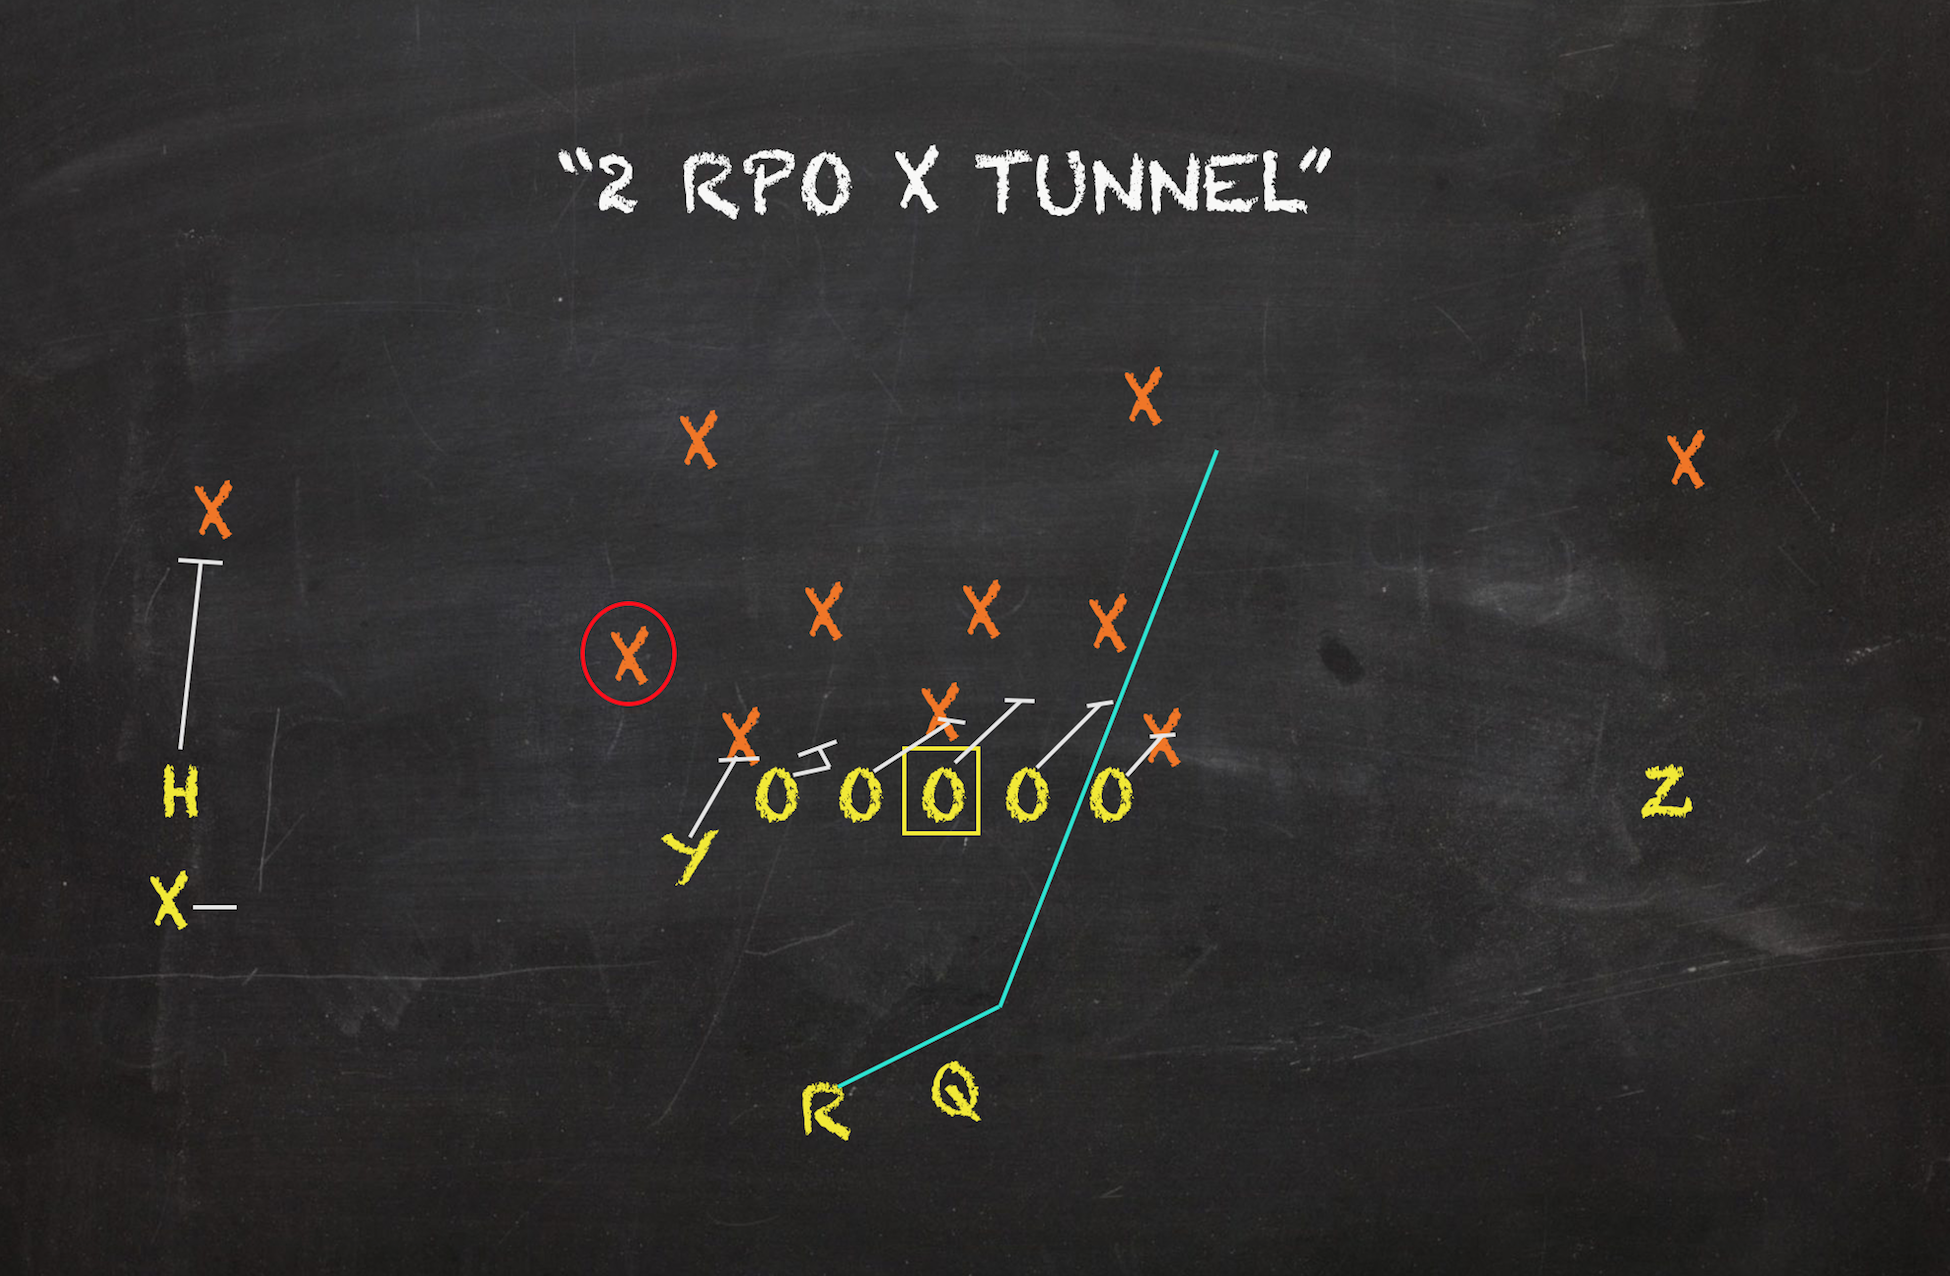
1. Outlet Screens 6.88% Play Share 4.09 Y/A 41.1% Success Rate
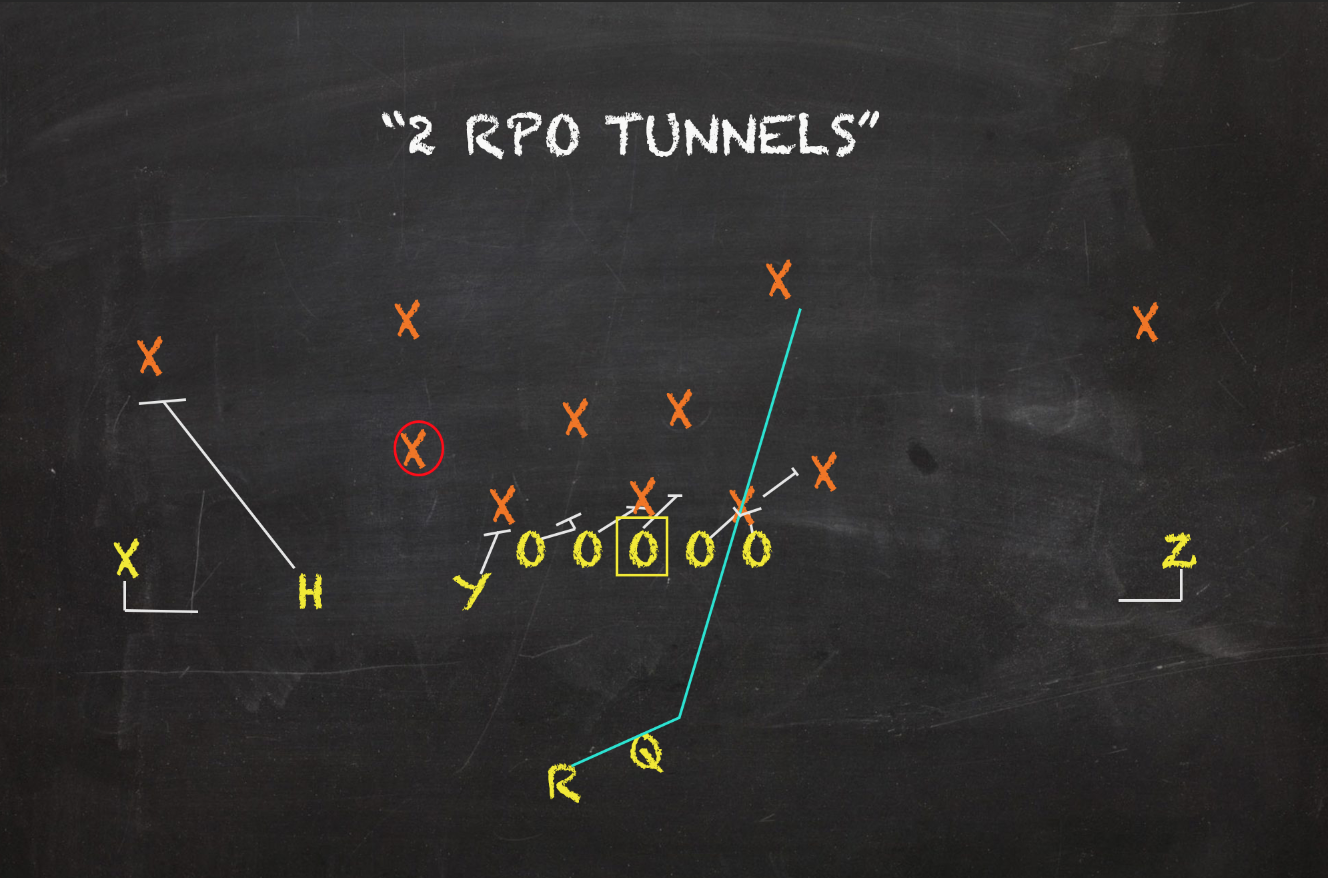
Whether paired off read options in the RPO game or from spread spacing schemes, Outlet Screens like Tunnels, Bubbles, and Swings combined to be Vanderbilt's favorite pass concept. The vast majority of them were paired with Inside and Outside Zone Reads. These only saw attention if Vanderbilt's players outnumbered their opponents on the perimeter or if the defense didn't respect their dynamism in space. With that idea in mind, these always should have had an upper-hand when targeted in theory. But the 'Dores outlets proved to be ineffective blockers or consistent playmakers in the flat. Still, all three Outlet Screens were more successful on RPOs than their other targets. That is mostly due to the fact all eight of the Tunnel screens targeted on non-RPOs failed to result in success. Overall, Tunnels only met or exceeded situational goals on 37.1% of its targets; on RPOs its Success Rate shot up to 48.2%. Nearly 70% of Vandy's Outlet Screens were Tunnels. Though seldom, Bubble Screens were one of Vandy's best looks. Swing Screens only had one successful try out of its seven targets. At the end of the day, Outlet Screens sported the highest Success Rate among their five favorite passes.
Since their read option companions were mostly early down plays in this offense, 1st and 2nd downs were where Outlet Screens saw their chances. Only three reps occurred on 3rd or 4th down combined. With their passers not offering up much competence throwing downfield, the 'Dores had to throw short, towards the sideline, or take a calculated shot. That's not good news if you have someone like Kalija Lipscomb. In order to pad his numbers, he was forcefed opportunities via outlet screens. His 16 targets were nine more than the next closest on the team. Though his Success Rate helped bring up Vanderbilt's overall clip, his figure was nearly ten percentage points below the 52% SEC average. Thanks to their volume, Outlet Screens were responsible for 209 yards, which was the most of any pass concept and the third most overall.
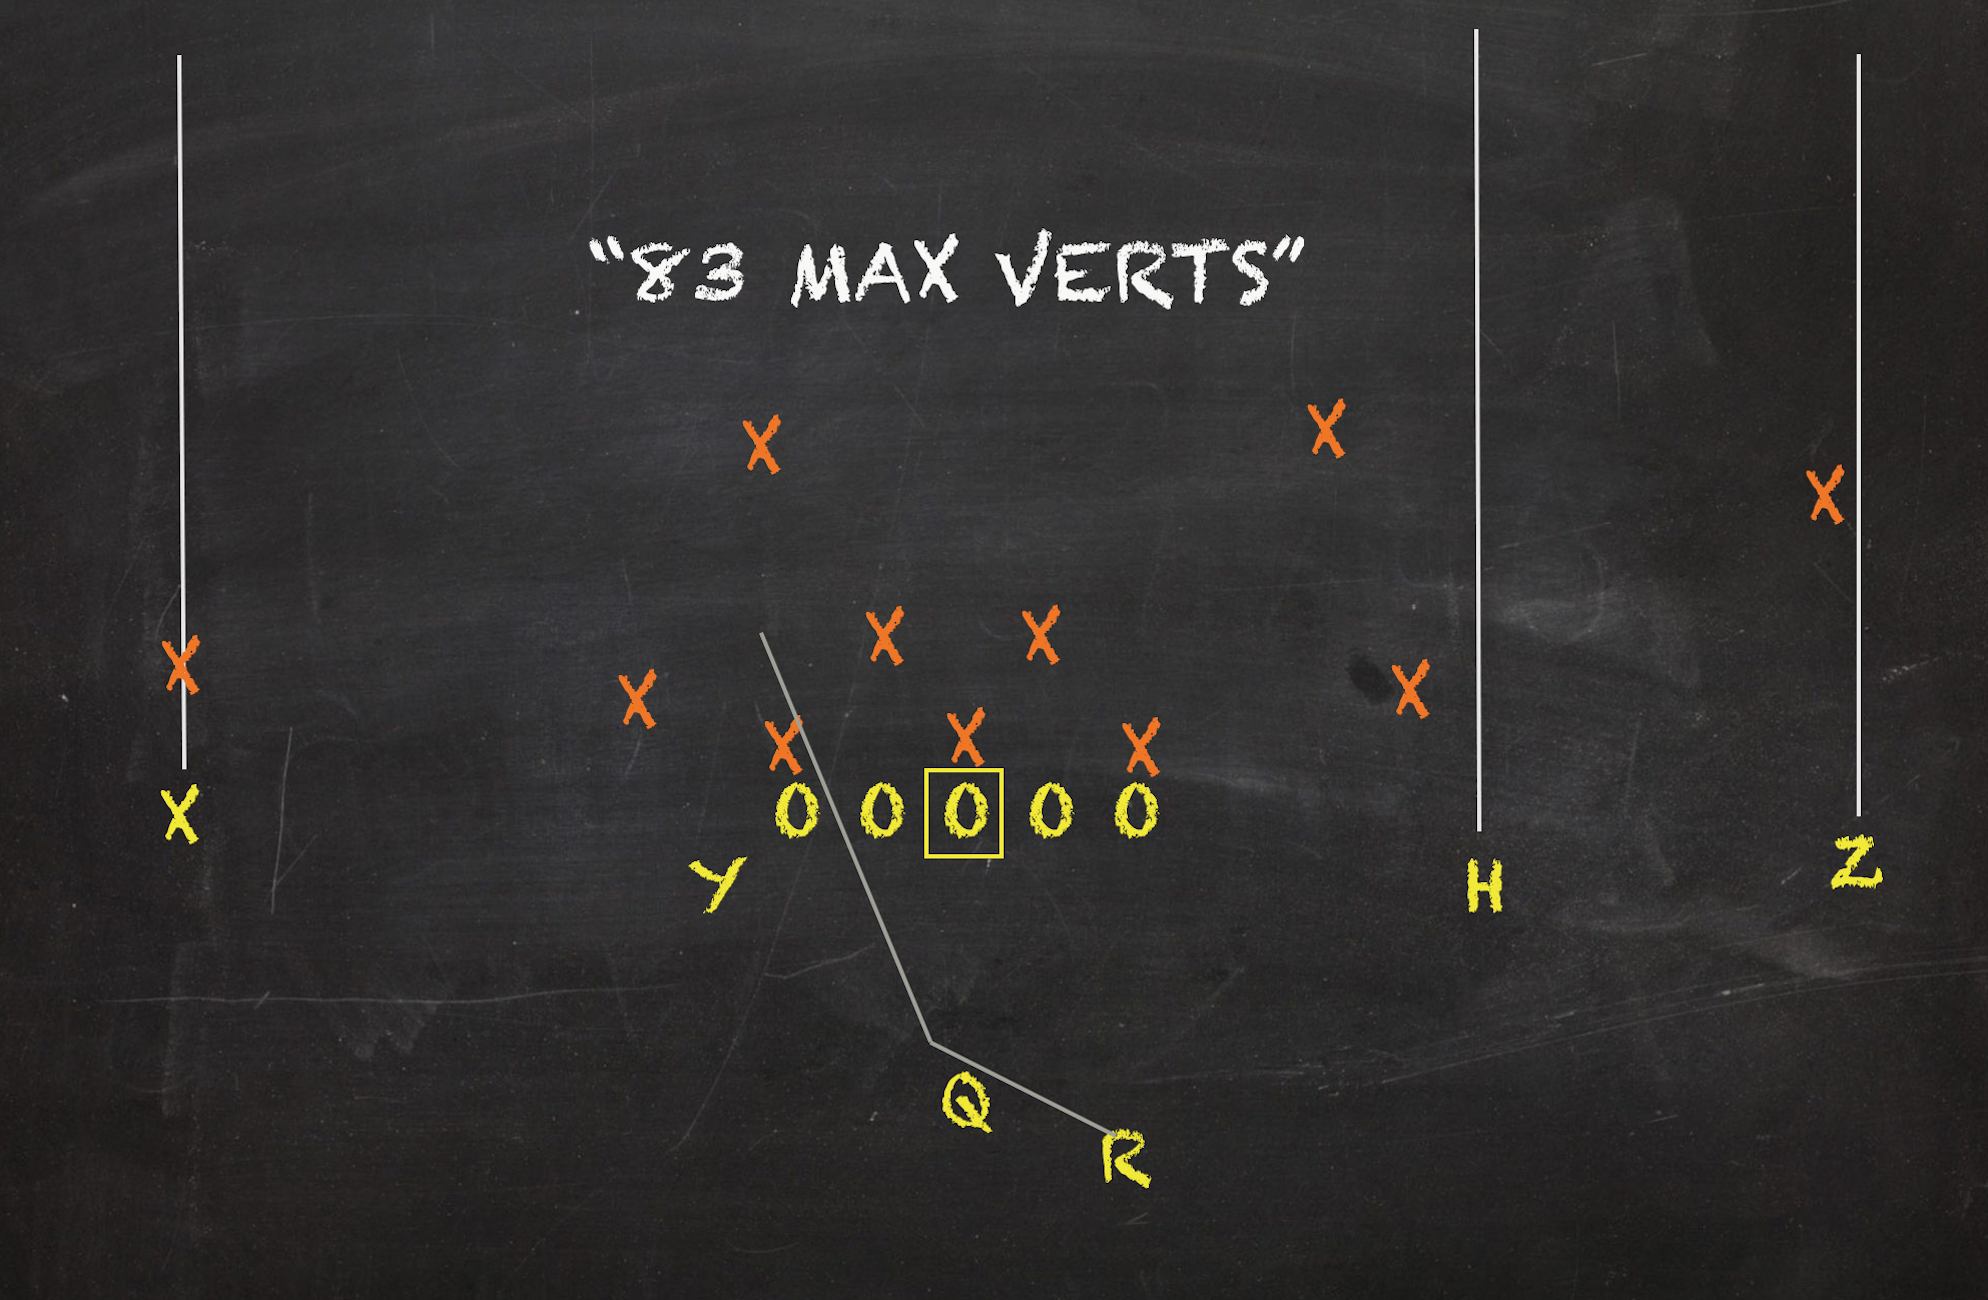
2. All Verts 4.59% Play Share 5.41 Y/A 17.7% Success Rate
All Verts was Vandy's favorite dropback pass pattern on both 1st and 3rd Downs. On firsts, the 'Dores aimed to take a shot when the defense was lulled or flatfooted expecting something short. On thirds, they often needed a mile to convert so sending a bunch of targets deep downfield made the most sense. Only Mississippi State averaged more yards to gain on 3rd Downs within the conference than Vanderbilt. All Verts are simple and can be effective, but this is not a concept that yields consistent completions. The obvious goal on a pattern that sends three to five guys deep on a go route is to overload the back half of the defensive coverage. Like I always like to say: four deep beats two or three deep.
With barely a sixth of All Verts ending in success, Vandy only bested Missouri and Kentucky within the conference in that regard. Vanderbilt repped 34 All Verts, which was good for second most within the conference. Outside of the 'Dores' general shortcomings throwing the football, eight of this look's tries resulted in a sack. While Riley Neal was a rusty passer, he managed to connect on seven of his 15 All Vert attempts for a 40% Success Rate. Only Tennessee's Jarrett Guarantano (11) LSU's Joe Burrow (10), and Georgia's Jake Fromm (9) had more completions on this concept within the SEC. AJ Walters and Deuce Wallace went a cool 0-11 combined on their All Vert attempts. All Verts racked up 184 yards, which was the fourth most of any look by this offense.
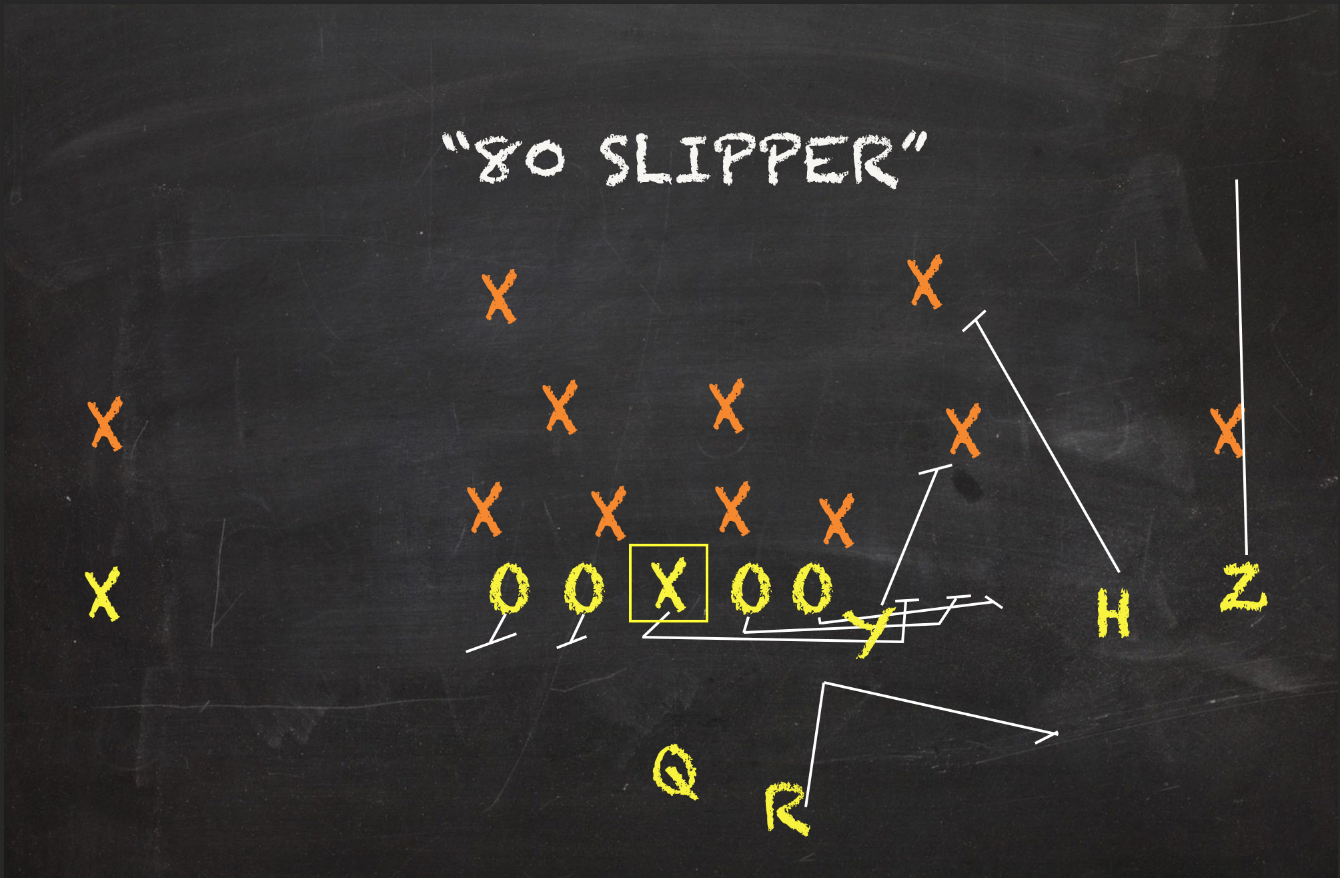
3. True Screens 3.51% Play Share 5.38 Y/A 21.4% Success Rate
Jailbreak, Slip, and Middle screens were no stranger to this offense. While Outlet Screens provide quick hitters to vulnerable spots of a defense, True Screens are more orchestrated and extensions of the run game. Jailbreak -- or "Convoy" -- screens slingshot playside lineman to the perimeter to create an alley for a slot or outside receiver. Slip Screens initially invite the pass rush upfield before dumping off to a back adjacent to the pocket. Middle Screens sneak a target towards the center of the formation hoping to damage the underbelly of coverages. A common tactic deploys True Screens on the do or die down when behind the chains. With the defense dropping extra guys into coverage, lineman have an increased physical advantage when blocking on the perimeter. Also, these completion are much more safe and conservative than trying to thread the needle 15-20 yards downfield. True Screens were repped nine times on 3rd Downs making it the 'Dores third most called look in those spots. Since Vanderbilt frequently played behind the chains, it often made converting these looks a tough ask. As it were, no True Screens resulted in success on 3rd Downs and only averaged 3.67.
Like on Outlet Screens, Kalija Lipscomb received the lion's share of the team's True Screen chances but averaged less than 3 yards per target. With KeShawn Vaughn anchoring much of this units productions, the 'Dores faced a decent amount of early down pressure via run blitzes. Vanderbilt wisely used True Screens in these spots to counterpunch opponents. When he wasn't busy trying to find run lanes on the ground, Vandy aimed to get Vaughn the ball via screens. His 14 such catches were second most on the team but his Success Rate was a mere 28.6%.On 1st Downs, only Outlet Screens combined more targets than True Screens' 15 for this offense. There, Middle and Slip Screens thrived to the tune of a 54.5% Success Rate and 10.7 yards/attempt. Jailbreaks, on the other hand, only saw one successful rep in six of its tries on 1st Downs. Though True Screens managed to create a few chunk gains, they were largely a let down. But thanks to those explosive gains, True Screens combined to total 150 yards, which was the sixth most of any look.
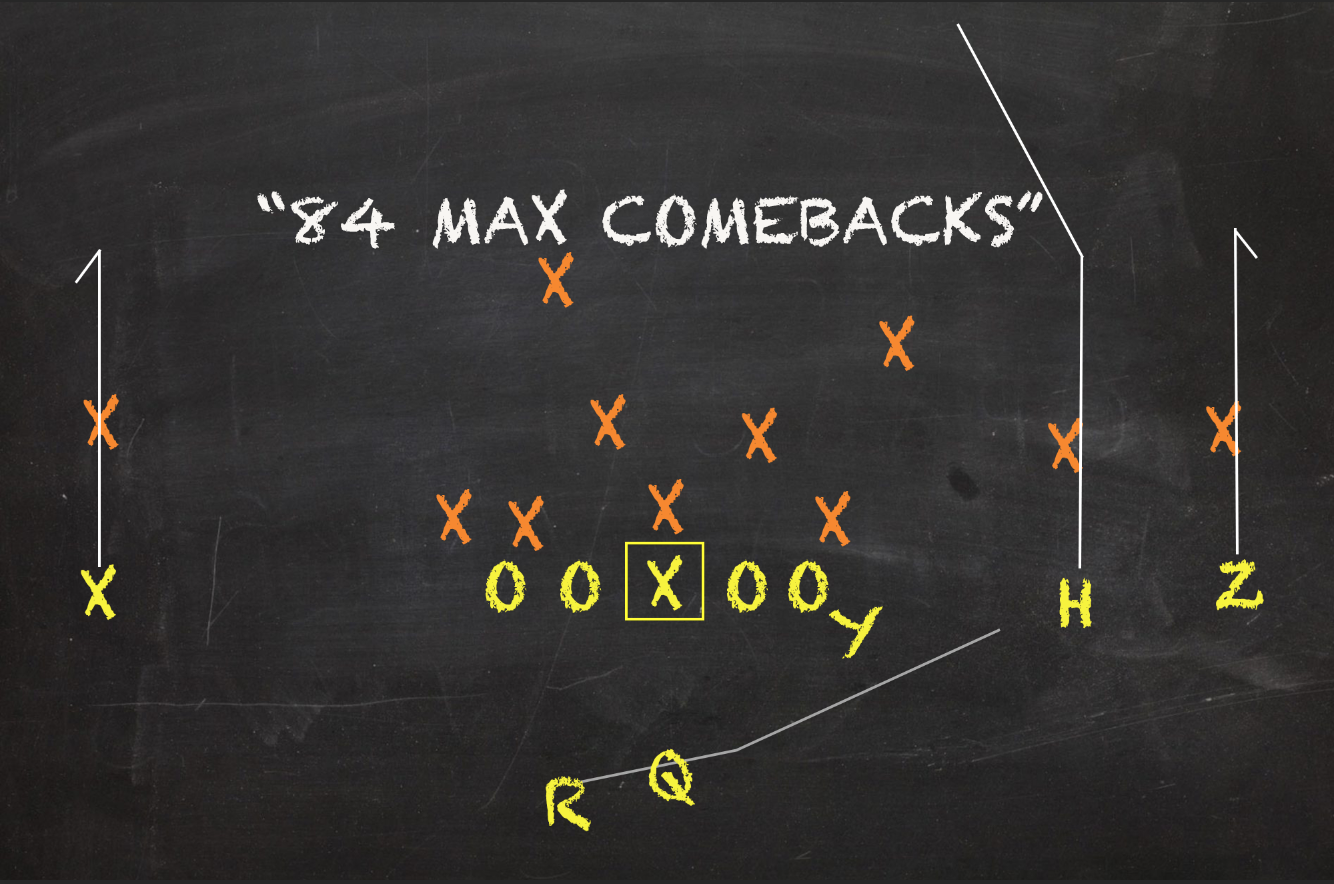
4. Comebacks 2.83% Play Share 5.76 Y/A 23.8% Success Rate
Seam+Sideline combos like Hoss or Comebacks are effective patters at beating single high coverages. Defensive schemes like Cover 1 or Cover 3 default to one-on-one matchups outside the numbers. Curls and Comebacks -- the outside routes featured on Seam-Sideline combos -- naturally beat sagging zones trepidatious corners. The middle seams either find an opening down the middle of the field or occupy safeties so that the outside routes are more isolated in coverage. As far as dropback pass patterns go, only All Verts saw a higher play share than this concept group. When broken out, the Comebacks concept still received enough reps to be included among Vandy's favorite pass looks despite its brother concept Hoss sporting a far more desirable Success Rate (58.3%). In fact, the latter finished among the 'Dores' most successful looks. But, more on that later.
Comebacks was one of Vanderbilt's most targeted plays on 3rd Down. Of the look's 21 tries, 11 occurred on the money down. Only All Verts received more love from this offense in those spots. In terms of both Success Rate (27.3%) and yards/attempt (8.73), Comebacks saw favorable numbers on third when compared to the look's overall figures. While that Success Rate is far from acceptable, it still bested the 'Dores' clip on early downs. Only two of the combined nine targets met or exceeded situational goals in those spots.
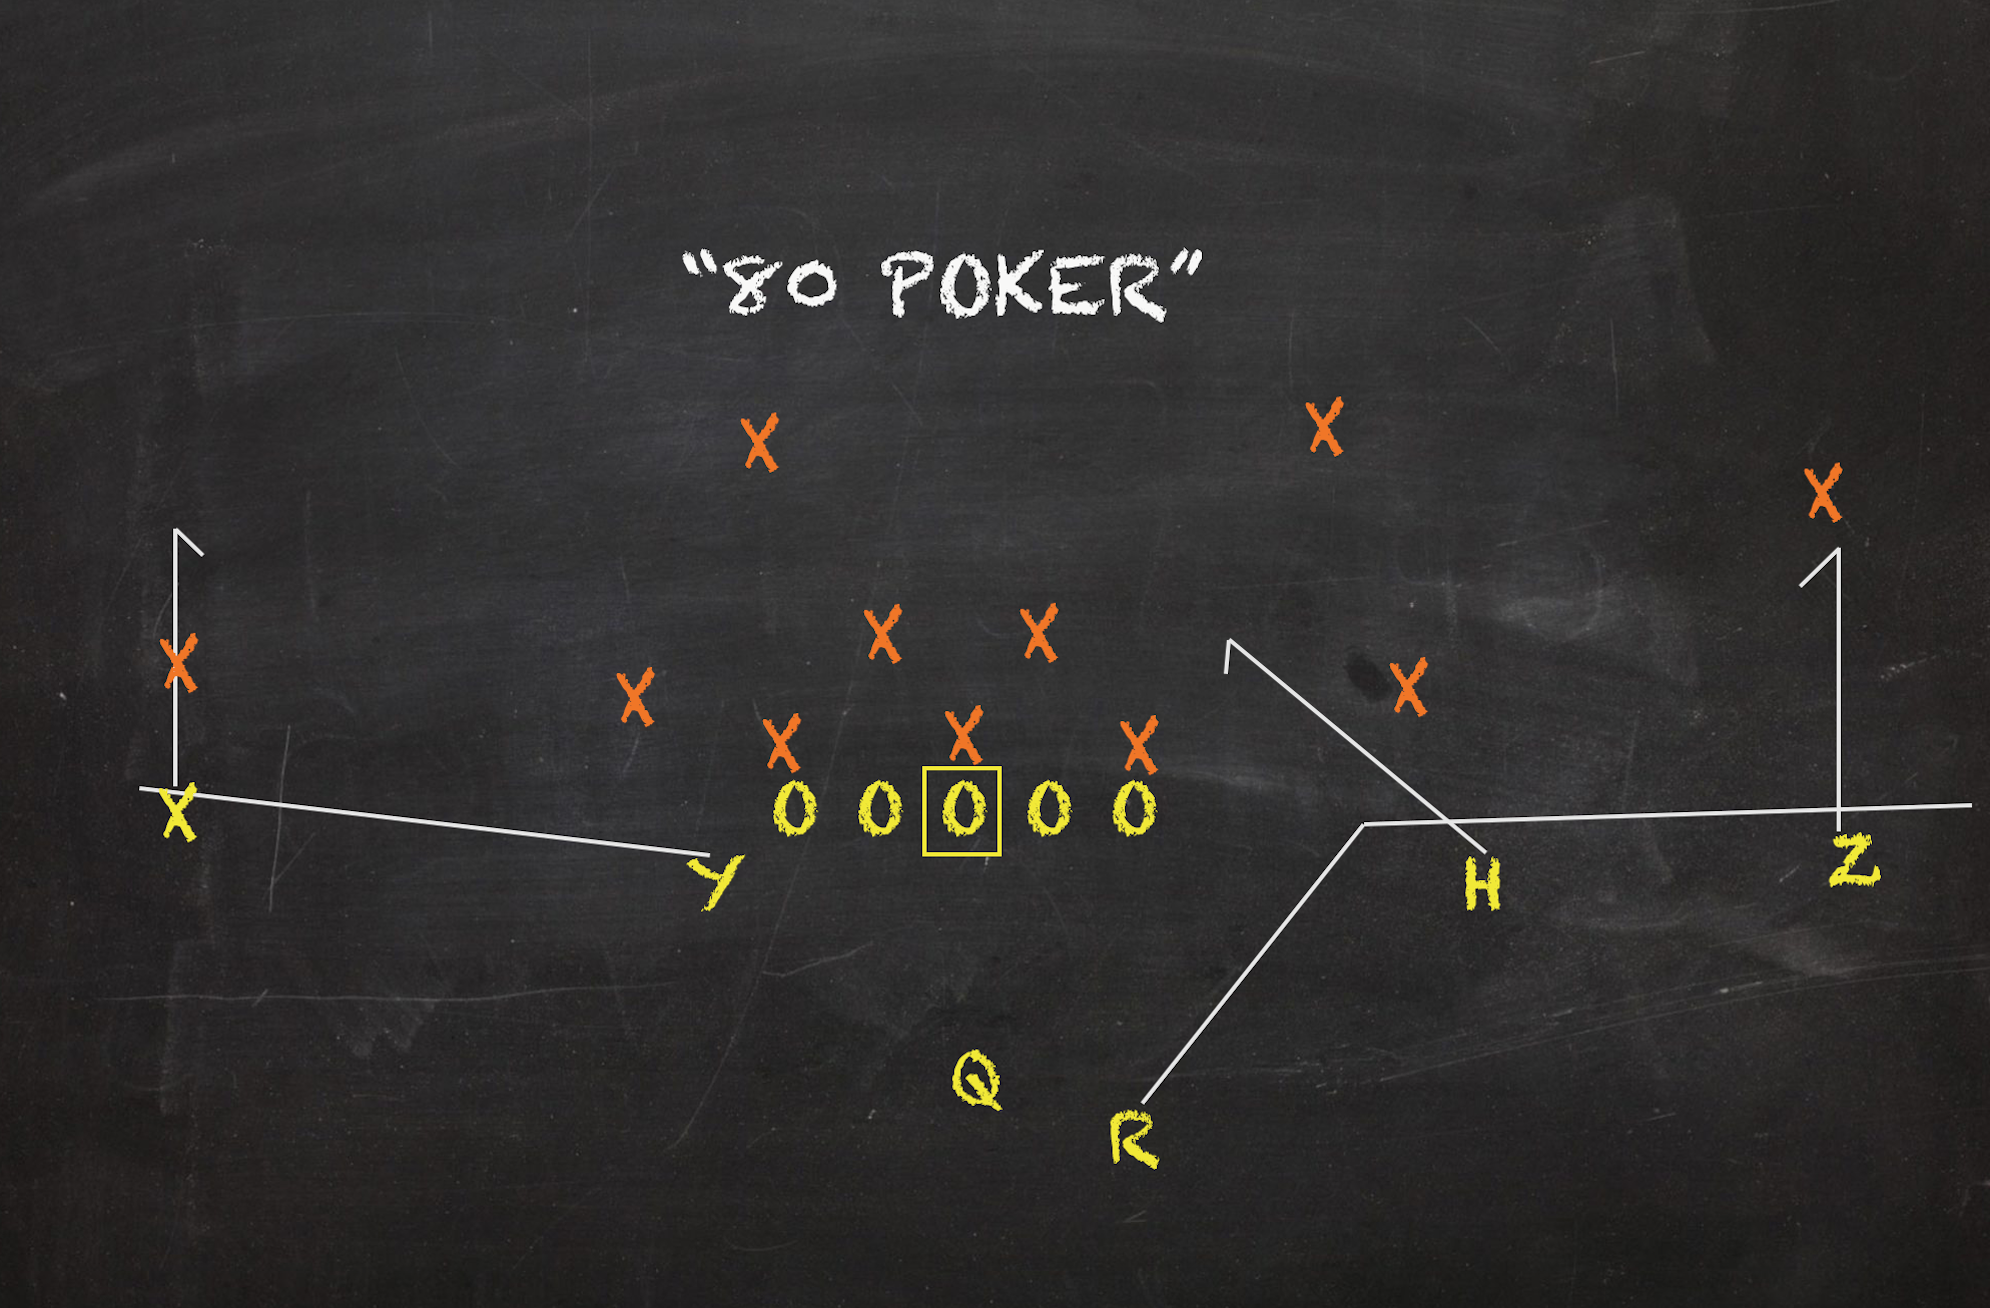
5. Spacing/Curl+Flat 2.56% Play Share 3.32 Y/A 31.8% Success Rate
Spacing plays commonly get a bad rep. Despite their knack to find an opening in various coverages, these designs are associated with manilla offenses or conservative passing games. With four to five options stretching the defense laterally, most zones simply don't have the numbers to adequately cover receivers sideline to sideline. Cover 3 and Cover 4 especially struggle to match Curl+Flat patterns. With all targets traveling less than ten yards downfield, these often present easy throws for passers. Never meant to yield big plays, these surely can be an annoyance to defensive coordinators with the play aiming to nickel and dime with modest results. Despite the lowered degree of difficulty, this bland concept didn't produce worthwhile results for the 'Dores. Less than a third of this look's attempts ended in success while average less than 3.5 yards/target.
Vanderbilt collectively lacked downfield playmakers or refined route runners. Pair that with subpar accuracy beyond ten yards downfield and it doesn't make too much sense to constantly reer back and play vertically. Still, the play-it-safe attitude constricted this offense. With the run game facing crowded boxes, pass patterns that failed to be advantageous with its numbers proved to be a unpleasant occurrence for this offense. Though this concept only saw four 1st Down targets, that's where it sported its best Success Rate. At 50%, it was heads and shoulders better than any of the clips on the subsequent downs (11.1%, 0%, 33.3%). On average, the 'Dores averaged about 2 Spacing/Curl+Flat patterns a game.
Chalking up Vanderbilt's most successful looks
(Min 1.2% Play Share)
1. Bubble Screen 1.21% Play Share 7.67 Y/A 77.8% Success Rate
Bubble Screens, in the macro, were categorized an Outlet Screens when charting this offense. When they were broken out from the pack, Bubbles clearly buoyed the production of its concept group despite its limited targets. Bubbles, like most Outlet Screens, are entirely reliant on the offense outnumbering the defense at the point of attack. Obviously if the offense is in trips and the defense has enough men to account for each receiver, success is a hard ask compared to if the defense only had one or two players in the vicinity. With that in mind, Bubble Screens and other outlets should have sported favorable efficiency clips. Without a numbers mismatch, there would literally be zero reason to target this screen towards the flat. All nine Bubble Screens were off RPO designs. While some SEC offenses used Bubbles in their dropback passing game, the 'Dores did no such thing. Considering this look's success compared to other Outlet Screens, its a mystery why Bubbles weren't paired more frequently with read options. That isn't to say Vandy should have needlessly targeted them for no good reason. But looking at Tunnel and Swing screens outputs compared to Bubbles, I think it's a fair observation considering the 'Dores only targeted five of them after their Week 1 loss to Georgia.
2. Duo Jab 1.75% Play Share 3.85 Y/A 69.2% Success Rate
Duo Jabs -- or "Counter Duos" -- were Vanderbilt's best run play from this past season in regards to meeting or excelling situational goals. You would not have guessed that with the look's forgettable 3.85 yards/attempt. Averaging one per game, the 'Dores sprinkled this concept across all downs. For whatever reason, Duo Jabs saw its highest usage on 2nd Downs where it sported a perfect Success Rate. Duos are named due to the fact they aim to create double teams at the point of attack. Generally, Duos will see two playside double teams. Unlike Duo Dives that are more north and south runs, Jabs have a misdirection element. They are sometimes referred to as "Counter Duos" since the backfield perform similar exchanges on this look as on a Counter. However, no backside pullers are involved on this play design like. If they aren't busy double-teaming, blockers follow typical "power principles". Their order of operation is Gap (protect adjacent backside gap), on (block the dude if he's lined up on you), or backer (climb to the second level). For this offense, Duo Jabs were not big play machines. I'm sure you came to that conclusion based on that paltry yards/play clip. Still, it was a very consistent look for this offense to manage their down and distance. Like Duo Dives, Jabs predominantly were executed from multi-TE sets. Of the play's 13 reps, 11 took place from either 12 or 13 personnel on the field.
3. Sweep/Toss 1.21% Play Share 4.78 Y/A 66.7% Success Rate
Vanderbilt largely preferred to turn to Outside Zone Off-Tackles when they wanted to stretch fronts horizontally or get their backs on the perimeter. While the 'Dores's second favorite ground play produced a few chunk gains, it was often hit or miss. Zone Sweeps and Tosses might have lacked the explosiveness of Off-Tackles, but they proved to be very consistent at meeting or surpassing situational goals. Two-third of this concept's reps resulted in success. But despite Sweeps and Tosses good rate of return, they were largely ignored on the play sheet. The 'Dores only called nine all season. Either with pin and pull action playside or with a fullback lead blocker, these function similarly to Off-Tackles where blockers primary concern is securing the most adjacent playside gap. Vertical push is far less important on these designs than preventing penetration or failing to secure the edge. Sweeps and Tosses saw most of their usage on 3rd Downs; two-thirds of the play's reps occurred there.
4. Hoss 1.58% Play Share 4.92 Y/A 58.3% Success Rate
Hoss is what I label as Curl+Seam combos. Most teams mirror them on both sides of the formation, but there are certainly copious amounts of designs where this basic pattern is paired with other pass concepts. Vandy unleashed this design in both fashions. Some looks the 'Dores coupled with Hoss include Cross, Bench, Curl+Dig, Dag, and Stick. A few reps borrowed a wrinkle the New England Patriots have popularized. With Hoss on both sides of the formation, the three receiver from empty sets will run a "juke" route, which is a multi-breaking slant pattern, towards the vacated portion of the field towards the middle. All three "Jukes" resulted in success when targeted. The Comebacks variation of Seam+Sideline combos saw more reps and averaged more yards/target. But Hoss was far more consistent at helping the 'Dores manage their down and distance. Vanderbilt distributed this look across all downs, but Hoss saw dreadful returns on seconds. There, only one rep resulted in success as the look averaged 2.25 yards/target. All three Hoss targets moved the chains on its 3rd Down tries, which all occurred in the East Tennessee Game with a distance to gain of seven yards or more. Though basic, Hoss is great versus single-high coverages. Cover 3 zone is vulnerable to the short curl or down the seam. On mirror designs, the middle of the field safety is bound to be wrong as its a tough ask for one man to curb two deep routes on opposite sides of center.
5. Duo Dive 5.26% Play Share 4.67 Y/A 51.3% Success Rate
Like their Jab counterparts, Duo Dives were not a big play machine for the Commodores but rather a way to methodically move down the field. The very nature of this design is to win at the point of attack with double teams and hard edges. Since lineman often have tunnel vision due to the fact they are concerned with what's right in front of them, Duo Dives frequently leave backers alone by default. This dynamic makes Duos highly fallible versus downhill defenders or aggressive run blitzers. But if a defense is back on its heels and passive, ball carriers could end up in the defense's lap in the blink of an eye. As aforementioned, Duo Dives pair very well schematically with Inside Zone Slams. Though the two are blocked completely differently, both are initially directed to the B-gap. The variation in blocking assignments can punish over anxious backers honing in on zones with a quick pre-snap audible at the line of scrimmage. Looking at all Duos, Vanderbilt saw its best gains when its ball carriers managed to bust runs outside as they averaged over 7 yards/attempt in those instances. Both Keshawn Vaughn and Keyon Brooks sported Success Rates of at least 53% on Duos.
Where Vanderbilt's weapons ranked
Kyle Shumur was a solid college quarterback. As the son of an NFL head coach, he brought a lot of savvy to the position. While he lacked top-end physical traits, his decision making kept Vanderbilt's offense respectable. But with Shurmur's graduation and no heir apparent on the roster, Derek Mason had to pursue the graduate transfer route. He landed on Riley Neal despite the Commodores' pro style scheme with hefty sets and ample undercenter exchanges. The former Ball State passer mostly had been utilized in spread run schemes that helped hide his deficiencies as a passer. To accommodate their new quarterback, Vandy attempted to run more things to which he was accustomed. The results were not great. But as bad as Neal was, Plan B with backup Deuce Wallace yielded some of the worst passing figures around. No SEC aerial assault was less successful than Vandy's in 2019.

Riley Neal is an okay athlete; but if you can't consistently sling the pill accurately, you're not much good to an offense. This dynamic is accentuated if that offense is lacking in skill and physical acumen relative to most of its conference opponents. The 'Dores certainly qualified for that distinction. Again, Vandy attempted to retool its offense to match the strengths of Neal. This meant more RPOs, read options, spread formations, and less vertical passing. Just under 16% of Neal's pass attempts targeted an RPO design; only five SEC passers had a higher rate. With so many outlet screens and short RPO throws composing his totals, Neal sported the lowest average depth of target in the conference at 6.68 yards. He was the only passer with a figure below 7.3 yards. Despite the ample amount of dinks and dunks, Neal finished with below average Accuracy and Depth Adjusted Accuracy clips. Plus, the plentiful targets ten yards or less curbed Neal's Explosive Pass Rate, which finished inside the SEC's bottom5. With few receivers capable of getting open downfield and with their passer's iffy accuracy, this passing game often relied on yards after the catch for chunk gains. Neal was just as likely to throw a turnover-worthy pass as toss a completion of 20 yards or more. That's not exactly the risk/reward you want out of a quarterback especially a senior. Not only did Vandy fail to win the big play battle through the air, they also felt flat situationally. Neal's subpar accuracy coupled with a single-pronged passing game resulted in Neal owning a bottom5 Success Rate and First Down Touchdown Rate. His forgettable 6.15 yards/attempt just escaped the cellar.
As sour as Vandy's passing game was when Neal was in the game, the futility when Deuce Wallace was in the game was unmatched. First, consider Neal's equal Explosive/Interceptable Pass Ratio to what Wallace produced. Wallace didn't direct a single explosive pass attempt in over 100 attempts. He is the only SEC passers with at least 74 attempts this past season that can make that claim. His Interceptable Pass Rate of 15.8% was one of the five highest in the conference. Outside of his four INTs, defenses combined to drop 12 other attempts. Facing the second highest rate of pressure per attempt in the SEC, Wallace clearly couldn't find his comfort zone either in mop-up duty or relieving a concussed Neal. At the end of the day, he was the only SEC passer either last or second the last in the areas of Success Rate, Accuracy, Depth Adjusted Accuracy, Explosive Pass Rate, First Down+Touchdown Rate, and yards/attempt. Perhaps the most damning stat of all: UK wide receiver turned quarterback Lynn Bowden managed to sport a 33.8% Passing Success Rate despite predominantly throwing bomb on 3rd Downs. Wallace's clip was 12 percentage points worse.
While the two passers functioned quite differently, both experienced similar sack rates, average time to throw, and throwaway rate. The former is somewhat interested considering the fact Wallace's Pressure Rate faced was significantly higher than Neal's. Though certainly you can point to each quarterback's underwhelming accuracy, owning the two worst First Down+Touchdown Rates in the conference highlight's this passing games inability to make key plays.
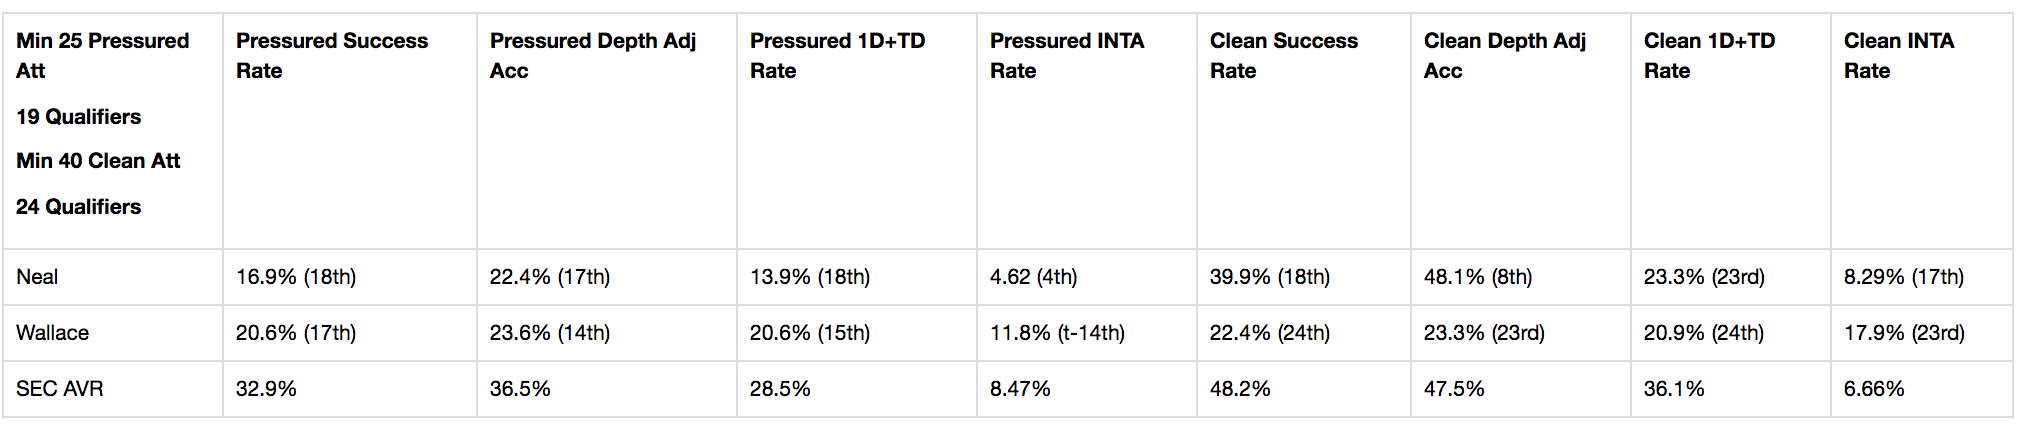
From my perspective, it was a little disappointing to see how Neal responded to pressure, but the speed and skill of SEC fronts affected him quite a bit. Even Wallace's figures under duress were less crappy than Neal's from this past season. Only about a seventh of his pressured pass attempts met or exceeded situational goals. He was firmly within the conference's bottom3 in Success Rate, Depth Adjusted Accuracy, and First Down+Touchdown Rate when pressured. At least he limited his amount of interceptable pass attempts. Neal's 4.62% clip was good enough to be one of the four best in the SEC. Still, the grad transfer was putrid in the face of pressure. With his subpar ability and his targets creating less separation, duress greatly inhibited the 6'6 passers wide passer and elongate throwing motion that made his already small margin of error increase in difficulty.
Like most passers, Neal was a much more sound thrower from clean pockets. Since unpressured dropbacks are more consistent down-to-down, they better reflect a passer's trajectory. After all if a passer can't hit a man or make good decisions from clean pockets, how should he be expected to pass accurately when plays break down and constant variables present themselves? Neal used his copious short throws to inflate his accuracy numbers. Often working short to long, he preferred to check down rather than taking a shot. This resulted in his Depth Adjusted Accuracy from clean pockets to finish the eight highest in the SEC. But like his overall numbers suggest, this had no affect on yielded successful or worthwhile passes.
Wallace's output versus pressure was pretty consistent with his figures from clean pockets. With no further information, some would be optimistic with the findings. Except, I already mentioned Wallace's 2019 campaign was historically bad. But with less dropoff between the two aspects, Wallace had superior numbers than Neal's versus pressure. Still, they overly sucked. No SEC passer was worse from clean pockets. I mean, glance at that table above. Wallace was on his own level of suckdom. No other SEC passer had a clean Passing Success Rate under 31% besides Wallace's 22.4% clip. Since Neal was one of the most reliant passers in the conference on RPOs to pad his numbers, his figures are somewhat distorted.
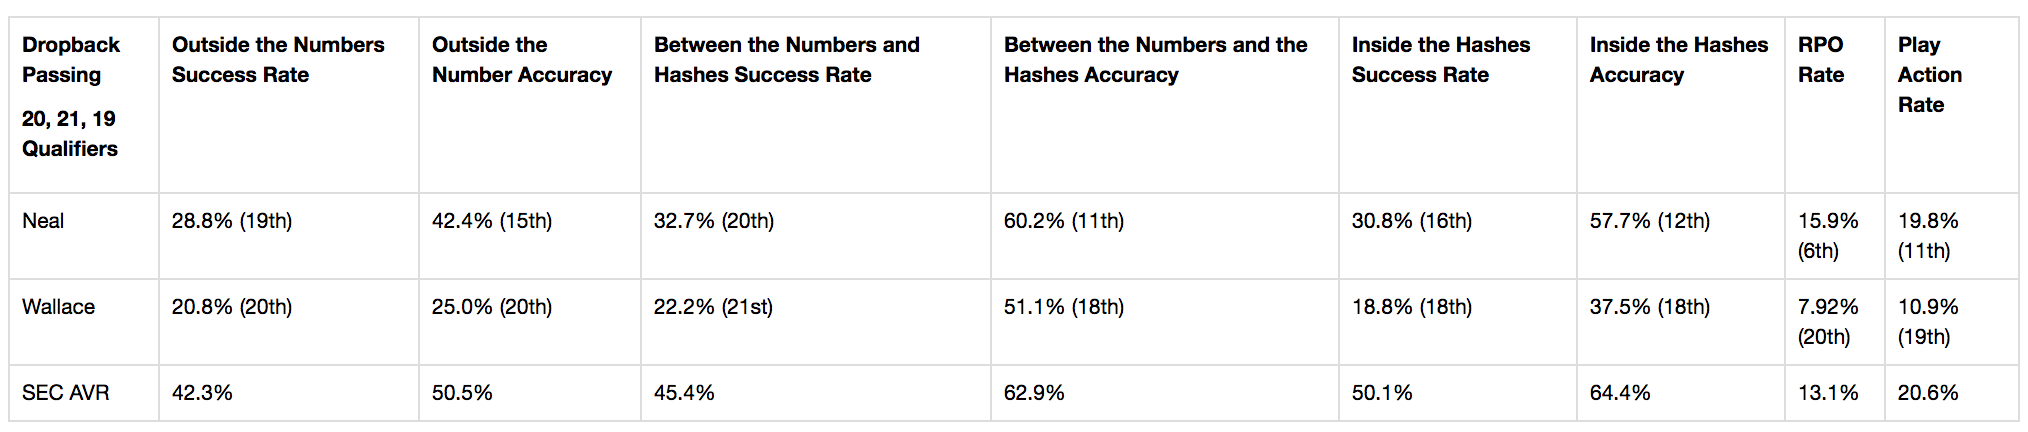
Not that Neal has much of a shot if any at the next level, but pro scouts would certainly would hone in on his production off dropbacks rather than examining his RPO or screen attempts. Neal's Success Rate from sideline to sideline placed within the conference's bottom5. When not granted a presnap numbers advantage with a quick outlet, he frequently struggled to operate and make sound decisions. I mean, I can only say in so many words that Neal was a letdown in Nashville. But no matter how much Neal dissatisfied, he proved to be the more consistent option. Even though Wallace owned the second lowest RPO Rate within the SEC, his dropback numbers were dreadful. What a shocker. Outside the hashes, the conference failed to produce a less successful passer. Inside the hashes, only UK's Sawyer Smith's maligned snaps saw a lower Success Rate than Wallace. Even ample play action couldn't manufacture easily throwing lanes for the challenged Wallace.
The shift from pro scheme to more spread principles neutered this offense and failed to see Vandy's passer maximize their strengths. Focusing on short, manageable designs coupled with screens and RPOs is an okay methodology when your defense can keep games close or if you offense can win situationally. The 'Dores were unable to do either. With increased deficits, fronts started to pin their ears back and further heightened this passing game's degree of difficulty when it aimed to throw more downfield. But again, that was far from this unit's strengths. There are a lot of red x's -- i.e. incompletions -- on Neal's (bottom left) and Wallace's pass charts.
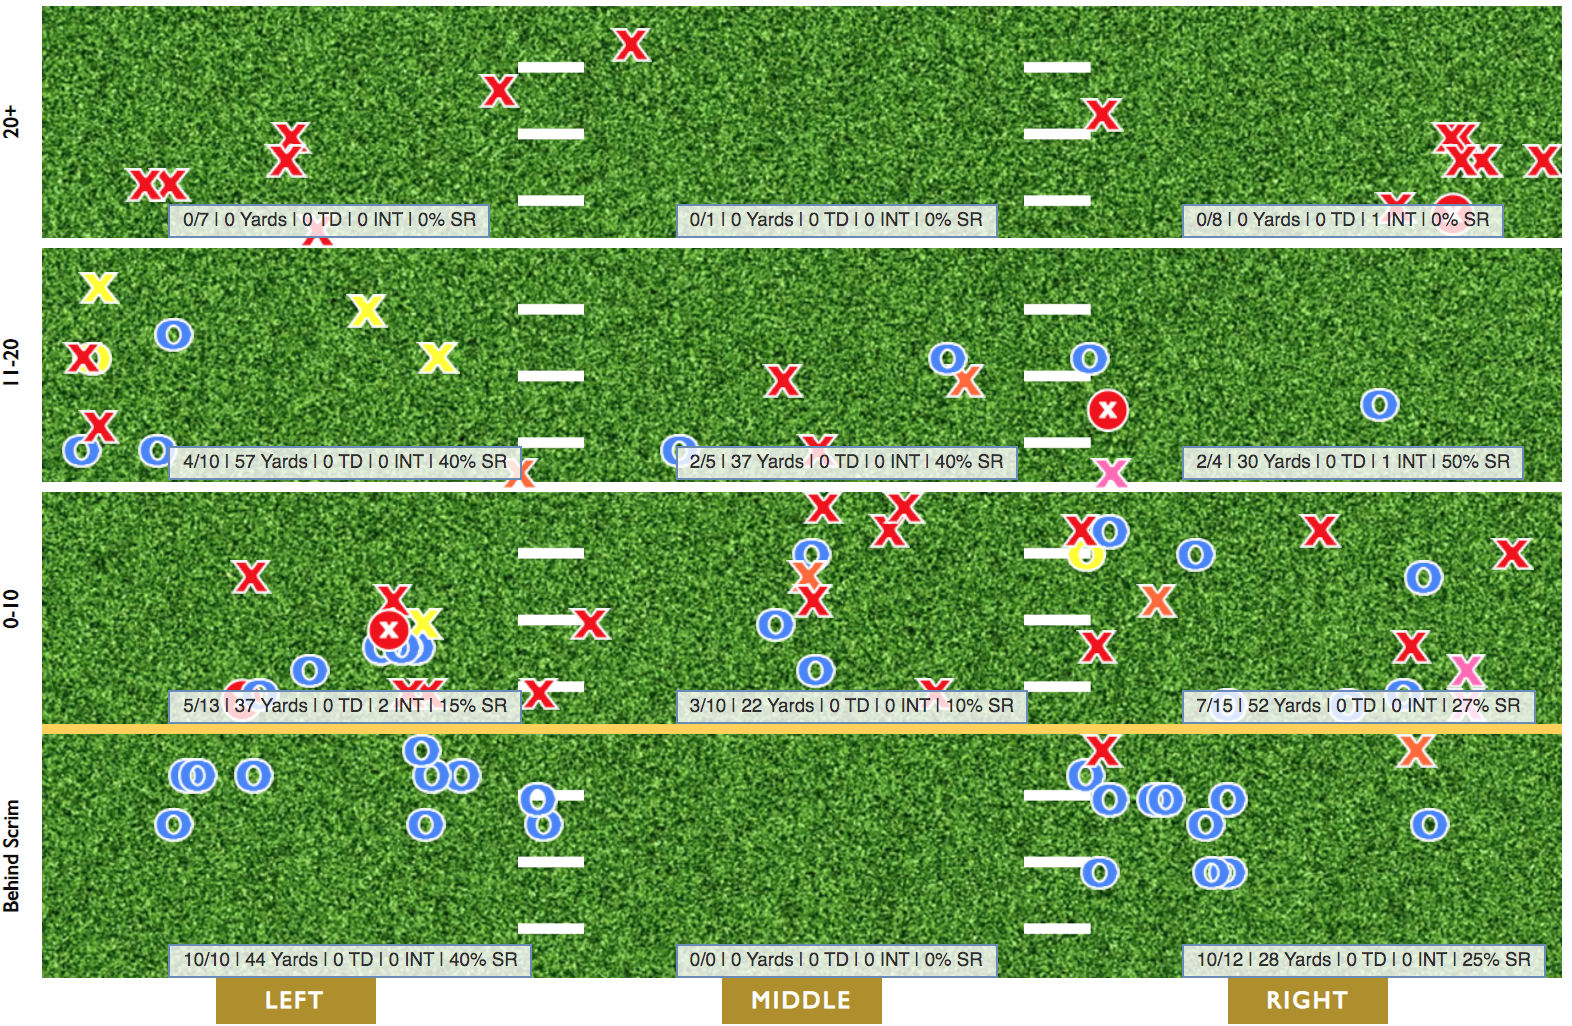
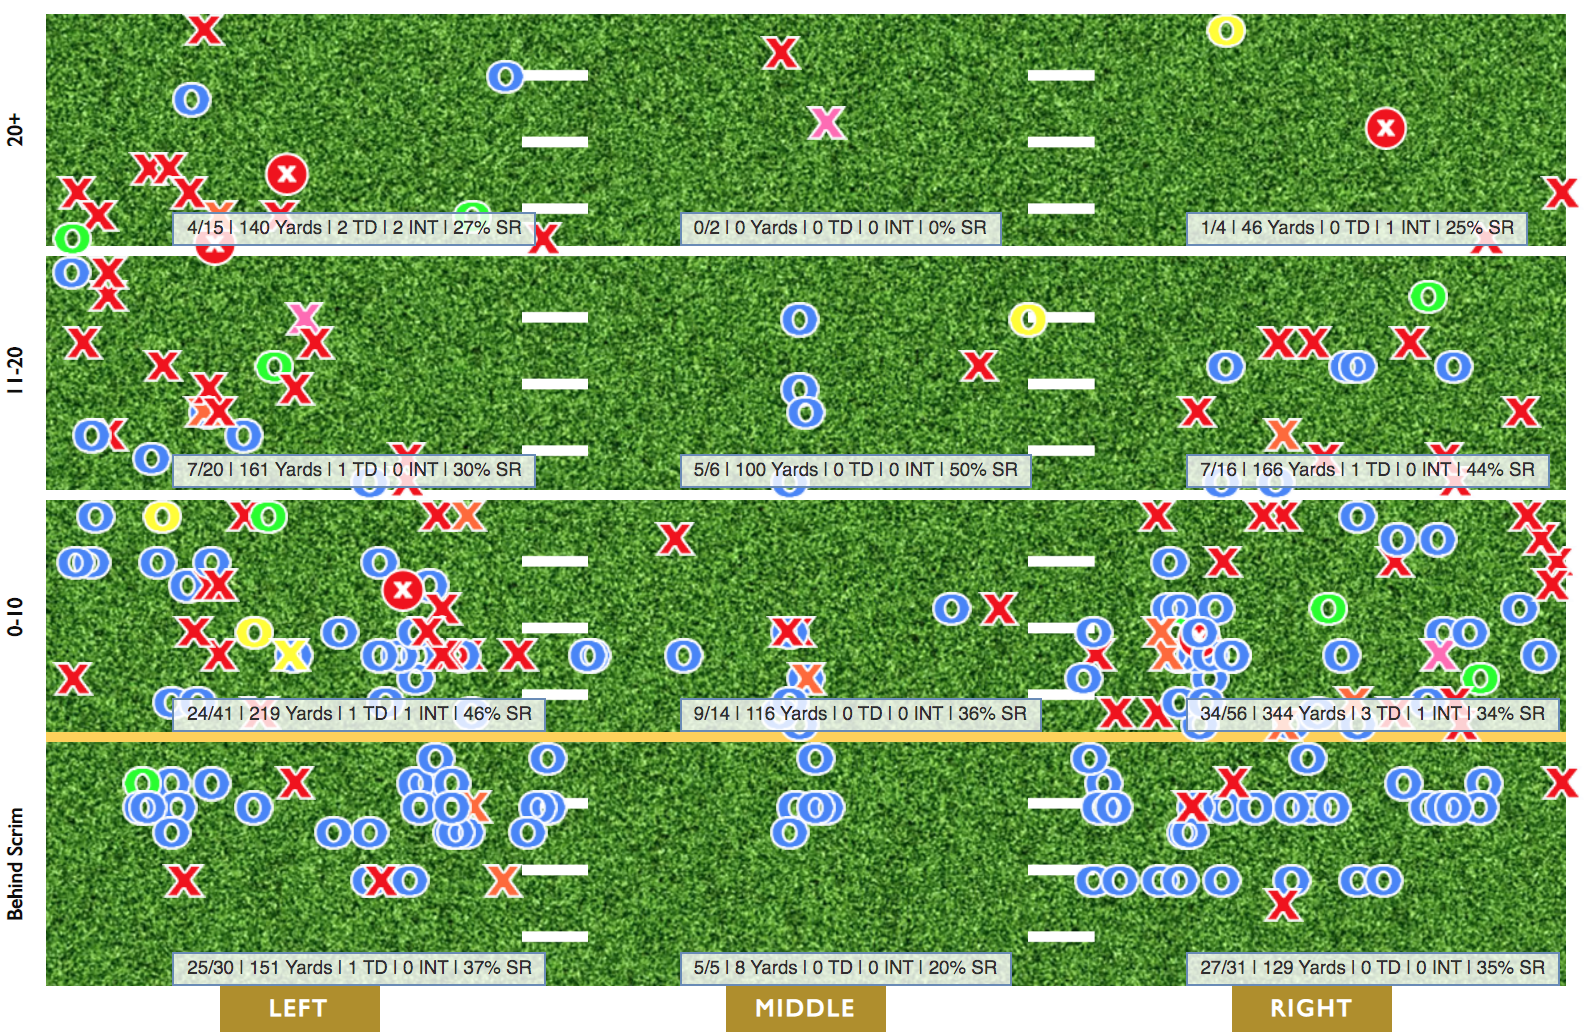
With all that in mind, Vanderbilt's receivers were bound to experience a negative statistical relationship. If a pass is inaccurate or uncatchable, there's not much targets can do to bolster their quarterbacks. Plus, the added emphasis on short routes put a premium on timing and precision. If the idiosyncrasies of the design were altered with a jam, off-target throw, or tight coverage, the receivers' degree of difficulty would be amplified. Of course, those occurrences were common this past season from Vandy's offense. All three of the 'Dores' three main outlets sported an above average Success Rate in 2018 with two of them cracking the 50% plateau. Their three main targets from this past season all finished with below average clips with two cemented inside the SEC's bottom5. Inconsistent performances from Vandy's passers made it nearly impossible for these guys to come out smelling like a rose.

Like the last few years, Kalija Lipscomb was this offense's go-to receiver. Once again ed the team in volume figures like catches, yards, and touchdowns. But, his production took a very noticeable hit with the putrid passing. His targets declined by 24% and both his catch and yards total by 40%. Even with his high volume, Lipscomb had sported favorable figures in the past, but he was unable to answer the bell this season with his flawed passers. Lipscomb was just as likely as see an uncatchable target as be on the receiving end of a first down or touchdown. Both clips comfortably placed within the SEC's bottom10. When omitting screen and RPO attempts, Lipscomb's Uncatchable Target Rate of 34.4% matched his Catching Success Rate. Beyond ten yards downfield, Considering he was far an away the 'Dores' favorite target, that level of inefficiency will doom any offense no matter who was the catalyst for the overall shortcomings.
Though he remained Vandy's most targeted receiver deep, Lipscomb's average depth of target declined by nearly a yard and a half. To attempt to get him the ball in space and take a load off Neal's plate, Lipscomb saw a screen or RPO try on about a fourth of his targets. His 25 were tied for the SEC's sixth most this past season. Since his tries were carried less weight downfield with the abundant short targets, his Depth Adjusted Catch Rate was poor. While it was the best clip among Vandy's three main outlets, Lipscomb was more likely to see an uncatchable attempt (37.9%) than come down with a reception (31.0%). As good as his hands were, Lipscomb was never the receiver to win in a phone booth or climb the ladder consistently. No Vandy receiver saw more than five Red Zone targets, which meant they all failed to qualify within the conference rankings. But, Lipscomb clearly was this offense's primary option on key downs. But often facing 3rd-and-longs or double coverage, he sported an undesirable Contested Catch Rate, 3rd Down Success Rate and Red Zone Success Rate. But if the ball got to Lipscomb, he was one of the best around catching passes. His 2.3% Drop Rate was one of the ten best in the SEC.
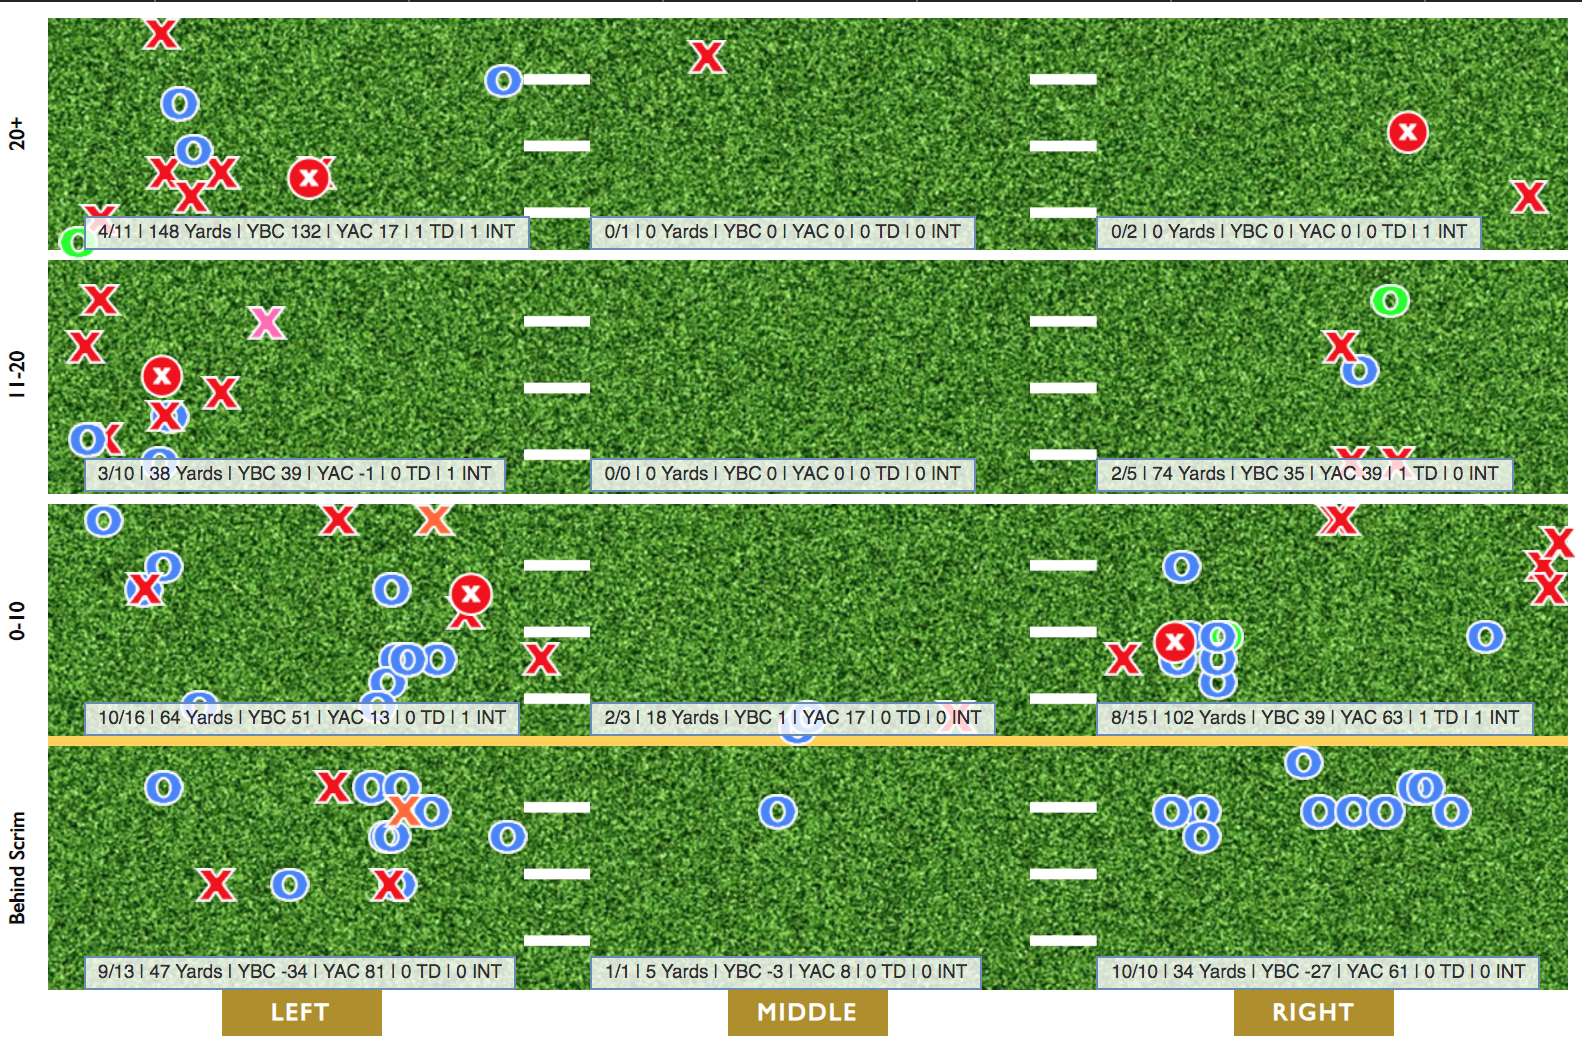

Many considered Jared Pinkney to be one of the premier tight ends in the conference entering 2019. Operating as a safety value and decent downfield option the past few years, Pinkney was poised to play a major role in Vandy's offense as an underneath outlet or target near the line of scrimmage. Many pro scouts and analysts drooled over his potential as a do-it-all tight end. But as the year progressed, it became apparent Pinkney's presence in this offense was fading. Rather than providing a consistent option in his passer's line of sight, he was asked to seal the edge. Rather than working a mismatch with linebacker or safety, he was asked to help double team edge players. Rather than operating inside-out, he was asked to attack more outside the numbers. Collectively, the tweaks this staff made utilizing their senior tight end resulted in one of the least efficient receivers in the SEC. His Catching Success Rate, Catch Rate, yards/target and First Down+Touchdown Rate all fell within the bottom3.
Though his average depth of target was well below the conference mean, it was the highest of Vandy's three main options. Yet, his Explosive Catch Rate -- or percentage of catches that net 20 or more yards -- fell into the SEC's bottom10. Pinkney failed to haul in a single target beyond 20 yards downfield. Only three of his 16 targets beyond ten yards wound up as completions. With less worthwhile catches downfield, Pinkney's Depth Adjusted Catch Rate was the second worst in the SEC. Keep in mind, that omits uncatchable targets. Even his frame couldn't help him box out defenders on contested catches or help him command a higher level of success when passes were off the mark. His 3rd Down Success Rate, Red Zone Success Rate, and Contested Catch Rate finished near the conference floor. Naturally, he could only do so much if a pass was beyond his reach. Over a fifth of his targets were deemed as uncatchable. Due to his passer's woes, his professional outlook remains in limbo. As of the time of this writing, he is currently ESPN's Mel Kiper Jr's eight best TE prospect in this year's draft despite being one of the top options at the beginning of the season. Despite seeing the second most targets on the team with 46, Pinkney finished fourth on the team in catches and fifth in receiving yards. It's hard to rally around that performance no matter how much of a believer you are.

Freshman wideout Cam Johnson found a niche taking advantage of space when defenses were prioritized with stopping Lipscomb. Over a third of his receiving yards and 40% of his catches came on throws behind the line of scrimmage. This brought his average depth of target down considerably. His 7.13 clip was among the six lowest in the SEC. But since he was closer to his passers more often than not, his degree of difficulty on his chances were relatively lower than Lipscomb and Pinkney. His Uncatchable Target Rate and Catch Rate were the best among Vandy's three main targets. But since Johnson was a shaky receiver deep, his Depth Adjusted Catch Rate was anchored inside the conference's bottom10. Despite his lack of experience, he made the most of his chances. Obviously with more pressing threats, defenses mostly left Johnson be. Even though his 46.7% Catching Success Rate was below the SEC average, it was substantially better than Lipscomb's and Pinkney's outputs. With more reliable targets being on the mark, he had far less wasted chances than the elder options. While his overall Success Rate was pedestrian, he held his own on contested targets and on key downs. Like his overall clip, Johnson bested Lipscomb and Pinkney in both 3rd Down Success Rate, Red Zone Success Rate, and Contested Catch Rate. The latter was good enough to finish inside the conference's top15.
Looking at Vandy's entire receiving corps, Johnson was the only player with a Success Rate above 36%. Outside of being their most consistent target, Johnson finished second on the team in catches and yards with three scores, which were tied for the most on the team. Outside of Keshawn Vaughn, no Commodore sported a better average gain after the catch. Even though he was targeted predominately short, this aspect allowed Johnson to be Vandy's most explosive receiver. Over 11% of his catches resulted in a gain of 20 yards or more. The next closest teammate was Ben Breshnahan's 10.5% clip. For him to take the leap, he will need to show more potency downfield. But Johnson seemingly has tools to be an effective receiver in this conference. Of course, it remains to be seen how productive he can be when defenses pay more attention to limiting his output.
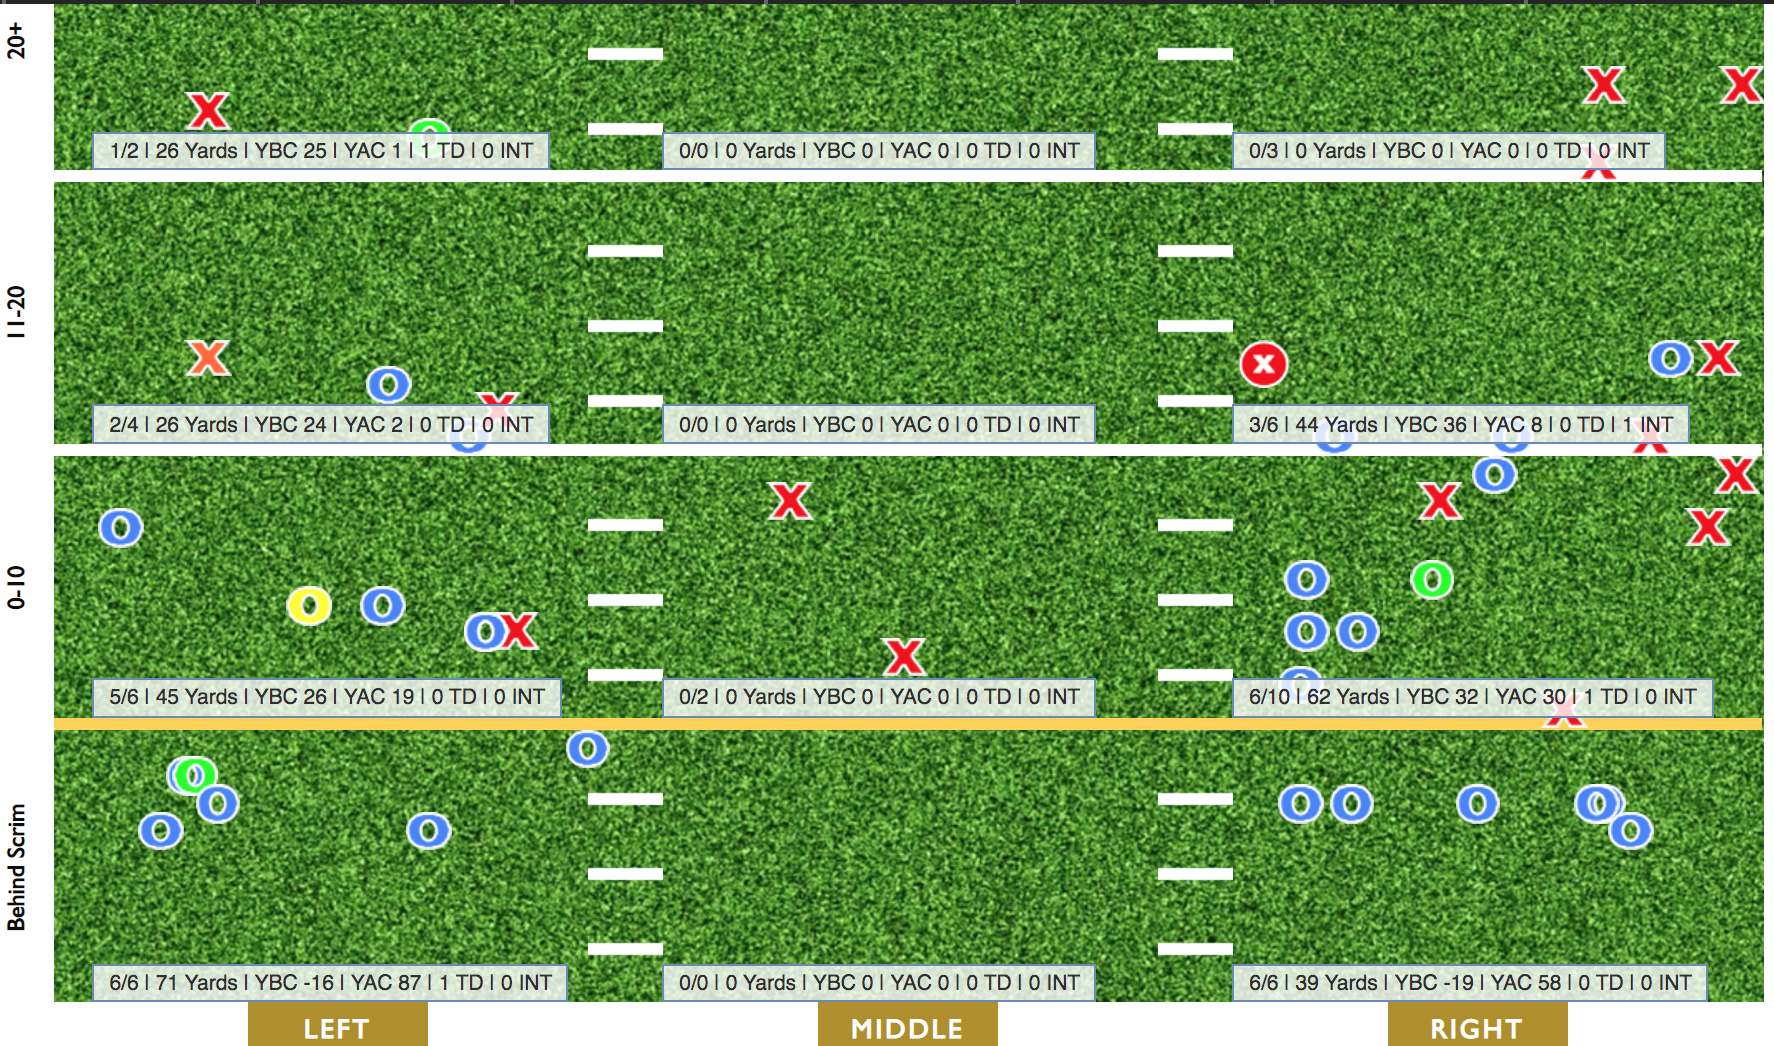
Vanderbilt's passing game represented the SEC's floor, but its run game was only slightly below average in terms of Success Rate. Though the 'Dores had a bottom3 yards/carry within the conference, the rushing clip this offense put up was far favorable to their down-to-down consistency with their pass game. Keshawn Vaughn immediately established himself as a rock solid SEC back when he transferred in last season. His workload increased this season with said aerial ailments. Despite barely playing the final game versus Tennessee, Vaughn finished with the fourth most carries in the conference. He was this offense's run game. His individual numbers mostly buoyed the 'Dores analytics across the board. Though he held his own, there's no question Vandy's rushing attack was hindered by a bottom4 yards before contact average within the SEC.
Despite the early engagement from defenders, Vaughn was Teflon. His 3.27 yards after contact clip just missed making the SEC's top10, but his 40.4% Broken Tackle Rate placed in the top5. In terms of percentage of yards accumulated after contact, his 63.1% was the eighth highest in the SEC. Vaughn was one of three guys with bottom10 yards before contact clips and have a Success Rate over 43%. Much of what Vaughn produced were based on his personal fuel. With that in mind, no stat validates that other than Gumption Run Rate. These are instances where ball carriers are hit behind the line of scrimmage but manage to generate a positive gain. No SEC rusher had a higher clip than Vaughn's 7.07%, which was about one per game. That essentially translates to over a fifth of his carries seeing defensive contact behind the line of scrimmage. Despite that, Vaughn posted respectable numbers.

As aforementioned, Keshawn Vaughn played a critical role within this offense. He was responsible for 48% of their touchdowns, 36% of their yards, and 31% of their reps. Defenses knew the 'Dores wanted to feature him frequently. I don't want to sound redundant, but their floundering passing game put a bigger target on Vaughn's back. Since Neal and Wallace were toothless throwers, opponents honed in on Vaughn and stressed to make his job harder. Case and point, Vaughn owned one of the few before contact clips below 2 yards as well as a Negative Run Rate in the SEC's bottom5. Defenses stacked boxes and Vanderbilt doubled down with multi-tight end sets. Instead of trying to spread out opponents, they opted to out-smash them at the point of attack. Essentially half of Vaughn's rush attempts were out of those sets.
Freshman Keyon Brooks provided spot carries throughout the season. Defenses were less intimidated by him and often were more lax defending him. But due to Vandy OLine's shortcomings, he still saw a below average yards before contact and no other SEC ball carrier was worse at beating situational goals. Brooks' 32.1% Rushing Success Rate was the conference's floor. Outside of having less than a third of his fail, Brooks' First Down+Touchdown and Explosive Run Rates fell inside the bottom5. Despite his lack of potency, Brooks was bull of a ball carrier. Though a tenth of his touches saw defensive contact behind the line of scrimmage, over half resulted in a positive gain. Brooks' 5.36% Gumption Rate was the SEC's sixth best clip. This was a direct reflection of his ability to slip out of tackles. As good as Keshawn Vaughn was at eluding defenders, Brooks' 46.3% Broken Tackle Rate was third best in the conference. Brooks was the most inconsistent rusher in the SEC on a per carry basis. But, his ability to shed tacklers is a great foundation upon which to build his skill set.