Sideline to Sideline: Tennessee 2019
Tennessee at a glance
Rebuilding a program is never easy. Captain Obvious wanted me to relay to you all from the onset. Erasing a decade-long stint of mediocrity cannot be undone by a single signing, winning season, or bowl victory. Changing a program's culture and mentality from the inside can often be like turning an aircraft carrier. Quite frankly, it just takes time and requires hawk-eyed vision and a lunchpail attitude. While Jeremy Pruitt's hire lacked splash and pizzazz, those are the characteristics the defensive-minded coach brought to Knoxville.
Sure from the outside, everything resembled a dumpster fire when Pruitt accepted the job, but the Vols still had plenty of talent in their ranks to make some noise. Previous head honcho Butch Jones recruited well, which raised expectations. Back-to-back nine win seasons were certainly progress (before 2015 the Vols lacked a double digit win season since 2007). But bottoming out after those two years with a 4-8 campaign was enough for Tennessee to start fresh. Though the sheen had worn off of Tennessee's program, it's not like Pruitt inherited a bare cupboard. Entering this season, all the previous four recruiting cycles saw the Vols command a top25 recruiting class with all but one being top18. Nationally, most programs would be ecstatic for that kind of prowess on the recruiting trail. Within the context of the SEC, however, Tennessee's last four classes ranked either seventh or eighth within the conference. As strong as the roster was, it was just an average one within the SEC at the end of the day.
After a season of laying the foundation, Tennessee entered 2019 with confidence it could take the next step. With a good amount of returning starters and soft non-conference slate, many expected the Vols to go bowling and get back to eight or nine wins. But, someone apparently tied their shoes together before the starter's pistol. The Vols began the season 0-2 after home losses to Georgia State and BYU. Much of the same ailments that derailed the Vols in 2018 lingered on both sides of the ball. They couldn't forge run lanes, they lacked a difference maker on the ground, their passer seemingly held onto the ball far too long, turnovers were far too frequent, and their defense was on the field far too often.
New Offensive Coordinator Jim Chaney brought his mundane scheme over from Georgia. While the Dawgs often throttled teams by being bigger, stronger, and faster, Tennessee collectively lacked those key attributes. Chaney really didn't have to scheme too much in order for Georgia to take care of business. And when presented two noncons to start the year, Chaney never looked to get fancy in Tennessee's first two games. Over their first 148 snaps, only three concepts received more than ten reps: Outside Zone Off-tackles, All Verts and Outside Zone Sweeps. No other run concepts received more than four tries their first two games. From there, Tennessee had a concerted effort to be more unpredictable and work the ball inside. Over their next four games, the Vols displayed more variety in their run game, which resulted in decent efficiency figures. Tennessee sported at least a 50% Success Rate in each of its next three games as four run concepts alone were repped 14 or more times. While Off-Tackles' usage remained, Inside Zones and Duos started getting more action. Shots plays and All Verts remained their go-to method for moving the ball downfield through the air.
While the ground game was able to win its spot battles, the Vols overly fell flat against the likes of Florida and Georgia. Those defeats paired with the two noncon losses had the Vols staring right at 1-4. With three games of Passing Success Rates under 33%, Pruitt felt a change was needed to rally his troops. Jarrett Guarantano was largely viewed at the sole catalyst to why Tennessee's offense couldn't take off. Whether it was his Eli Manning demeanor or general inaccuracy, Guarantano was supplanted by freshman Brian Maurer. Even before the primetime tilt versus Alabama, the two had a bit of a carousel going on due to Guarantano's unsatisfactory play behind center. By Maurer's stats and film, this was a bold move the say the least. But with a hated rival coming to town and with all the bright lights shining, Pruitt gave Maurer the nod against the Crimson Tide. Despite a decent start with some RPOs padding his numbers, Maurer was concussed and left the game. Before JG even got cold waiting on the curb, Pruitt thrusted him back into the lineup.
You know what happened that night. I know what happened that night. Pruitt and Guarantano know what happened that night. Things hit a fever pitch and everyone involved was noticeably frustrated with how things were unfolding. But to their coach's credit, the Vols came together and started winning games after that point. It would have been a natural breaking point for many, but the Vols stuck to their guns and dug in for the last month plus. The Vols managed to skirt by winning marginal football. The SEC average offensive Success Rate this season was 43.6%. The Vols failed to break that plateau after Week 8 despite not losing a game after that point. On the season, only the Georgia State and Chattanooga games saw the Vols sport clips above the conference average offensively. I don't want to say the Vols were lucky, because their schedule was full of winnable games down the stretch. But to play with such a small margin of error usually doesn't result in six straight victories. The magic number appeared to be 24. All five of Tennessee's losses saw their defense surrender more than that amount. All seven of their wins held opponents under that figure.
Looking at the nitty gritty elements that catch my attention, there are plenty of things the Vols did to influence their winning even if their down-to-down Success Rate was subpar. Now, this isn't next level thinking. But the Vols were more efficient scoring, creating chunk gains, limiting sacks, and curbing turnovers per snap after Week 8. Tennessee's Touchdown and Turnover Rates placed inside the bottom2 of the SEC the first eight weeks. It's hard to win that way. While they hit on an occasional bomb or downfield throw, their Explosive Run Rate was the SEC's floor. Even with a decent Pressure Rate allowed, the Vols' 3.86% Sack Rate only bested Mississippi State's and Texas A&M's before Week 9. The Vols before and after Week 9 were very consistent in the number of plays they ran per game. From Weeks 1-8, Tennessee averaged 62.9 plays/game compared to 62.0 from Weeks 9-end. With such few plays, their rate stats were more likely to fluctuation and show signs of growth/regression. Hitting on two additional 20-yard passes won't move the needle much for a team that runs 100 plays. But for a team that runs 50, that can be quite an uptick in on-field execution.

Sacks and turnover plays are hard obstacles for a middling offense to hurdle. But once those two areas were addressed and reduced, the rest fell into place. Both stats were basically cut in half, which led to more fruitful drives and less strain on Tennessee's defense. The Vols' run game went from average to bad despite the rise in big gainers. Since the ground game failed to remain consistent, Tennessee found themselves passing more after Week 8 than before. Despite more dropbacks, the Vols still preferred to be an early down run team. With the lack of success, this meant they played their fair share of third downs. This is not a strategy I would recommend. Living and dying on the money down certainly makes the game smaller, but it's also a very risky play to expect to succeed in those spots consistently. From Week 9 on, Tennessee converted 45% of their 3rd Downs; only LSU and Alabama were better in that stint. While I'd advise against that modus operandi, the Vols stood tall and defied the odds.
Outside of that, Tennessee was noticeably more explosive. In the Kentucky game especially, the Vols' ability to win contested, downfield passes turned the game on its head. In the Vanderbilt game, long carries vaulted freshman Eric Grey into the limelight as a player to keep an eye on moving forward. Only Alabama boasted a higher Explosive Pass Rate -- or percentage of passes that net at least 20 yards -- after Week 8 within the SEC. Though their Passing Success Rate was about the season-long SEC average, it was one of the very best over the last month plus down-to-down.
Schematically, the Vols didn't chance too much. They mostly stuck with their zone looks with the occasional Duo Dive. But through the air, Tennessee saw a big uptick in Flood and Smash Variations over their last six games. Flood concepts Sails and Crosses along with the Smash wrinkle "Corners" all saw about 70% of their reps occur after Week 8. Of these three looks, only Sails experienced a decent return with a 46.2% Success Rate.
Versus conference opponents, Tennessee's defense was a mixed bag. On one end of the spectrum, Tennessee limited big plays and preventing offenses from flipping the field on them. Their 7.79% Explosive Pass Rate Allowed and 12.9% Explosive Rush Rate allowed both were good enough to crack the top5 in SEC play. Naturally with less big gainers ballooning up opponent's yards/play averages, the Vols donned the fifth best clip among conference defenses at 5.37 yards/play. Despite a bottom3 Pressure Rate, no SEC defense topped Tennessee's 7.61% Sack Rate versus conference opponents. Besides scoring touchdowns instead of settling for field goals, no two elements have such a strong correlation with wins and losses than winning the sack and explosive play battle. Again, those are two spots where the Vols' offense drastically improved over their last five games. Their defense remained firm in both aspects, which provided their offense opportunities. This in turned made it much more difficult on opponents to score on any given snap. The Vols only allowed a touchdown on 3.89% of the defensive snaps facing SEC offense, which was the fifth best clip in conference play.
Despite excelling at game-altering plays, Tennessee wasn't the best defense down-to-down in SEC play. Their 42.8% Defensive Success Rate finished inside the bottom5. Though they prevented the big play, they allowed teams to nickel and dime and stay on the field. Besides their Defensive Success Rate, the Vols finished bottom5 in Takeaway Rate (1.30%) and Three-and-Out Rate Forced (30.2%). Despite the fourth best rush yards before contact clip, the Vols were average defending the run situationally. The bend-don't-break mentality might have had bad optics at times. But Tennessee's defense still was this team's strength. Even by the archaic "Total Defense" statistic that views all yardage equally, the Vols finished with a top25 defense nationally. In the eyes of ESPN's SP+ metic that applies more context and weight to other aspects like field position, explosive gains, and other good stuff, Tennessee had the 19th best defense in college football.
Tennessee's favorite run looks
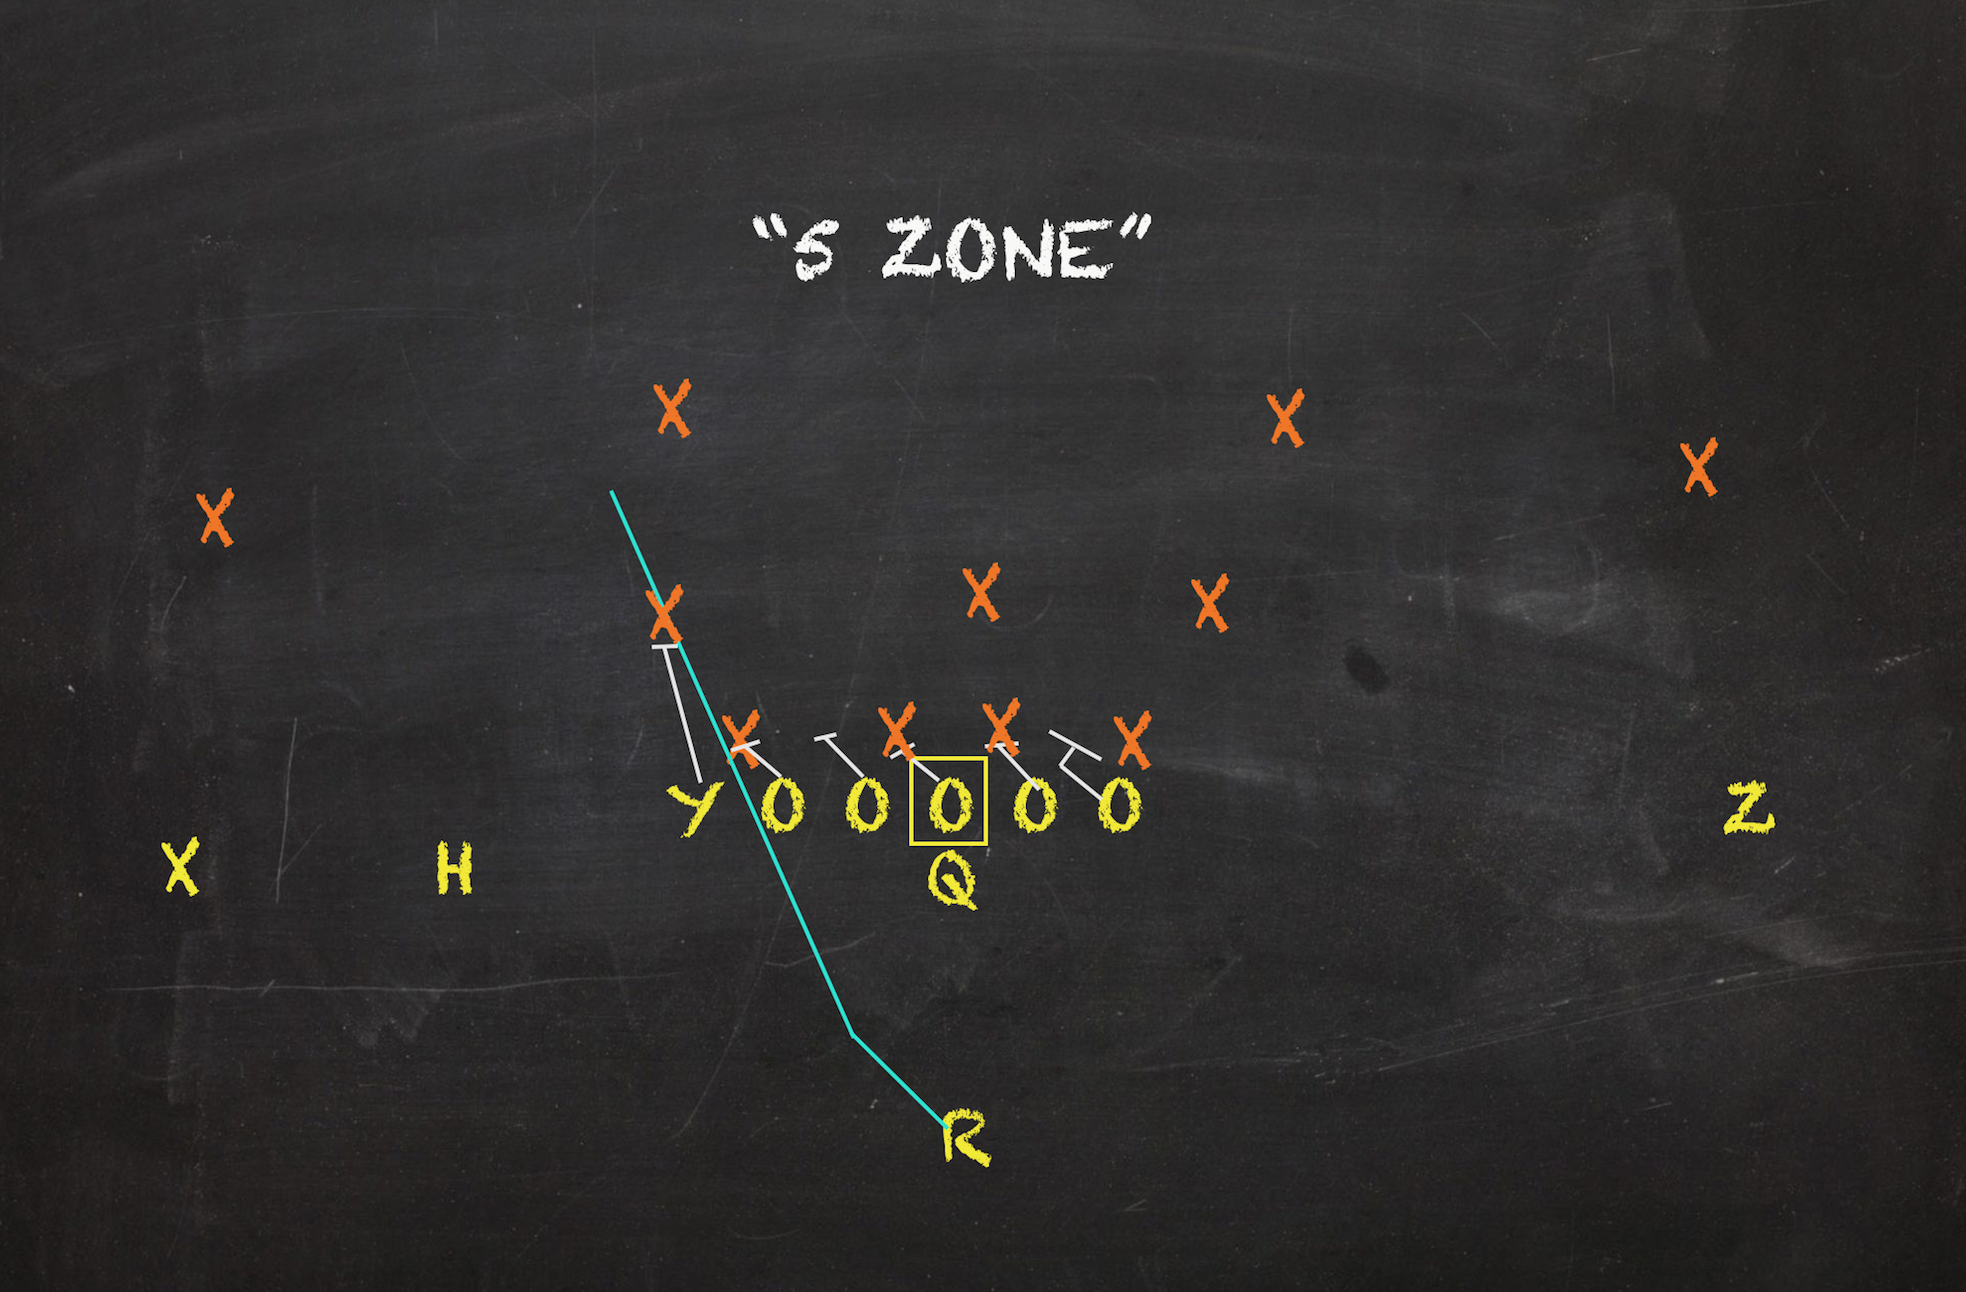
1. Outside Zone Off-Tackle 11.9% Play Share 4.97 Y/A 46.4% Success Rate
The Outside Zone Off-Tackle was Tennessee's favorite play on the year. This slashing design aims to create a coordinated quick seal towards the sideline. Unlike other zones that do better if there is an element of vertical push towards the second level, Off-Tackles must take care of immediate defensive threats. If a playside defender crashes his gap and forces the ball carried back towards the middle of the field, it can doom this concept. Throughout the year, Tennessee would turn to this look to start a set of downs. Well over half of this play's reps took place on 1st Downs where Off-Tackles received 15 more chances than the next closest concept. But, these outside zones were flimsy at best in these spots as they sported a lower yards/attempt (3.87) and Success Rate (43.4%). While also being one of the Vols' most called plays on 3rd Downs, Off-Tackles rarely came thru on the money down. Only one of the seven Off-Tackles repped in those spots moved the chains.
Off-Tackles experienced their most efficient results on 2nd Downs. There, this outside-oriented design sported a 55.6% Success Rate while averaging 6.19 yards/carry. Much of Tennessee's offense was out of sorts the first three weeks of the season. But, Off-Tackles displayed their best consistency in that stint. In those three games, this look boasted a 56.1% Success Rate on a 6.68 yards/play average. This concept was called 41 times in the games versus Georgia State, BYU, and Chattanooga, which is the same amount of calls Off-Tackles received over the course of Tennessee's last six games. Though the lesser foes were weaker on the edge and put up less than a fight, Off-Tackles had less than a 40% Success Rate and 3.72 yards/attempt from Week 4 on. Still thanks to the volume of chances this look received, no other concept ended the year with more yards for this offense than Off-Tackles' 482.
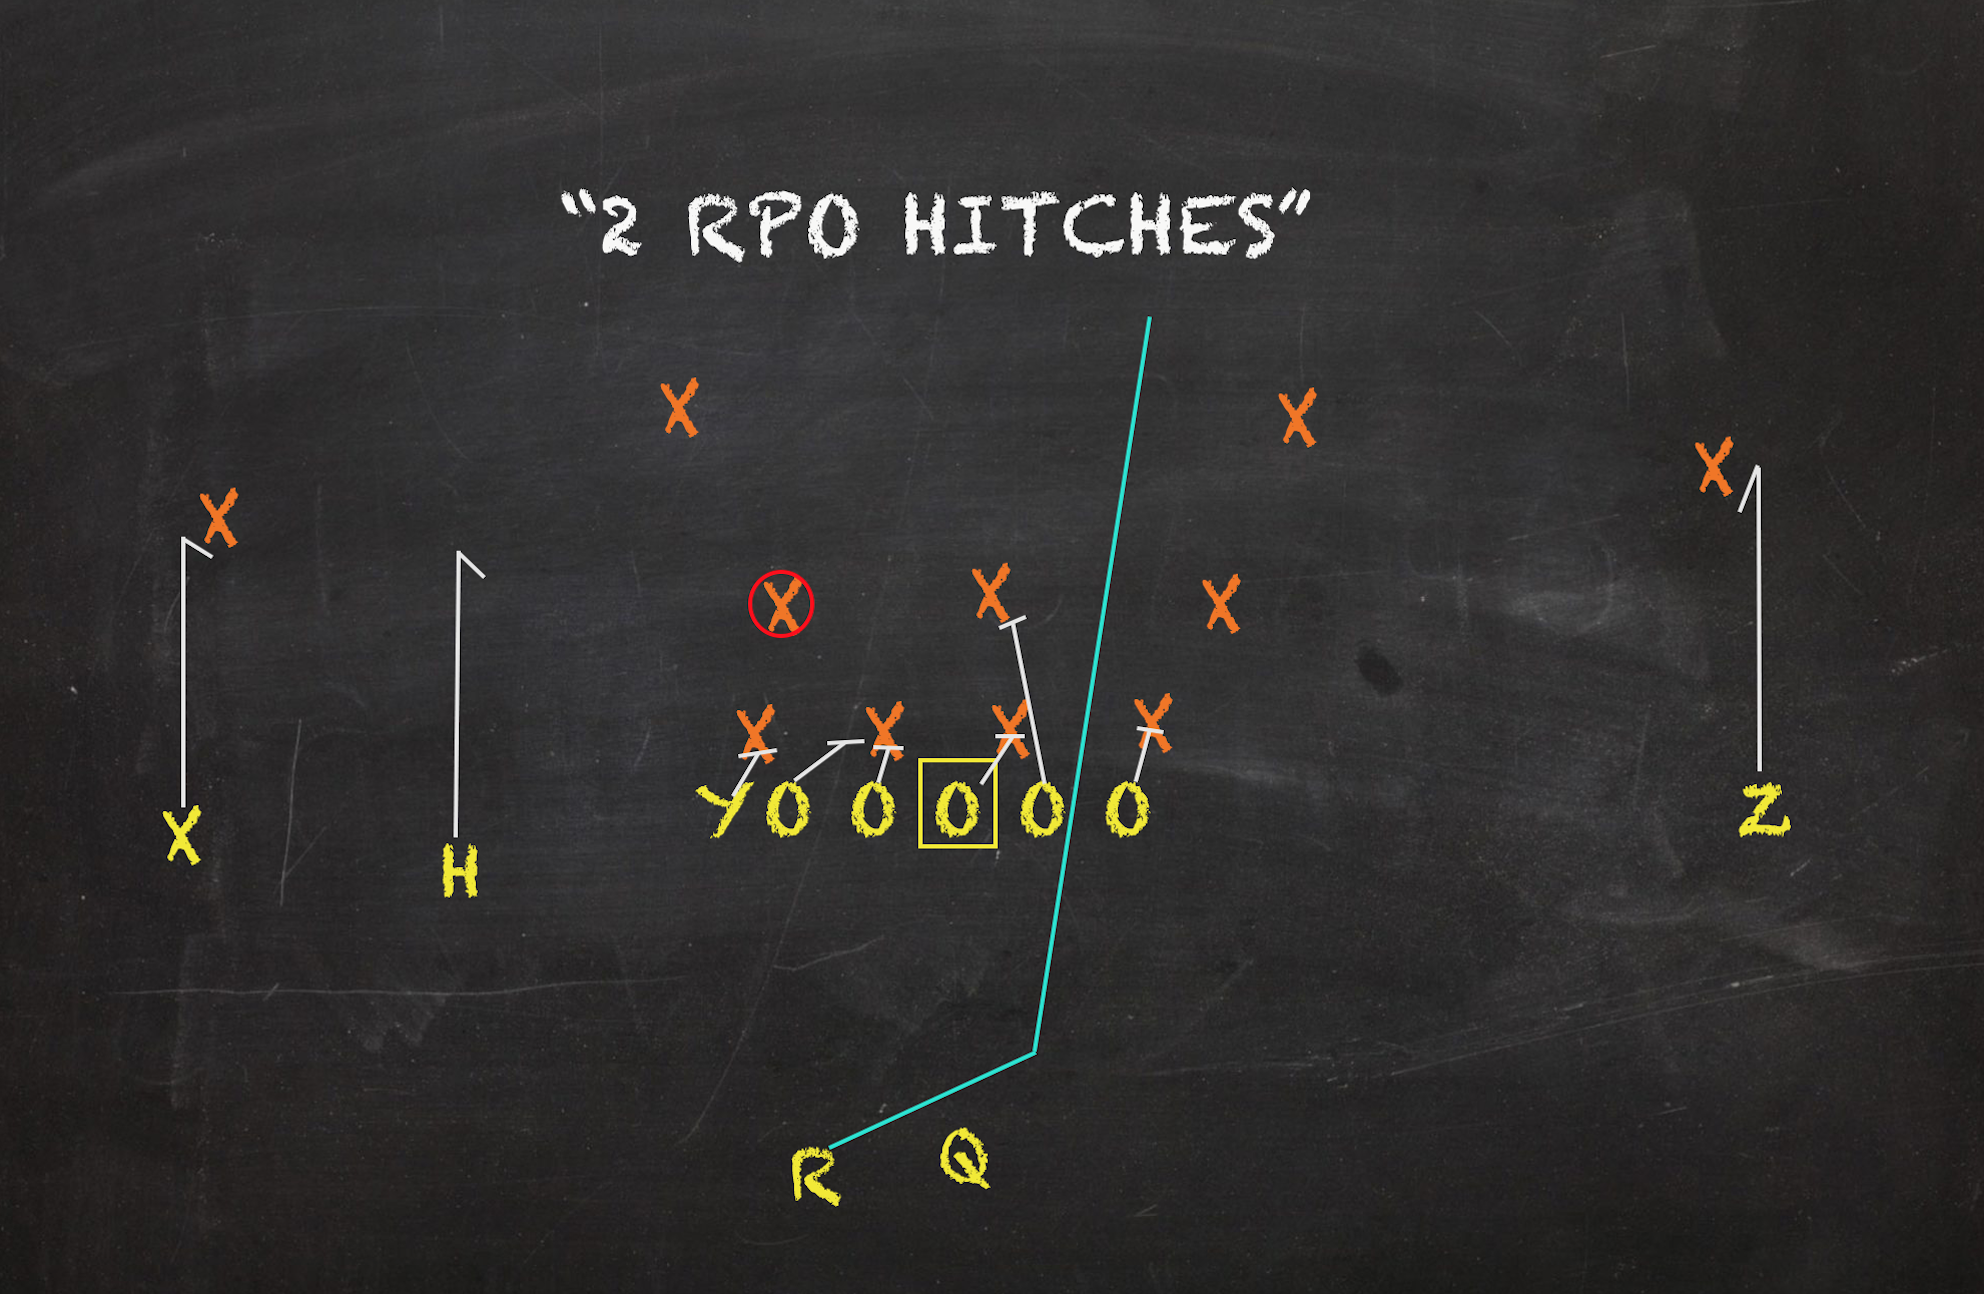
2. Inside Zone Slam Read 8.87% Play Share 4.67 Y/A 33.3% Success Rate
The basic Inside Zone Slam Read is one of the most common plays in modern football. But since its simplicity allows for a nice foundational look on which to hinge other offensive concepts, this concept's usage varies from staff to staff. Some unabashedly call this play over and over no matter the results. Others use this to keep the defense honest and provide an avenue for their quarterback to steal some yards in the read game. Most attach route tags on top of these to create RPOs. Tennessee watered down this look as much as possible. By my discerning eye, Tennessee's passers always had a read on the backside and could run if necessary. But Vol passers overwhelmingly opted to hand the ball off to their back on these plays. On all Inside Zone Reads, Jarrett Guarantano and Brian Maurer combined for 7 attempts for 24 yards on a 42.9% Success Rate.
In general, no SEC offense was as RPO-resistant as the Vols. Less than 38% of Slam Reads were used in such a way. The more straightforward aspect helped Tennessee see better results. RPO Slam Read runs only averaged 4.26 yards/attempt on a horrendous 22.2% Success Rate. Their non-RPO counterparts sported a 40% Success Rate averaging just under 5 yards per pop. Either way, the minimal variation on who received the ball allowed defenses to be aggressive and often dismiss the quarterbacks as a threat to run. For the most part, the Vols lost when this look was called as only a third of its tries resulted in success. Slam Reads from the gun were predominantly an early down play for this offense. Of the look's 72 reps, 65 took place on either 1st or 2nd Down. While frequently a letdown, Slam Reads racked up the third most yardage of any look for Tennessee's offense with 336.
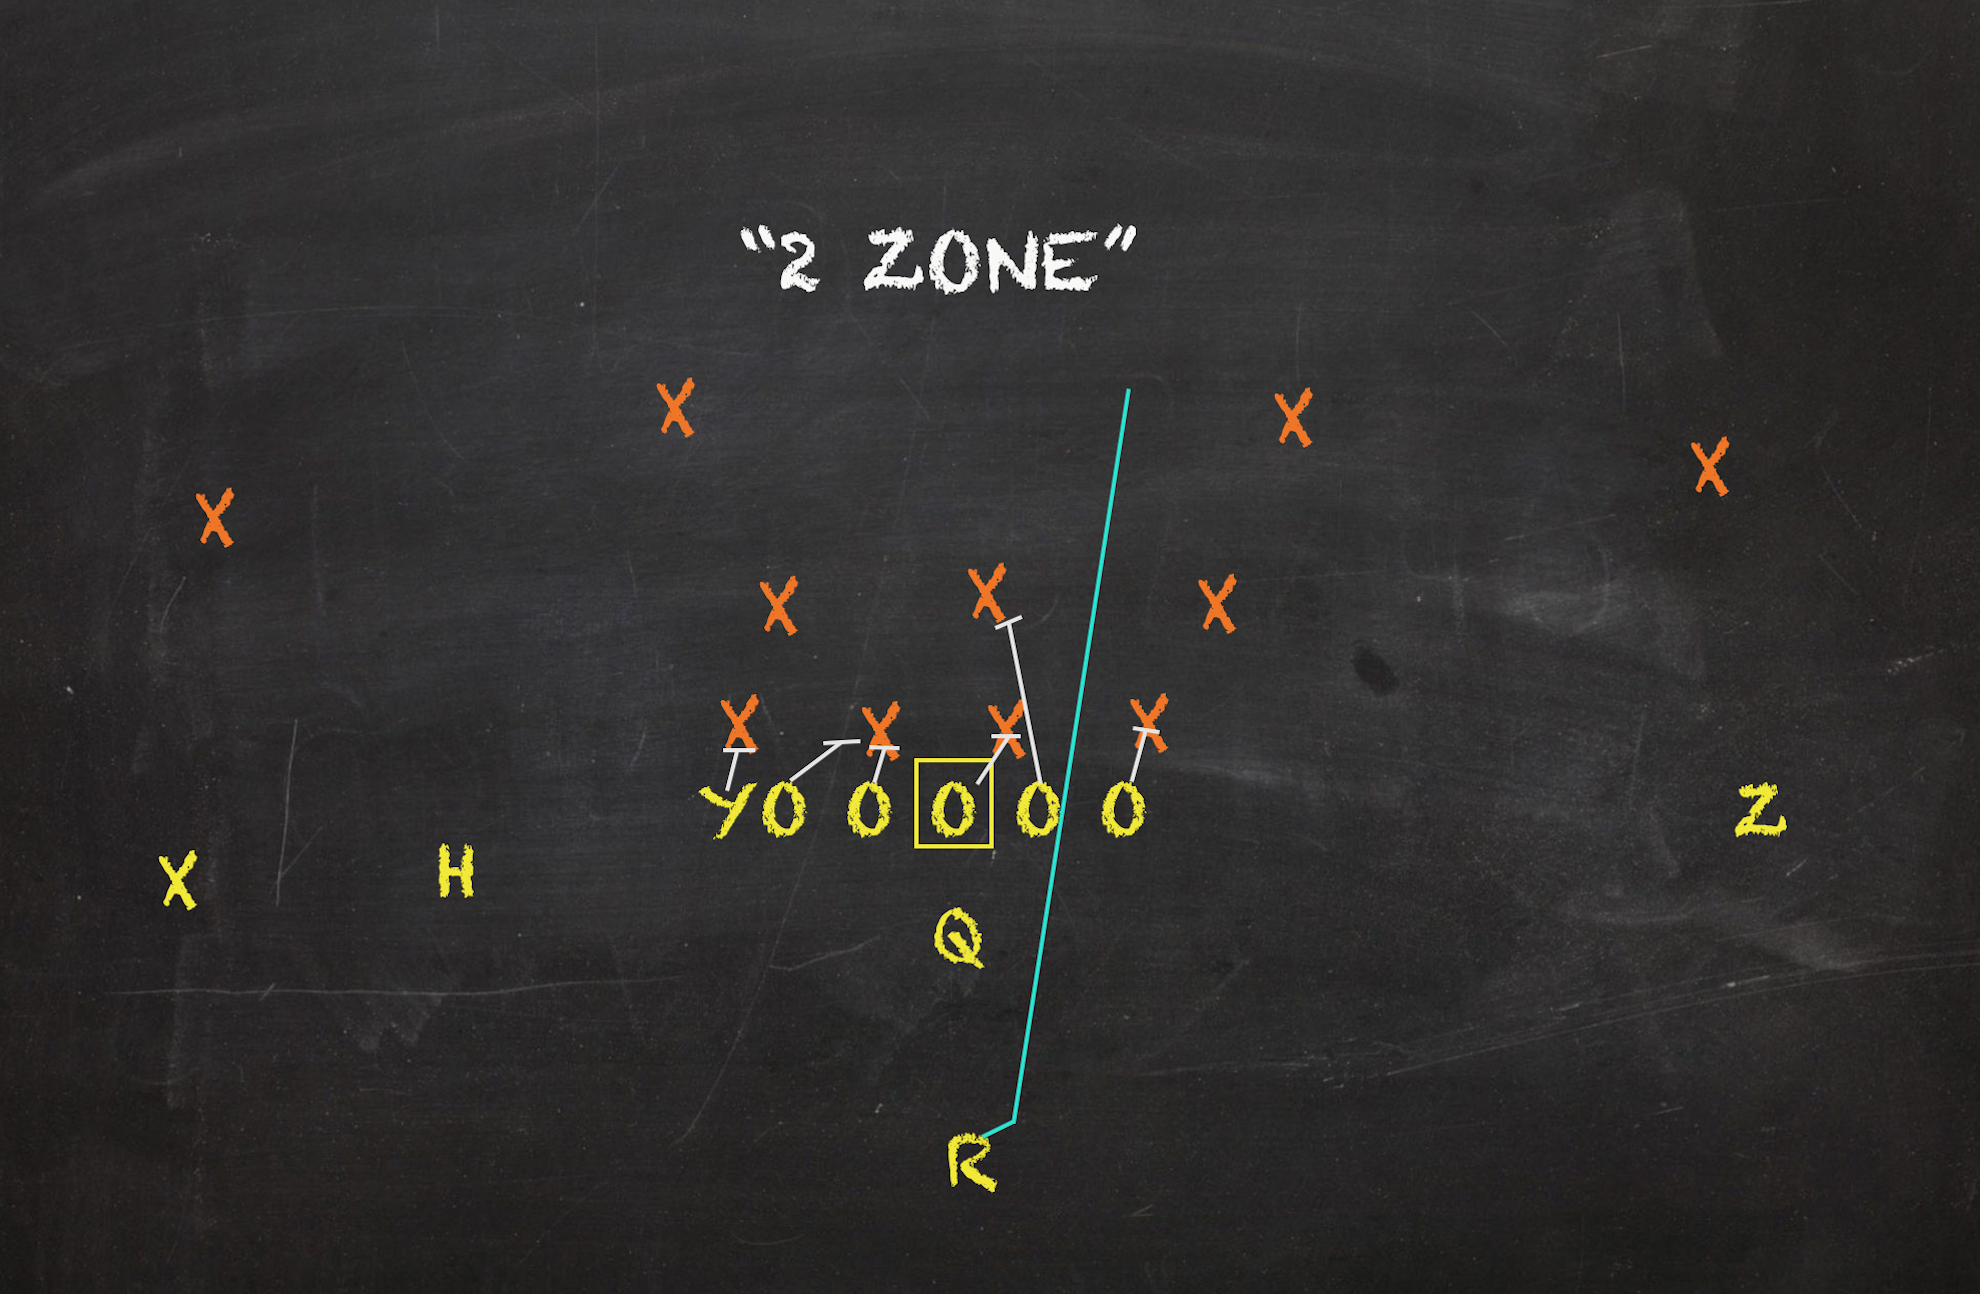
3. Inside Zone Slam 7.64% Play Share 5.87 Y/A 41.9% Success Rate
From either undercenter or from the pistol, Inside Zone Slams outperformed their read option renditions. Whether it was a mental thing -- "Okay, we have less failsafes in case this blows up so we better be great at the point of attack" -- or a schematic advantage -- Slams and Duos look very similar to one another and a quick audible can create a nice little gain -- Slams without read elements proved to be more effective for Tennessee's offense. For me, I fall into the camp of folks claiming savvy audibling helped this look see decent results. Slams and Duo Dives both initially aim to attack the B-gap between the guard and tackle. But since one is a zone and one is a gap play, they are naturally blocked differently. Since they exhibit similar appearances, defenses can get fooled briefly when attempting to diagnose the snap. This can create hesitation for these quick hitters to hit a hole and generate a modest gain.
Though non-read Slams weren't as featured as much the first three games as Off-Tackles, that's where the concept sported its best results. Expanding the window out more, Slams had a 53.6% Success Rate despite averaging less than 4 yards/carry the first six games. For what it's worth, Slam Reads in the same sample size only managed to produce poopy 18.5% and 3.3 clips, respectfully. But the SEC slate and a worn down OLine soon saw this look's down-to-down efficiency plummet. From the Alabama game and on, Slams saw an increase in potency as their yards/attempt increased to 7.71. However, less than a third of the play's reps since that game resulted in success. Despite the waning numbers down the stretch, Slams topped their read counterparts in both efficiency and volume. Slams gained 364 yards, which was the second most among any look.
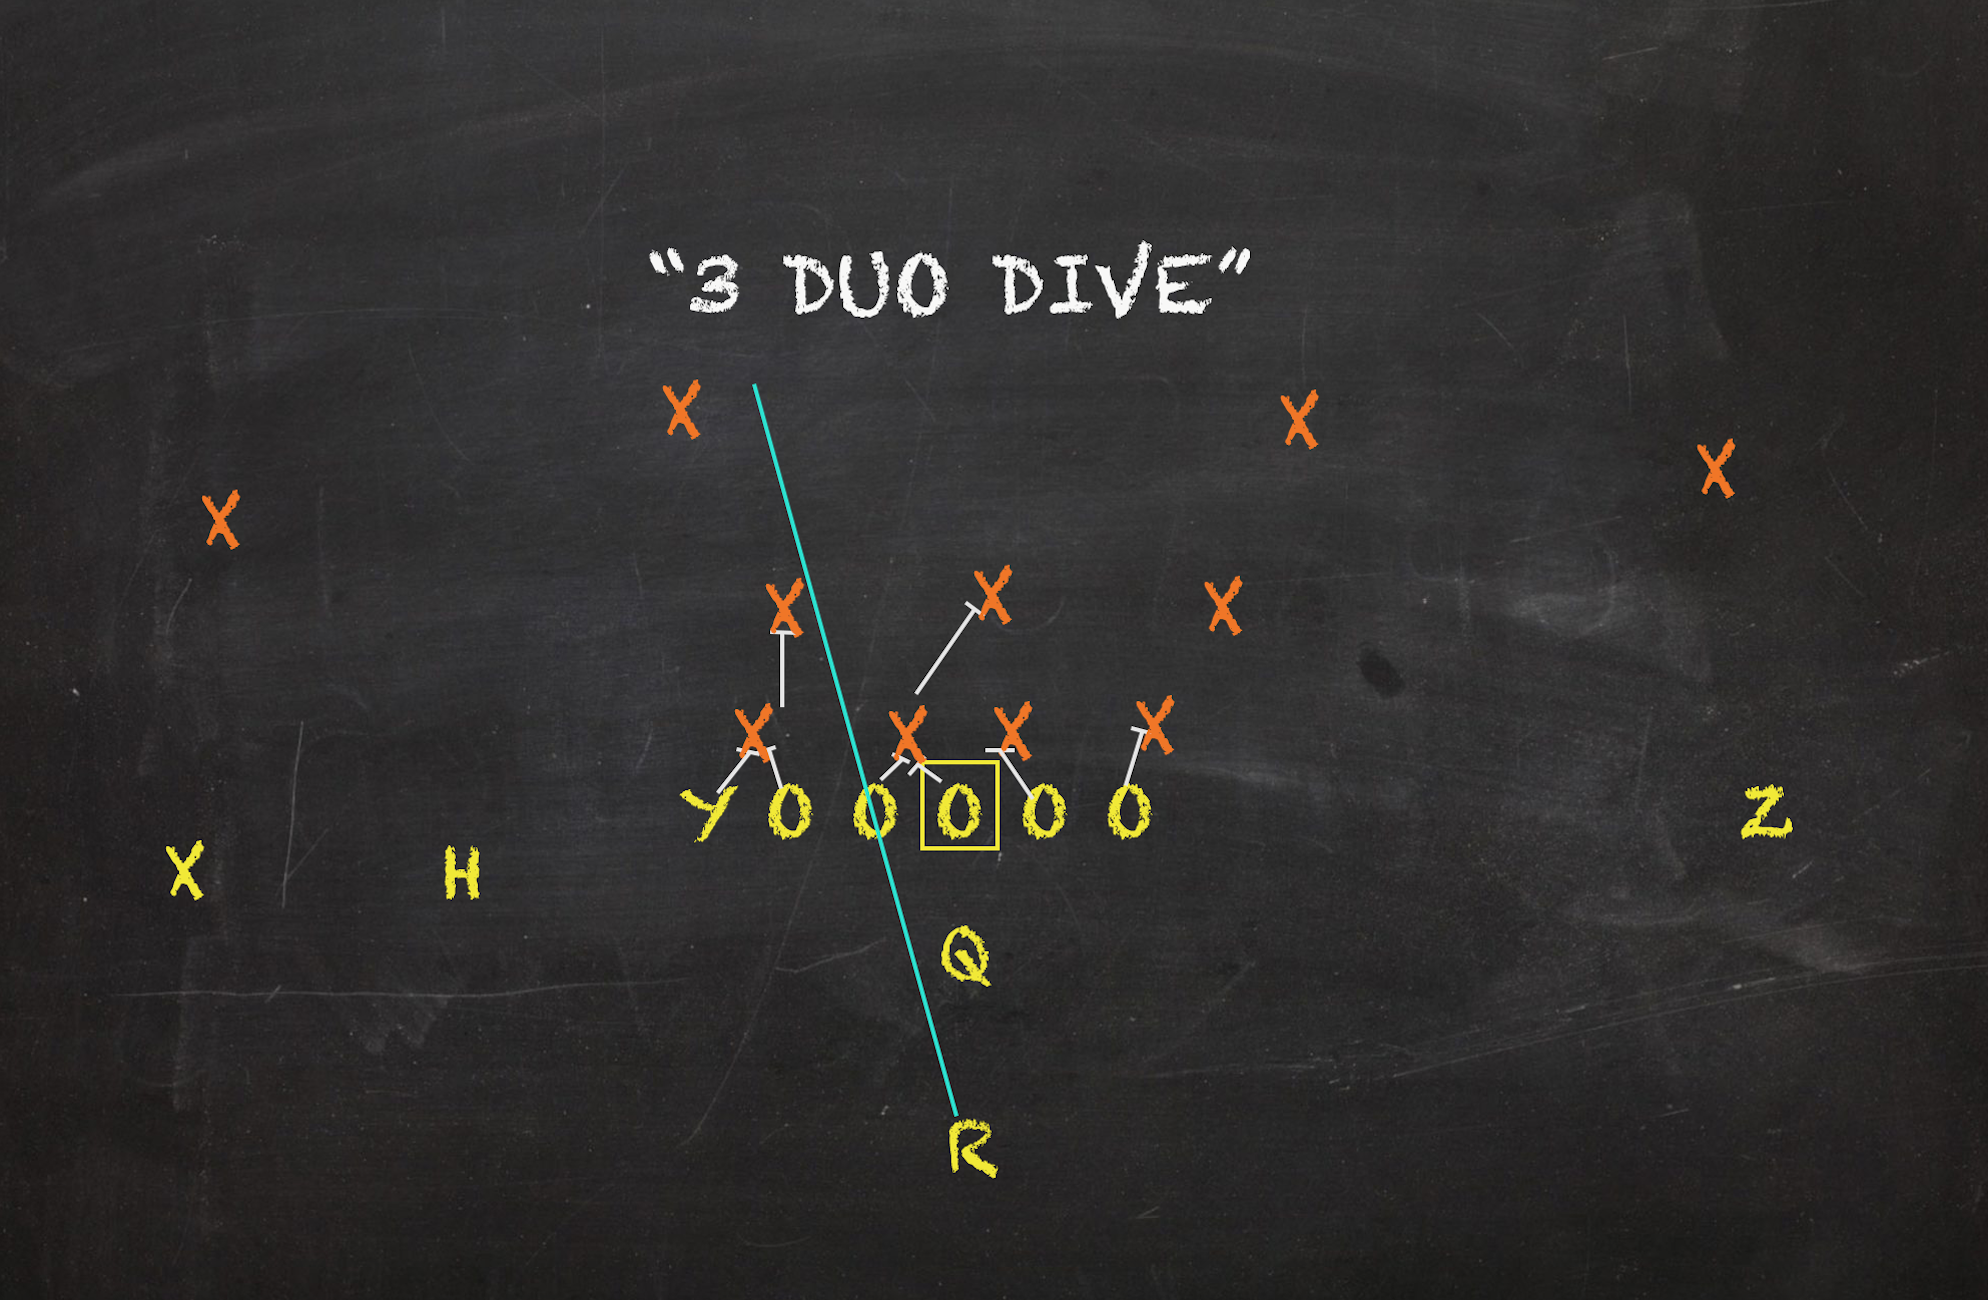
4. Duo Dive 3.94% Play Share 5.94 Y/A 56.3% Success Rate
Duo Dives aren't the most brilliant play designs. They are bang-bang designs than are entirely reliant on winning at the point of attack. This design aims to create as many playside double teams as possible hence the name of the look. All Duo Dives occurred either from undercenter or from the pistol in Tennessee's offense. The Vols picked their battles more with this gap play. The number of reps non-read Slams received almost doubled the tries Duo Dives received. Even with the disrespect on the play sheet, the prudence paid off when executing this look. Again since Dives and Slams both initially aim to hit the B-gap, they can compliment one another. Due to the fact each follows different blocking philosophies, defenses have to play them differently. The slight hesitation in diagnosing between the two can be the difference in a stuffed run and an explosive carry. No other run concept finished the year above the 50% Success Rate threshold for this offense. None of their five favorite ground looks averaged more yards/carry. While I'd like to say this look's output was the sole result of the Vols getting physical, much of the success came about from being advantageous on the defensive alignment.
While Slams soured after their strong start against lesser opponents, Dives emerged as one of the top concepts for this offense over the course of its last seven games. Though Duo Dives only averaged a call or two per game in that stint, the look's Success Rate and yards/carry never showed any signs of fluctuations. The Vols managed to put up a 56.3% Success Rate on this look during both the first six games and the last seven games. Duo Dives were pigeonholed into functioning strictly as early down plays for the Vols. Of the 32 Duo Dives over the course of the season, all but two occurred on either 1st or 2nd Down. Still, no other look among Tennessee's five most favorite runs or passes finished among the Vols' five most successful concepts.
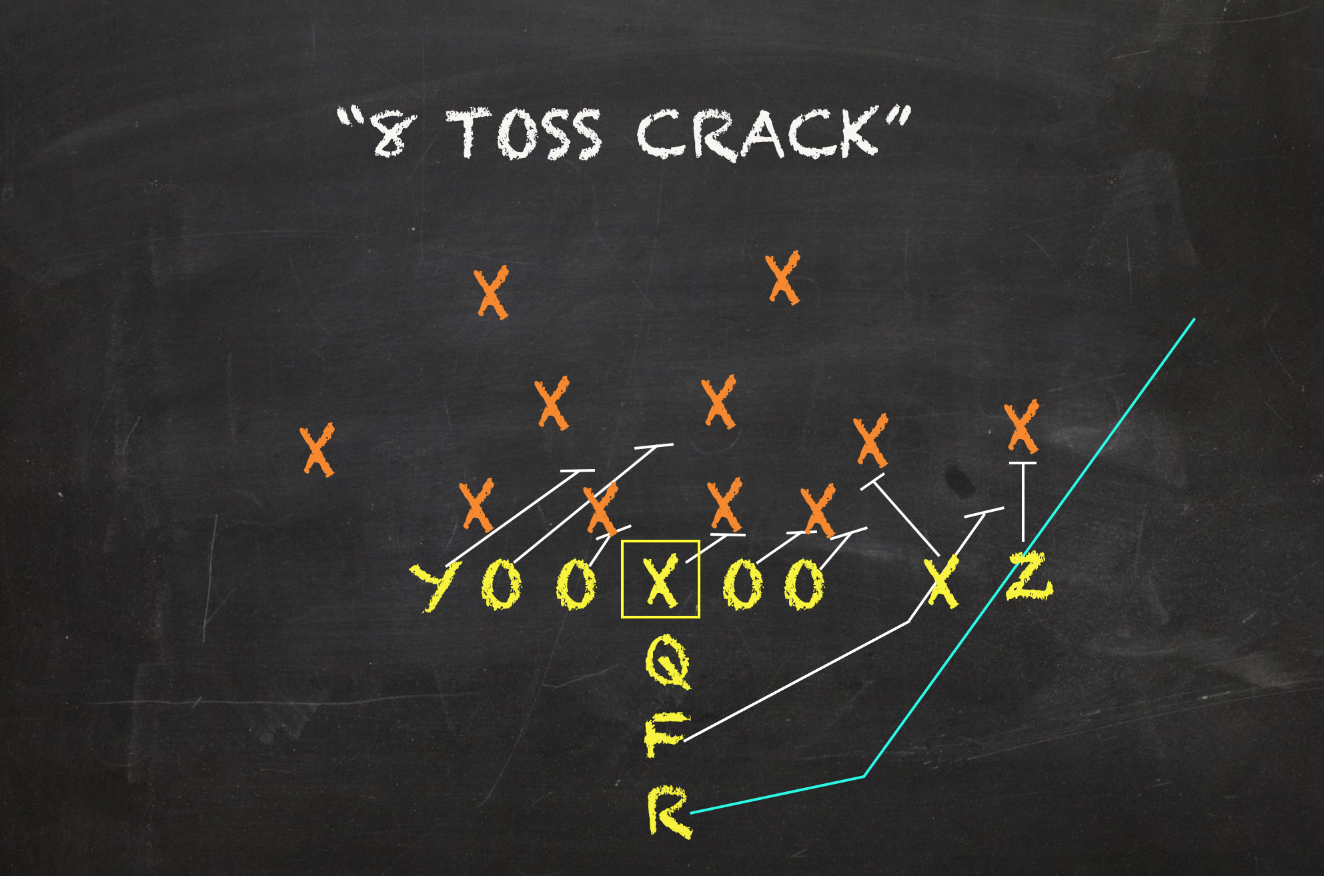
5. Sweep/Toss 2.71% Play Share 2.95 Y/A 31.8% Success Rate
When Tennessee sensed a vulnerability towards its opponent's perimeter, they aggressively went after the edge. Along with Outside Zone Off-Tackles, Tennessee featured Sweeps and Tosses as means to win on the exterior. The vast majority of Tennessee's run game didn't call for pulling lineman. Zones by default don't call for any of that. However, outside zones -- including Sweeps/Tosses -- can ask for "folds". Rather than calling for the typical zone flow, blockers can predetermine a pin/pull action to facilitate blocking. For instance if the playside tackle feels the edge might have outside leverage, he could ask the playside tight end to wash that end man down as the tackle slings around and engages the next outside defender. Most Sweeps/Tosses perform these blocks to make it easier on their lineman to secure the bookends.
Like Off-tackles, they saw quite a bit of volume during the first three weeks of the season. Nearly 60% of the Sweeps/Tosses Tennessee called this season occurred in the three games versus Georgia State, BYU, and Chattanooga. But no matter who was defending them, the Vols greatly struggled finding room to run outside of the tackles on this concept. Of their five favorite run concepts, none averaged less yards/carry or a worse Success Rate. Though this look was largely faded, it still managed to receive the sixth most reps of any look to start a set of downs with nine. But 1st Downs saw very poor results. There, the concept only put up a 22.2% Success Rate on a 2.33 yards/carry. While those bested what the look was able to produce on seconds, Sweeps/Tosses overall Success Rate was ballooned by the three successful reps on 3rd Down. Out of the I-formation with an extra lead blocker, the Vols called seven additional Tosses. These proved to be more consistent renditions averaging 4.29 yards/attempt on a 42.9% Success Rate.
Tennessee's favorite pass looks
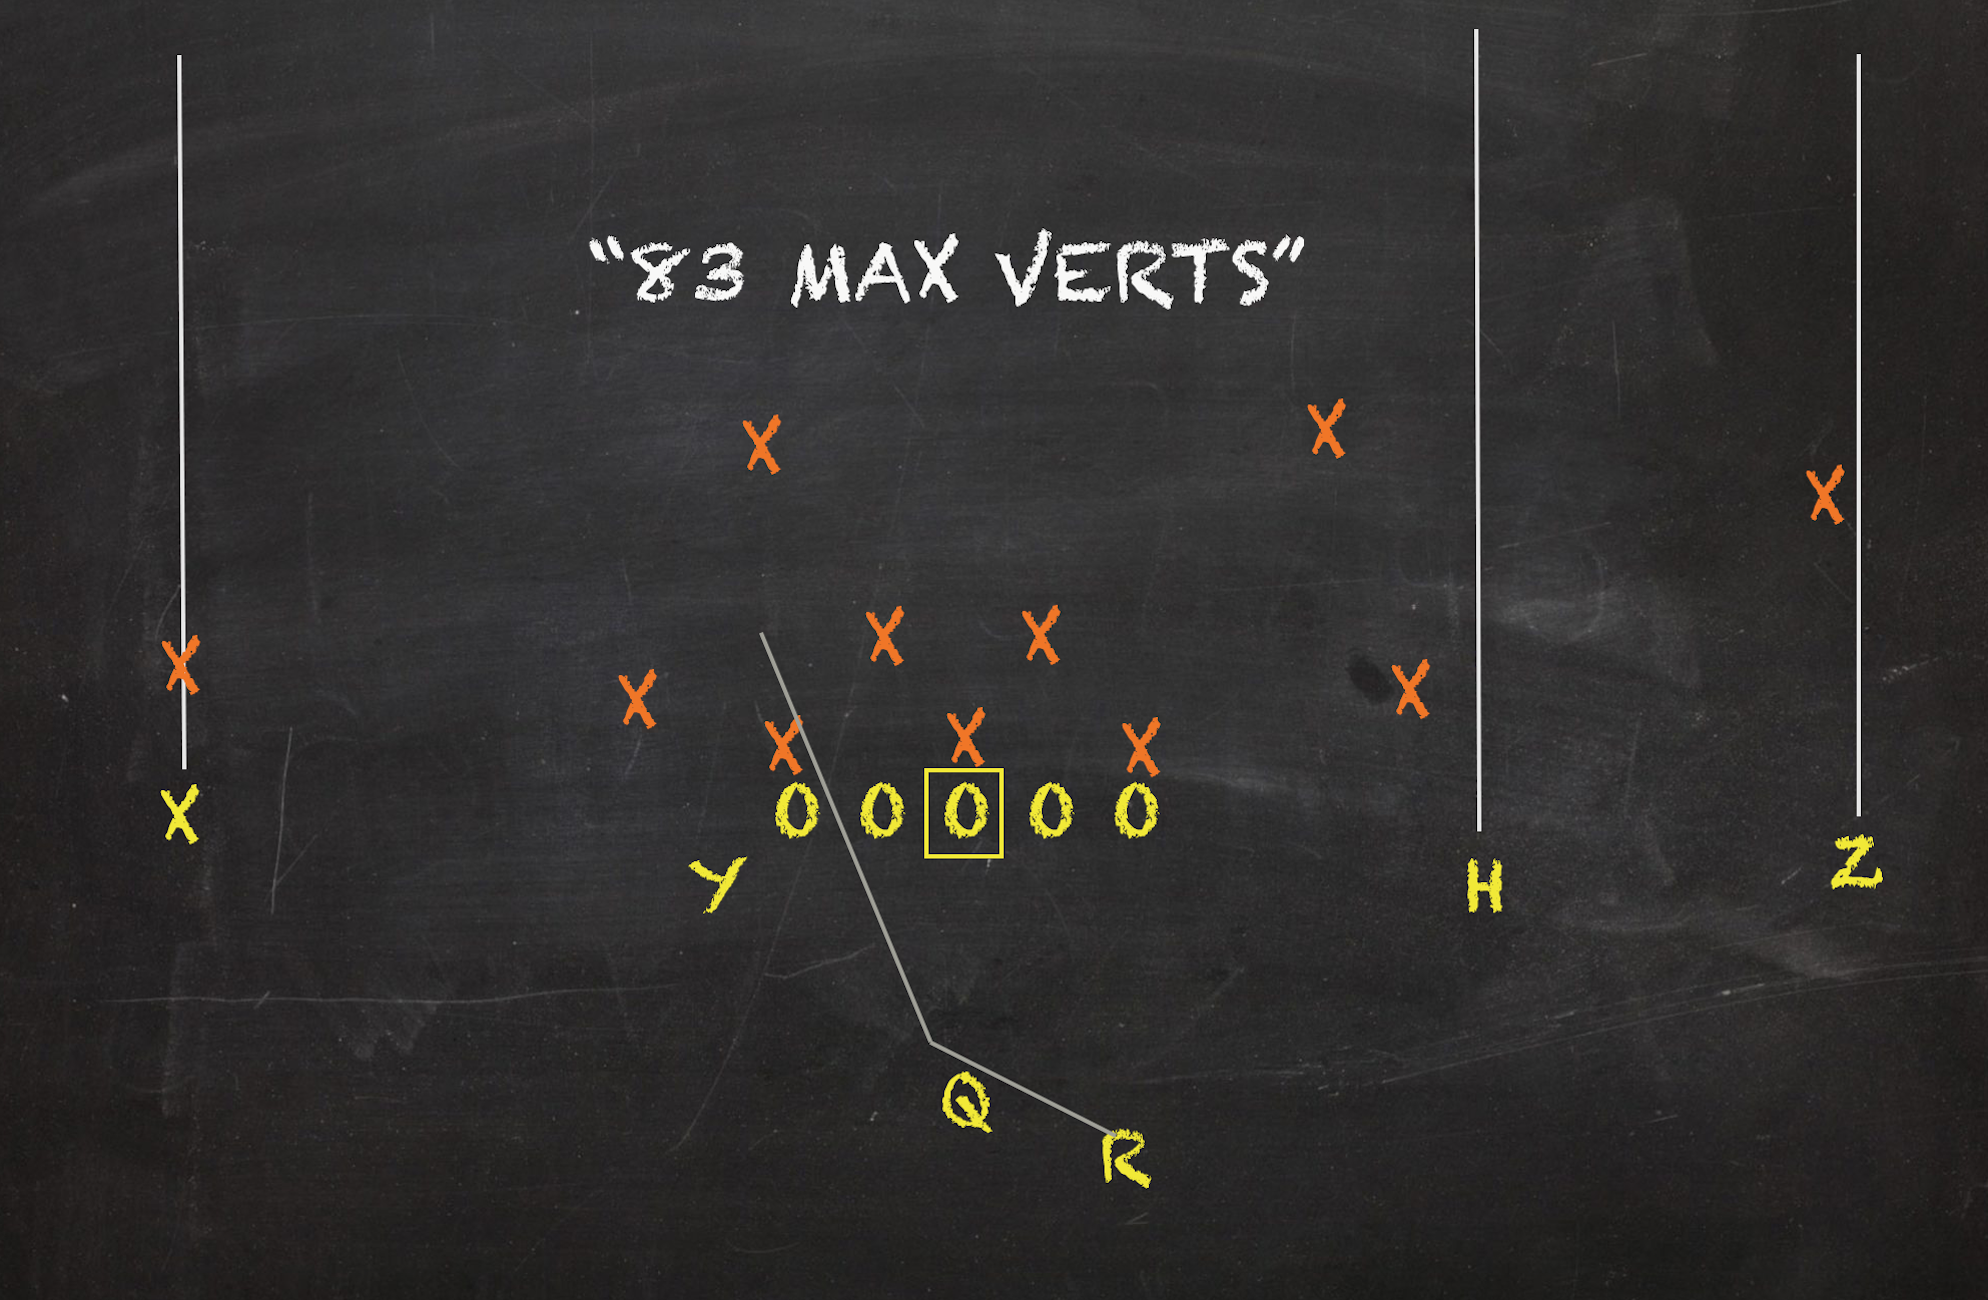
1. All Verts 5.54% Play Share 7.38 Y/A 28.9% Success Rate
While a handful of offenses turned to the All Verts pattern to bail them out of jams, no SEC program featured them as much in their regular offense as Tennessee. The 45 reps this concept received was 11 more than the next closest conference offense. While the look's Success Rate was consistent with the SEC average, only four schools with at least ten tries posted a better clip than the Vol's 28.9%. The pattern is exactly what it sounds like. Either with an extra blocker or two or going empty protection, this design is all about going deep with numerous streaks. Only Georgia's Jake Fromm had more attempts (23) and only LSU's Joe Burrow had more yards (289) off this look than Jarrett Guarantano. As far as Success Rate is concerned, only the Heisman proved more efficient targeting this concept than JG's 47.6% clip among SEC passers with at least 5 attempts.
With such an all or nothing play, Tennessee's offense hit an obvious wall when they were not connecting on this pattern. While sacks or pressured throwaways played roles in keeping All Verts from reaching optimal levels, there was a noticeable uptick in this play's production after the Alabama game. From Weeks 1-8, Tennessee only connected on 7/19 All Vert targets. From Week 9 on, 60% were completed with Guarantano going 6/8 with all but one catch going for a first down or a score. With how conservative their early down play calling was, finding production out of this boom-or-bust design provided this offense with plenty of spark plays down the stretch. Though a microcosm of this unit's great shortcoming of playing efficiently, there's no denying All Verts' effectiveness to turn ball games. Only one look saw more than nine reps for this offense on 3rd Downs; that concept was All Verts, which commanded 16 tries on the do or die down. Again, its a common tactic to call All Verts when behind the chains or when your back is against the wall. In those spots, this pattern often falls flat the Vols were no exception to that as the look sported a 19.2% Success Rate across its 26 reps on 2nd and 3rd Downs. But when defenses were unsuspecting or back on their heels, the Vols found decent success targeting All Verts on firsts. There, it operated as Tennessee's favorite pass play while putting up a 10.6 yards/target and 42.1% Success Rate.
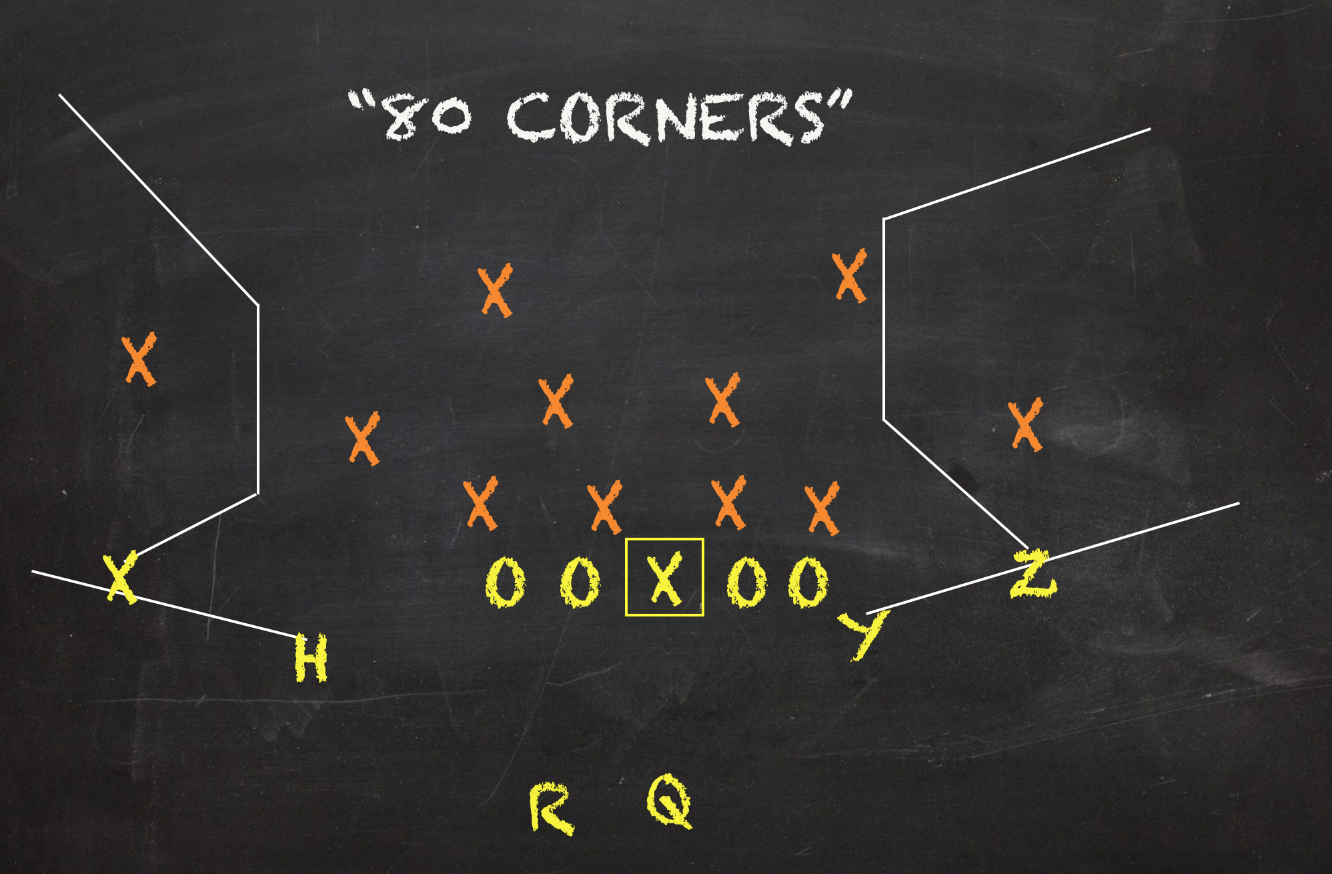
2. Corners 3.08% Play Share 4.88 Y/A 36.0% Success Rate
The Corners wrinkle was next in Tennessee's passing game pecking order. Though this inverted Smash pattern saw an increased usage after Week 8, this concept stubbed its toe way too much for it to be among Tennessee's most targeted aerial concepts. Among the Vols' five most called passes, only All Verts finished with a lower Success Rate. Sometimes referred to as "Shakes", Corners creates a high-low read along the sideline with the outside man running a "C" corner with the inside one running towards the flat. Before Week 8, all five all this concept's targets came from freshman Brian Maurer. Counting the Alabama game onward, 18 of the 20 targeted Corner concepts came about with Guarantano in the game. Tennessee used Corners as a mirror -- meaning it was executed on both sides of the formation -- or paired it with weakside floods principles.
No game featured this concept more than Tennessee's bowl game versus Indiana. Receiving the fourth most calls of any look (most of any pass), Corner saw six reps in the Belk Bowl, which was about a fourth of its overall chances for the year. No matter who was quarterbacking, the down and distance, or who the opponent was, Corners largely disappointed. At least on 2nd Downs where over half of the concept's reps occurred, Corners posted a decent 46.2% Success Rate. But no down saw the look's yards/target eclipse 5.5 yards. For a pass pattern, that simply will not cut it.
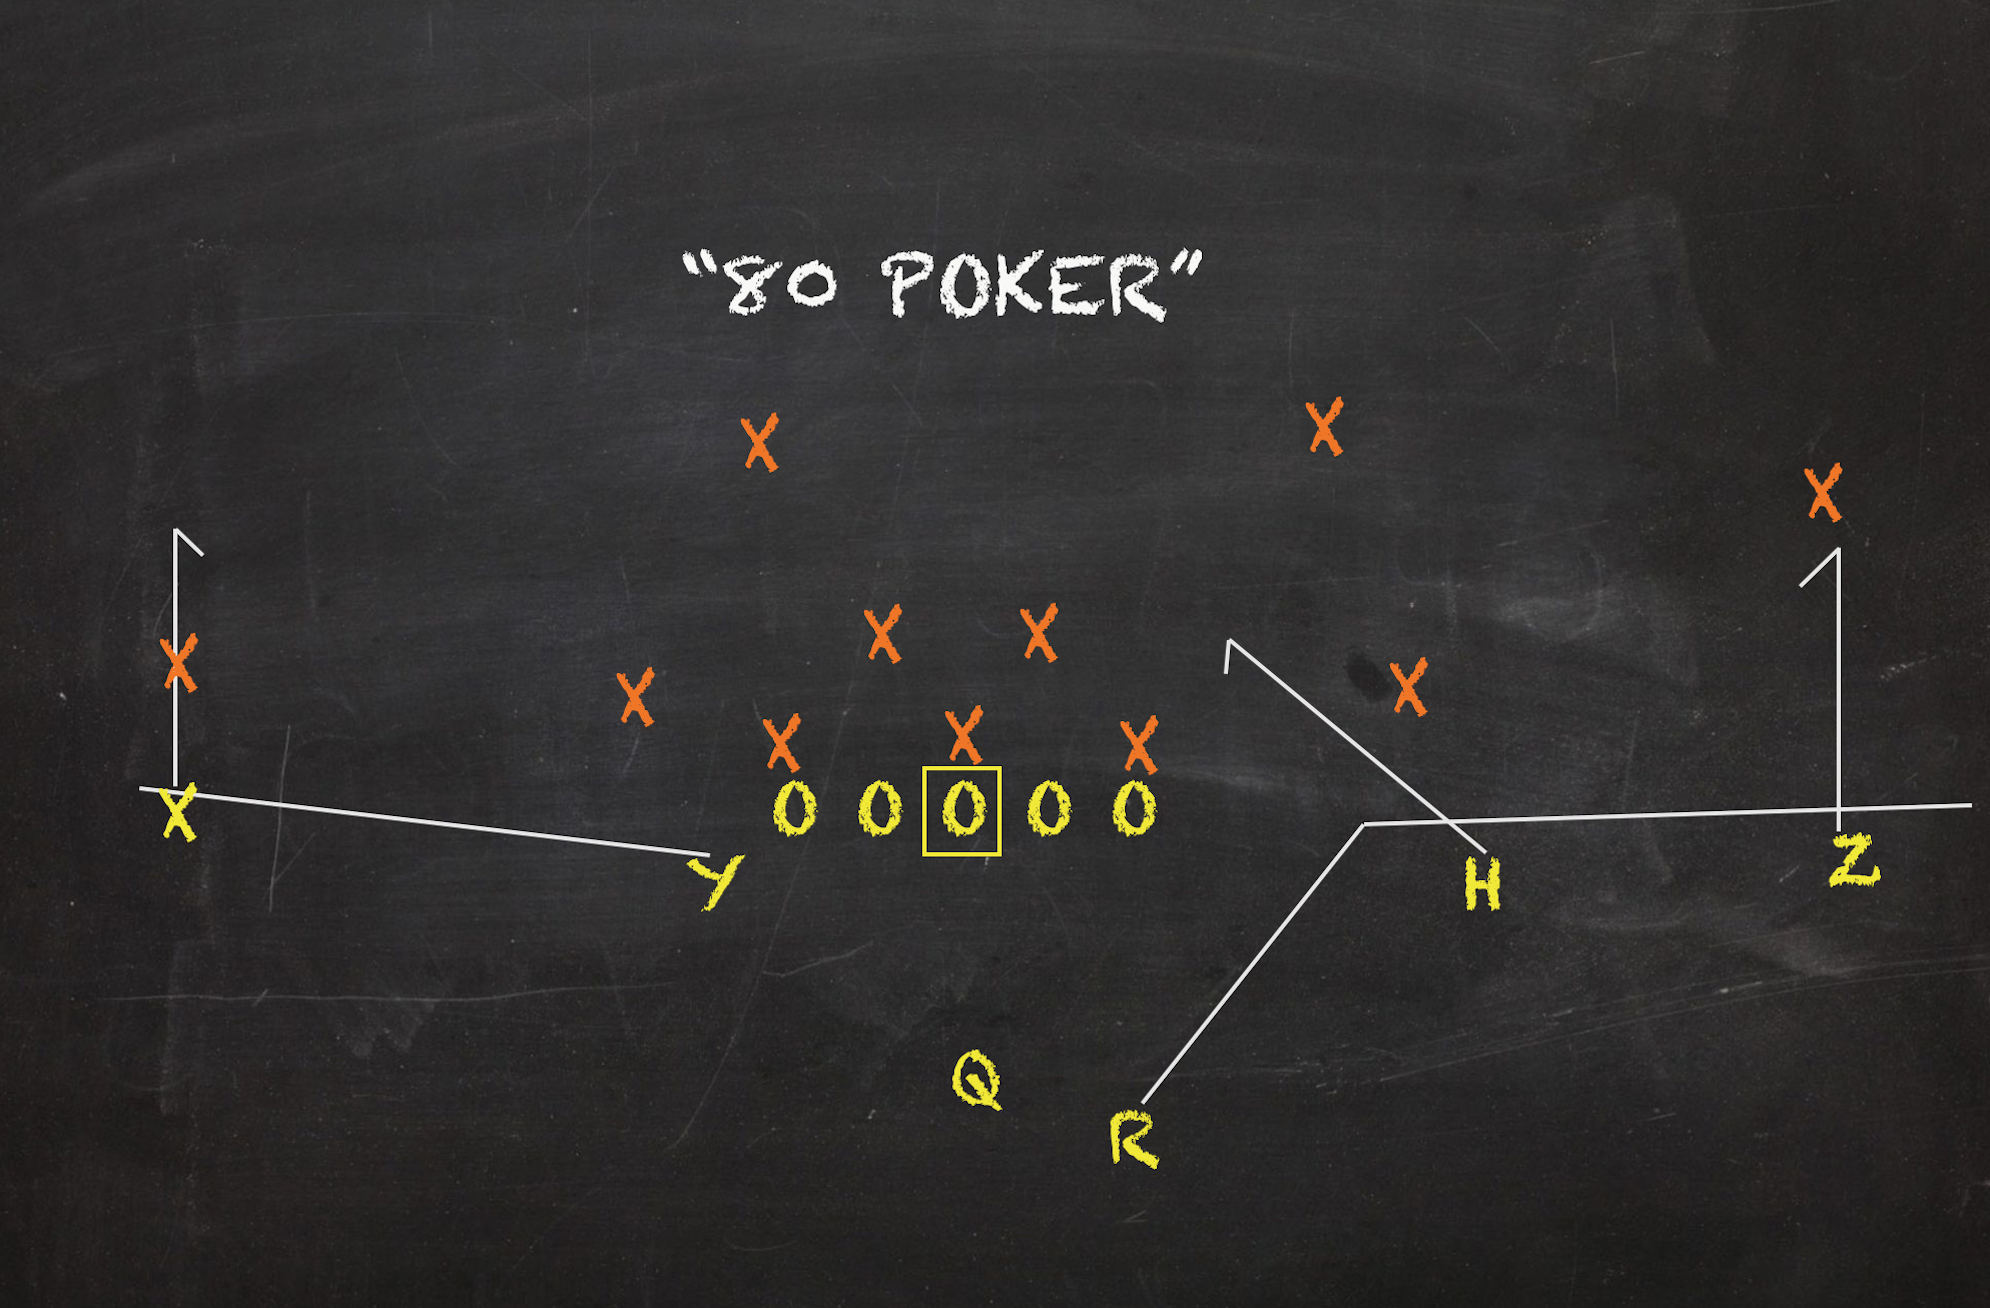
3. Spacing/Curl+Flat 2.34% Play Share 3.84 Y/A 38.9% Success Rate
Spacing or Curl+Flat combos aim to stress defenses horizontally. Since zone coverages offer up 3-5 underneath defenders, this concept is all about stretching those defenders to their breaking points sideline to sideline. These don't require nifty route runners or nuanced timing in order to win but rather spatial theory. Even electric professional offenses like Andy Reid's Kansas City Chiefs turn to these patterns from time to time as means to win short. As bland and mundane as it is from a design standpoint, this concept often can kind holes in zone coverages if run out of the right formation. Despite featuring Spacing and Curl+Flat elements the third most in the SEC, Tennessee finished below average in both yards/target and Success Rate.
Though this rudimentary route combo resulted in a completion on 75% of targets, it just wasn't a good look for this offense. With pretty even distribution across all downs, early downs saw the worst returns. The eleven targets this look commanded on 1st and 2nd Downs saw a mere 27.3% Success Rate. But despite the shortcomings in those spots, Spacing/Curl+Flat combos were the Vols' best pass pattern on the money down. While receiving the third most reps of any look on thirds, this concept sported a 57.1% Success Rate, which was the highest of any pass play with at least six tries.
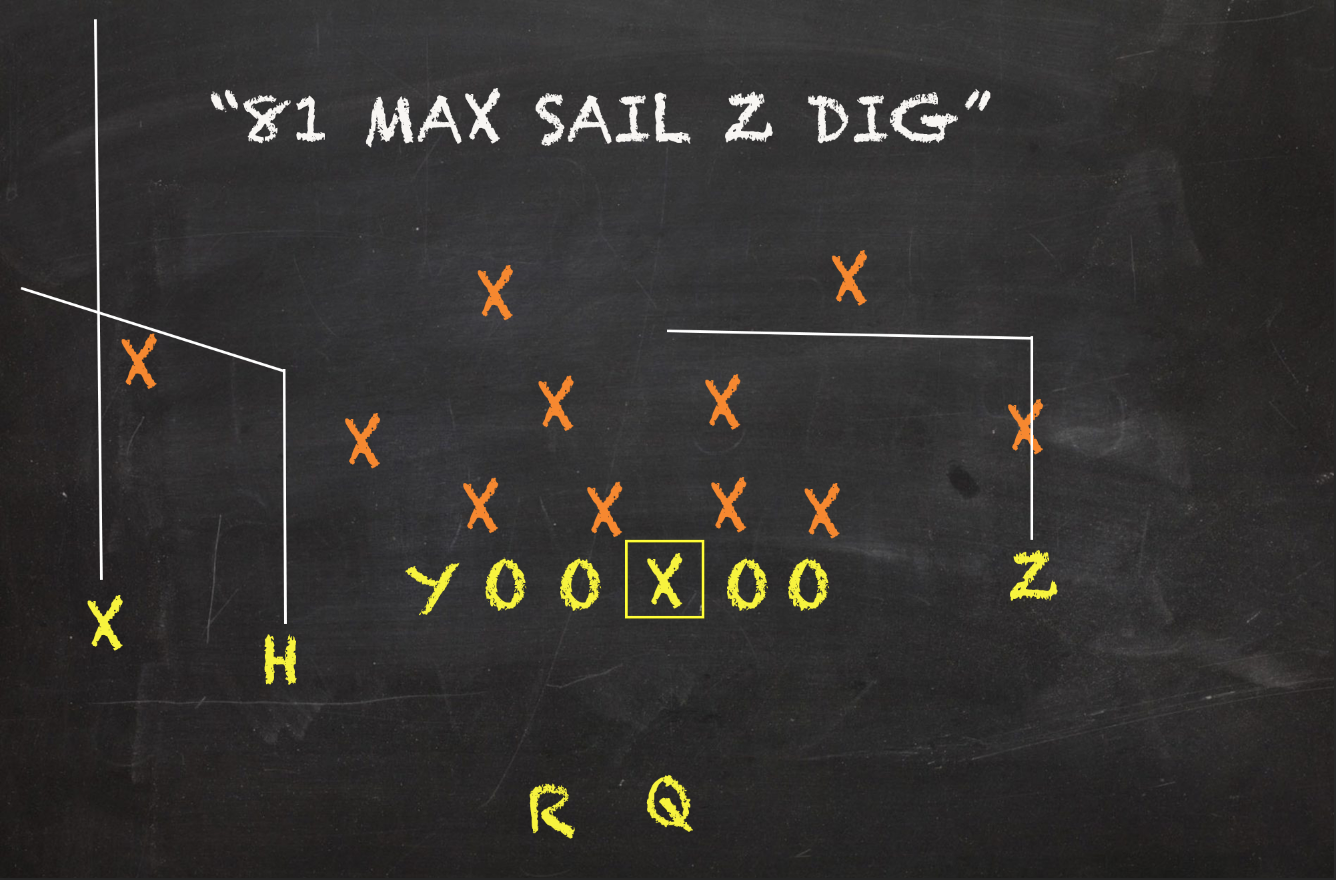
4. Sail 2.22% Play Share 5.67 Y/A 38.9% Success Rate
When all subconcepts are combined, Flood Variations were Tennessee's most featured collection of passes behind All Verts. But when breaking that family apart, the Sail combo was their favorite of the bunch. This strongside flood just edged out its weakside flood counterpart Cross on Tennessee's play sheet 18 reps to 15. Sails consist of an outside vertical and inside deep out/corner in its most base form. But featuring a tertiary flat route underneath is also a very common tactic for this look. Sail was a sporadic look that saw most of its issue pickup after the Mississippi State game. Before then, the Vols only targeted one Sail the five games prior. Seven of Tennessee's last eight games would see at least two targeted Sails. Like the Corners wrinkle, this look saw its highest volume in the bowl game versus Indiana with five reps.
Just under 28% of Sails resulted in either a scramble or a sack, which handcuffed the look's overall production. But, Sails had a knack for generating chunk plays. In addition to the two intermediate gains in the Belk Bowl, this strongside flood was one of their most explosive plays. Nearly 17% of Sails gained 20 yards or more (Tennessee's overall Explosive Pass Rate was 11.3% and good for the third best in the SEC). Sails were one of the Vols most repped plays on 3rd Downs. Only All Verts saw more tries in those spots. But like its overall numbers would suggest, the Sail pattern wasn't much of a difference maker for the Vols on the do or die down. The pattern saw its best results on firsts where all three of its targets found success while averaging 17.3 yards/attempt.
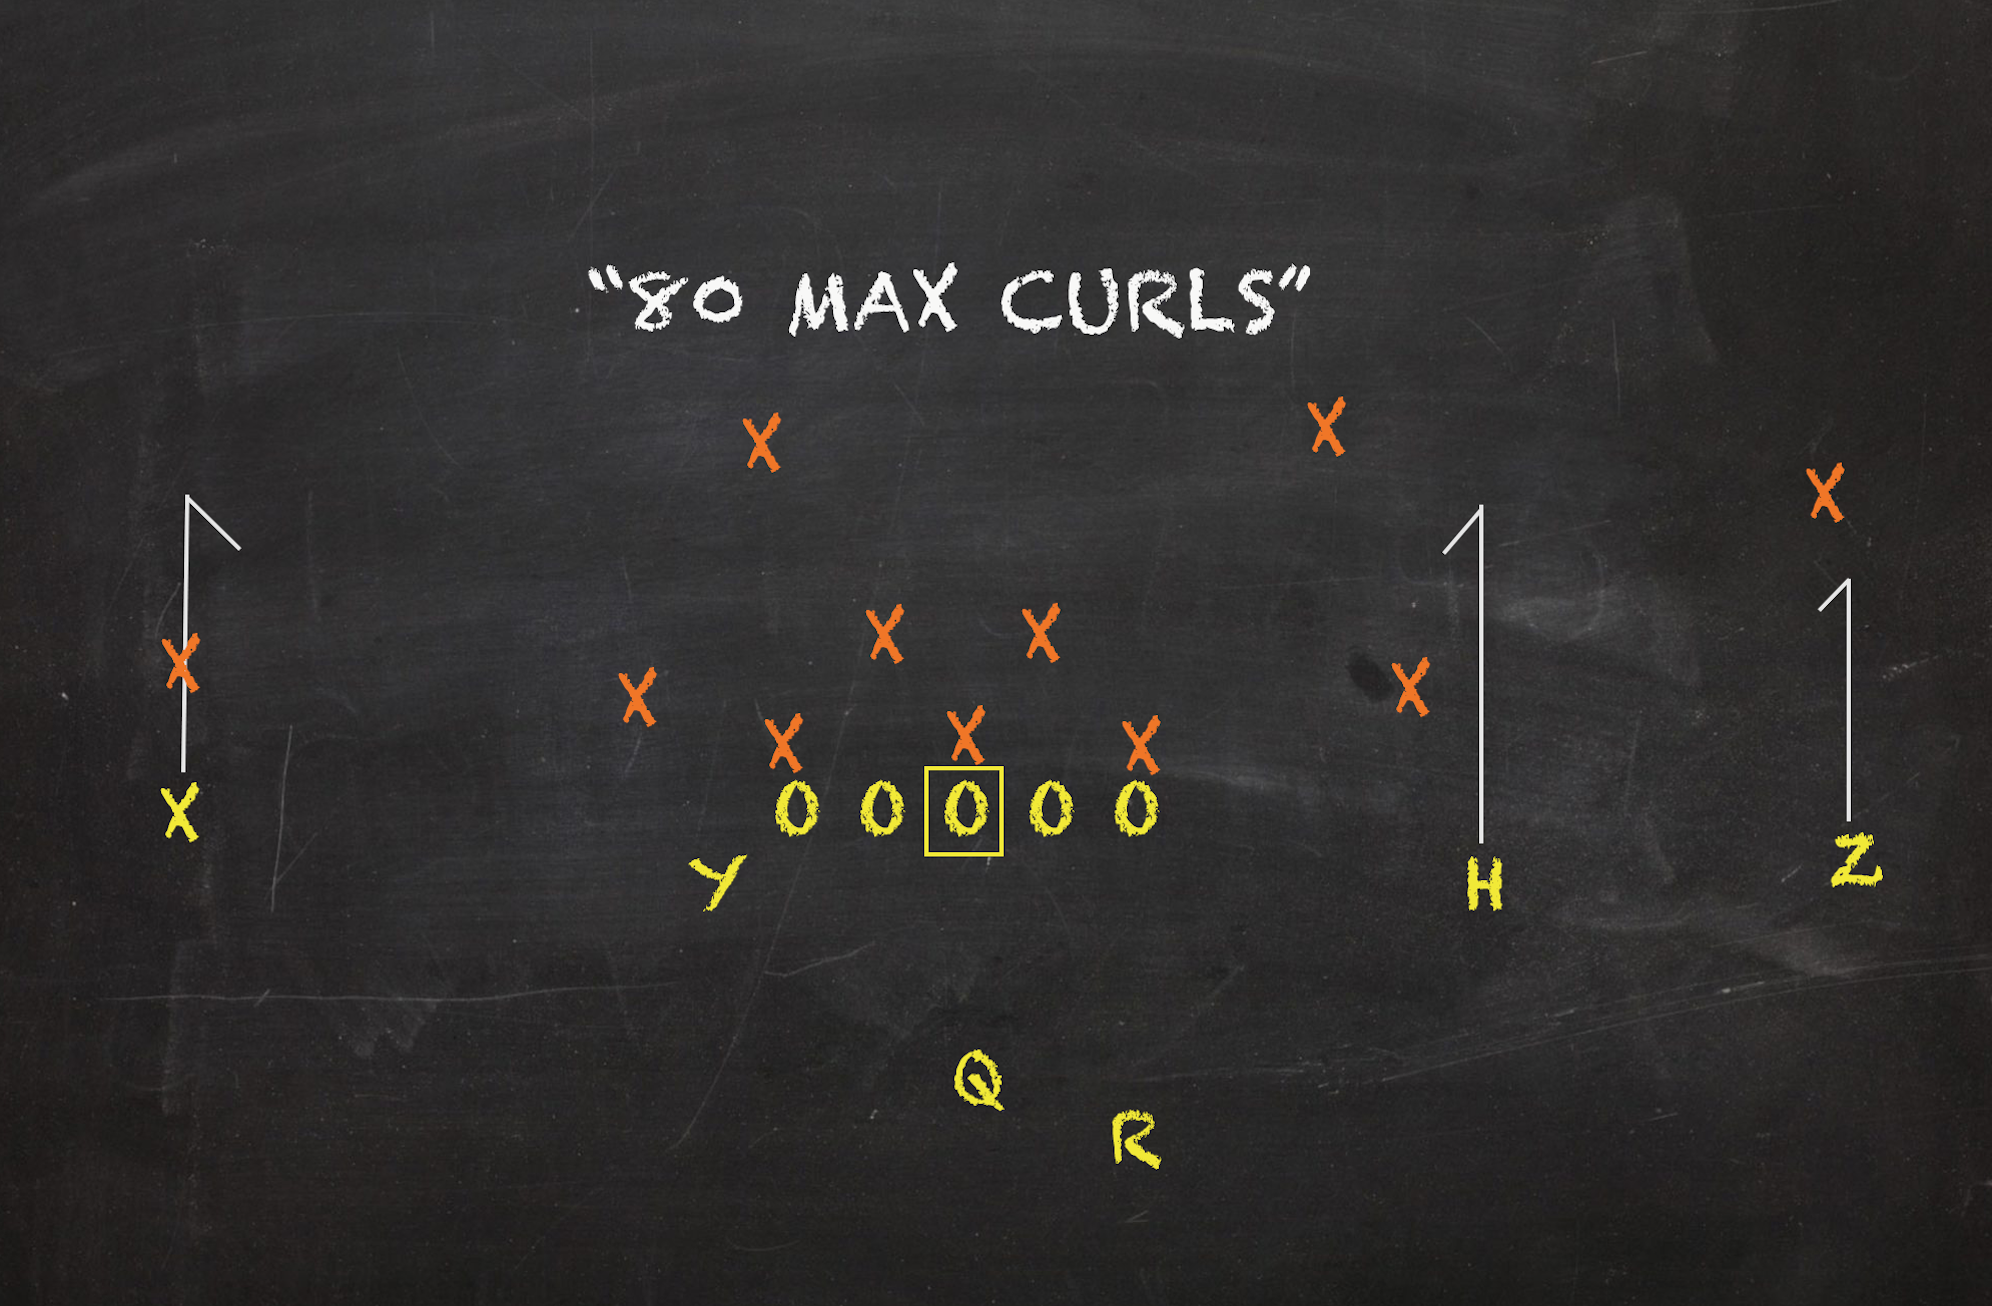
5. All Curls 2.09% Play Share 8.47 Y/A 47.1% Success Rate
Like Spacing/Curl+Flat combos, the All Curls concept is all about finding vulnerable spots in defensive coverages horizontally. But instead of using spatial theory or additional flat routes to create some aspect of layering, All Curls generally calls for each route to run about the same depth. Meaning to catch defenders unawares or on their heels, hitching up in front of the coverage often presents an easy pitch-and-catch opportunity. Early in the season, All Curls were featured more within Tennessee's offense than the volume the look experienced down the stretch. Though this pattern naturally offers little opportunity after the catch, a pair of All Curl targets resulted in gains of 20 yards, which obviously puffed it its 8.47 yards/target. Despite being a basic concept, All Curls was the most successful of any of Tennessee's most featured pass concepts as it was the only aerially-inclined play to sport a clip above 40%.
Of the 17 targeted All Curl patterns, 13 occurred before the Alabama game. Though Tennessee was the least reliant SEC offenses on RPOs, All Curls were commonly paired with Inside Zone Slams. Over half of this concept's RPOs targets found success and buoyed its overall figures. The majority of All Curls were tagged on top of RPO designs. Being a play that feasts on conservative defensive coverages, All Curls was predominantly targeted on early downs. Of the look's 17 reps, 15 took place on either 1st or 2nd Down where it boasted a 53.3% Success Rate. But since both of the concept's 3rd Down tries resulted in failure, All Curls fell flat of finishing the season beyond the 50% Success Rate plateau.
Chalking up Tennessee's most successful looks
(min 1.2% play share)
1. Comebacks 1.23% Play Share 11.5 Y/A 90.0% Success Rate
Seam+Sideline combos were not this offense's favorite passing concept. In fact, the Vols only called 23 plays that were categorized as such in 2019. In terms of play share, that concept group wouldn't even crack the team's top10 most called looks at 2.83%. While it certainly was an infrequent part of this offense, the Comeback combo was executed at an insanely efficient clip. This seldom-called concept saw equal distribution across all downs. Though Tennessee only repped ten Comebacks this season, nine resulted in success. Its lone failure was an incompletion on first 3rd Down in the Vols' victory over Missouri. Outside of its red-hot Success Rate, none of Tennessee's most called plays or the four other most successful looks averaged more yards/attempt. For this offense, it was very common for Comebacks to be paired with play action. Eight of its ten targets utilized play fakes. Some designs Tennessee used this year isolated the deep comeback to one side of the formation, but the majority of them were the typical Seam+Comeback combo. For what it's worth, Hoss -- the other member Seam+Sideline family -- only sported a 46.2% Success Rate and was greatly kept afloat by slot choice routes overall.
2. Tosser 1.48% Play Share 10.2 Y/A 66.7% Success Rate
Slant Variations combined to total a mere 28 reps from this offense. Heck, Tennessee's offense only targeted 21 slant routes all season. Though the Tosser -- dual slants -- wrinkle averaged less than an attempt per game, it was clearly their favorite and best concept from that group. With or without RPO elements, Tosser saw success on two-thirds of its targets. Plus despite being a look that is designed to capitalize on underneath cushion, Tosser's yards/target was one of the few looks to top the 10 yard plateau. Of Tennessee's five most favorite runs and passes and five most successful looks, only Comeback's 11.5 yards/attempt was higher. Slant+Curls, Solo Slants, and Slant+Flats just couldn't match this dual/all slant wrinkle in any way. Looking solely all targeted slant routes, only 61% resulted in a completion. To have 66.7% of Tosser targets finish in success, let alone a catch, this offense unquestionably should have included them more in its script.
3. Rub Variations 1.23 % Play Share 7.10 Y/A 60.0% Success Rate
Rub routes are manbeating concepts that aim to create extra cushion against tight coverage with short, interwoven patterns. The "rub" acts like a pick in basketball with one route often sacrificing his path for the good of a more advantageous opportunity. But like four of Tennessee's five most successful concepts, Rubs really weren't called upon too often despite their on-field production. The most common variety of Rubs are Meshes, which are rooted in two intersecting drag routes coming from opposite sides of the center. What the other complimentary routes do determines on what Mesh Variation the play is charted as. Of the ten targeted Rubs, nine were Mesh wrinkles. The lone non-Mesh target was on a one-man pick play screen that failed to be successful. Plenty of West Coast and Air Raid offenses have used this concept to create yards after the catch chances. Commonly, you will see a playside corner and backside post or dig paired with the two intersecting drags. A modern favorite is the Kelly Mesh. Named for Chip Kelly who ran this design into the ground, this version calls for a wheel towards the side of the formation by the back with an inside drag and outside sit hook. Because of the latter, some call this a "Spot Mesh". Kelly Meshes saw all five of its targets occur on 3rd Down where three resulted in a conversion.
4. Duo Dive 3.94% Play Share 5.94 Y/A 56.3% Success Rate
Tennessee's most consistent run play was dependable enough to finish among their best looks. Duo Dives were favored far less than basic inside and outside zone looks in the Vols' script, but that didn't stop this gap play from delivering sturdy figures. Schematically, Duo Dives pair quite well with Inside Zone Slams when called from undercenter or the pistol. Unlike from the gun where the defense can keep its eye on the ball, snaps from undercenter and the pistol are able to operate more in the shadows -- at least for a beat or two -- where the defense can have trouble diagnosing the play. Slams are zones and call for a coordinated flow from the blockers. Duo Dives are power plays that aim to create hard edges with diverging angles midline based on defensive alignment. Both are directed towards the B-gap between the guard and tackle; so based on how the front is sprinkled along the line of scrimmage often tipped whether to audible to either play. Dives, acting as quick hitting north-and-south runs, averaged the highest yards/carry of any of Tennessee's most called ground looks in addition being responsible 190 yards, which ended up being the sixth most of any look.
5. Ohio/Slice 1.48% Play Share 8.58 Y/A 50.0% Success Rate
The Slice concept is a pretty rudimentary route combo. On the surface, it's nothing more than an outside streak and inside out. But in it's simplicity, the concept's power lies. Its a perimeter oriented concept that targets areas of the defense where they are naturally undermanned. Defenses tend to put most of their men in the tackle box in order to account for the run, which leaves less outside the numbers to potentially defend passes. The out route can do damage versus single high coverages like Cover 3 zone or Cover 1 one with the corner bailing. The vertical can win one-on-one deep versus Cover 1 man or Cover 4 zone and often can find a hole between the curl+flat corner and deep half safety in Cover 2. But like a most of their most successful looks, Tennessee really didn't target this concept too often. Like Tosser, it averaged less than an attempt per game. The Vols paired it with Sticks, Follows, Slot Fades, and solo routes on the other side of the formation. But the plurality of Slice's targets were on mirror designs with the concept on both sides of the formation. All downs saw exactly a 50% Success Rate, but Slice saw half of its targets occur on thirds. But, its six reps failed to see the look finish among the Vols most called looks in those spots.
Where Tennessee's weapons ranked
Examining Tennessee's quarterback situation requires nuance. Some SEC passers can be judged at a glance or from skimming their stats but not the Vols' QBs. Giving a blanket statement that Jarrett Guarantano or Brian Maurer are "bad" doesn't tell the whole picture. While the jury is still out on both, numerous examples of mind-numbing plays, poor decisions, and scattershot passes have prevented both quarterbacks from moving up a tier within the conference. For most of the year, Tennessee's offense was awful and played small opting to allow its defense propel the team towards success. As lackluster as UT's QB play was on the surface, the Vols found ways to make it work in the end. Guarantano and Maurer both had rocky stints, which made it tough for this group to find momentum as both were used quite differently inside Tennessee's scheme.

For much of the year, Guarantano was this offense's whipping boy and frequently took the bulk of the blame. Like in years passed, the Vols looked stuck in the mud and appeared to implode more often than they exploded down the field. And when Tennessee stumbled out of the gate with an 0-2 record, you best believe criticism of JG reached a fever pitch. The same notes were hit: he holds the ball too long, he can't read defenses, his footwork hurts his downfield passing. Not that I'm captain over his fan club or anything. But, even I was at a loss for words examining this beauty in the Florida game. Pruitt wasn't shy praising his QB's ability, but there was no question he expected more out of JG as a leader and firebrand for this offense. Quite frankly, he wasn't being a playmaker. He was being a play-preventer. While the fan base might be up in arms or lighting torches due to his resume, there is no denying Guarantano was the Vols' best passer this last season. He still lacked great accuracy and operated tentatively, but Guarantano finished the season with an above average Success Rate that placed him in the upper-third of SEC quarterbacks. Plus, Guarantano's yards/attempt, Explosive Pass Rate, and First Down+Touchdown Rate finished inside the conference's top5.
Though his Success Rate and Depth Adjusted Accuracy remained fairly consistent from Weeks 1-7 and after Week 8, the already gun shy Guarantano was even more muted. Despite the fact he completed 7/15 deep attempts, only 5.06% of his attempts traveled at least 20 yards in the air before Week 8. With less throws traveling far, his average depth of target came in right at the SEC's sixth lowest at 9.44 yards. Outside of his deep connections, his receivers didn't offer up much help in terms of explosiveness. Guarantano only had four explosive gains with an ADOT less than 20 yards the first six games. By a percentage basis, his 10.5% Explosive Pass Rate before Week 8 placed below the conference average in that span. Only a third of his attempts resulted in a First Down or a Touchdown, which is not optimal. While the big play throws were infrequent, wayward tosses and risky passes rampant. During UT's first six games, Guarantano's 8.57% Interceptable Pass Rate, 3.81% Interception Rate, 13.3% Defender Breakup Rate, and 2.41 average time to throw were considerably below the conference mean. If his read wasn't open and defined early, bad things usually happened.
Knowing something had to be done, Pruitt turned to true freshman Brian Maurer. At the time, I questioned the move despite the coach talk and internet fervor of support. Maurer's play screamed that he simply was not ready. To manage the moment, Maurer was granted simple reads and RPOs to aid in his production. By the end on the year, only Auburn's Bo Nix saw a higher percentage of completions come off RPOs. Despite 20% of his passes being short RPO outlets, Maurer sported the league's second highest average depth of target at 13.9 yards. To that point, Maurer's percentage of throws that traveled 20 yards or more was also the second highest. UK's Lynn Bowden led the SEC in both spots. While Maurer managed to direct a decent amount of explosive tries, he was worse across the board. By the end of the year, Maurer's analytics placed him near the bottom5 in Success Rate, Accuracy, Depth Adjusted Accuracy, and First Down+TD Rate. The few big gainers could not drown out his faults. Nearly 23% of this attempts were charted as uncatchable, his 8% Sack Rate fell into the bottom5, and exactly 20% of his attempts could have been intercepted (the next worst clip in the SEC was UK's Sawyer Smiths 15.6% clip). That kind of play doesn't yield winning football too often. Though he received spot snaps and even started the first half of the Kentucky game, Maurer's inconsistently forced Tennessee to call upon its old dog once more.
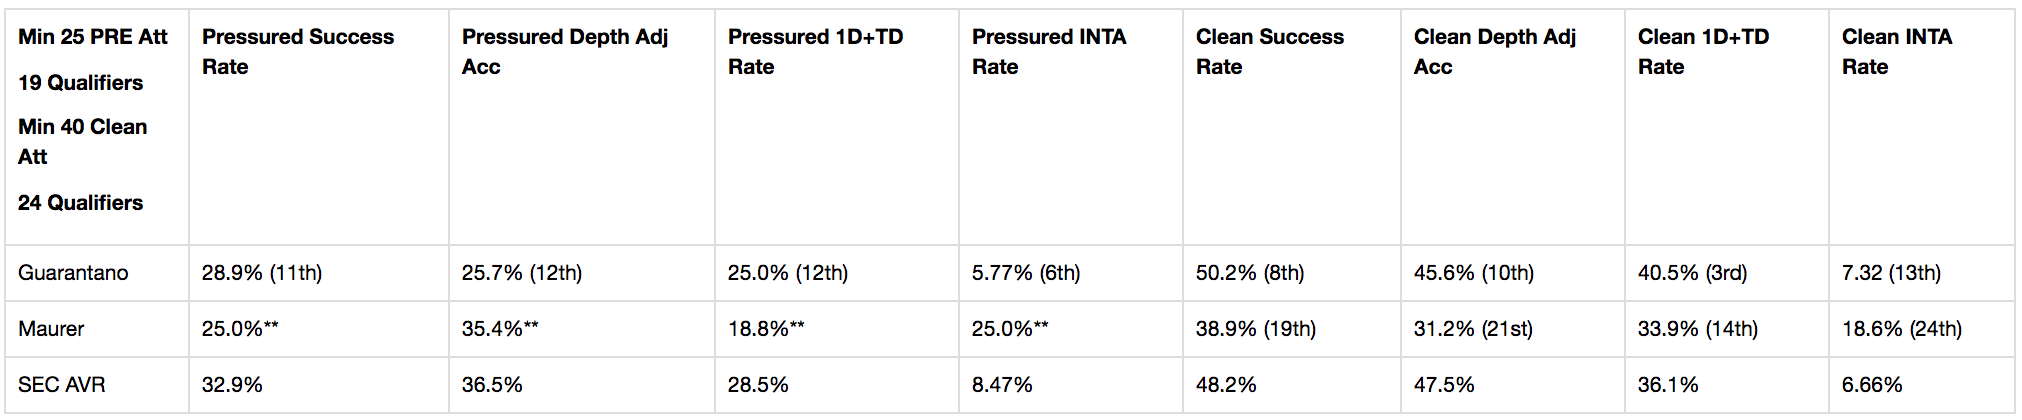
Versus pressure, both passers struggled. It's a damn good thing Tennessee's line sported the SEC's third best Pressure Rate allowed so the two weren't under the gun too often. While he still had boo boos, Guarantano performed better under duress than the green Maurer. Maurer only had 16 pressured dropbacks so he failed to qualify within the conference rankings. But you can see, the freshman was just as likely to throw on turnover-worthy pass as direct a successful attempt when pressured. With an Interceptable Pass Rate about 3x higher than the SEC average in these spots, Maurer's downside greatly outweighed his silver linings. Guarantano, who obviously wasn't great either, was empirically less sucky. While he was comfortably a below average SEC passer facing pressure, he made better decisions. More reps in those spots probably played a role. But for an experienced junior, being "Jeff Fisher mediocre" just isn't ideal.
Production versus pressure is more volatile and unpredictable than a passer's output from clean pockets. Since clean pockets are more common down-to-down and present less variables than pressures, these attempts are a better reflection of someone's potential. Plus if a guy can't operate from a clean pocket when conditions are perfect, how can you expect him to break a few tackles, scramble outside, and connect with a teammate accurately playing backyard ball with a high rate of consistency? This is the area where Guarantano saw year-over-year gains. He was one of the handful of passers to break the 50% Success Rate threshold from clean pockets after finishing with a 44.4% clip last season. Though he still struggled with his accuracy, Guarantano's decision making kept this passing game afloat. Only Tua Tagovailoa and Joe Burrow finished with a better First Down+Touchdown Rate from clean pockets than JG's 40.5% clip. Though his Interceptable Rate remained unsatisfactory, it was greatly influenced by his subpar passing early in the year. Guarantano only had two interceptable attempts from clean pockets after Week 7.
Maurer was unequivocally one of the worst passers in the SEC when unpressured. It's one thing for a young passer to crumble under duress, but its much more of a concern if he can't stand tall and play well in pristine pockets. Again since these throws are a better barometer for success, there was literally zero to point to and say Maurer's freshman campaign was constructive. While some explosive gains helped balloon his First Down+Touchdown Rate, he finished in the SEC's bottom5 in Success Rate, Depth Adjusted Accuracy, and Interceptable Pass Rate from clean pockets. No where to go but up, right?
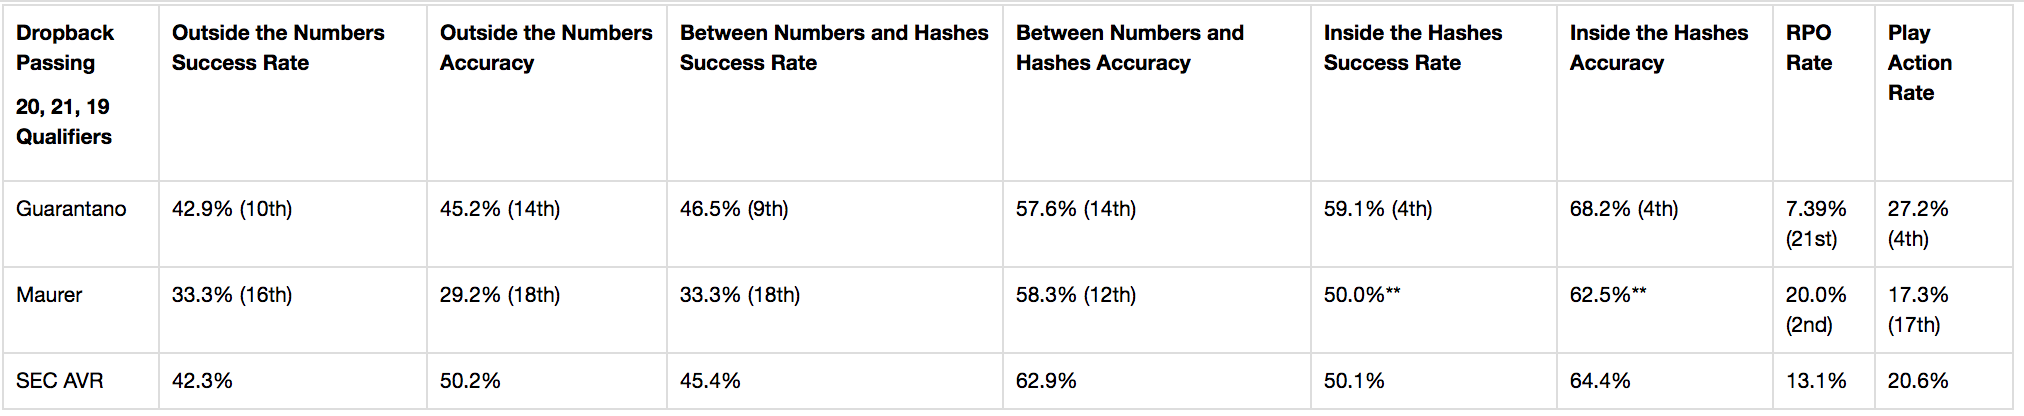
In today's game, screens and RPOs are so interwoven within schemes that it becomes hard to break out a passer's performance on true pass attempts. After all, there's only one statline at the end of ball games that combines all of a quarterback's figures. Thanks to our charting, we can measure a passer's ability with greater detail. While pro offenses still see cases of attempting to hide one's quarterback due to his shortcomings slinging the pill, scouts clearly have more desire for someone who can connect on dropbacks consistently. Since Guarantano had the lowest RPO Rate in the SEC, his dropback stats were basically the same as his overall stats. But since Maurer was one of the most dependent passers on RPOs, we can see just how much his production was influenced by them.
Guarantano made pretty sound decisions with the football. Each area sideline to sideline sported an above average Success Rate. Like a good deal of seasoned vets, he was comfortable attacking the middle of the field. Sure there are some exceptions, but most young passers struggle towards the middle of the field due to the higher number of defenders. While he was ordinary outside the hashes, Guarantano was among the SEC's best at targeting the middle of the field. Both of his Success Rate and Accuracy clips finished inside the SEC's top4. Ball placement was his biggest issue outside the hashes.
In the two field areas in which he qualified, Maurer displayed bottom5 Success Rates. Without RPO completions padding his numbers, Maurer was a limited passer. Outside of chucking it deep versus one-on-one coverage or hitting a checkdown, he was wildly inefficient. Hell, only a third of his throws outside the hashes resulted in success. That won't win you any ball games. While his 50% Success Rate towards the middle was fine, it still finished below the SEC average. Plus with only eight attempts targeting that area, he failed to qualify.
Despite a public blowup and angst from a frustrated fan base, Guarantano is on track to start behind center in 2020. As countless other examples have told us, accuracy can only improve so much. That certainly remains Guarantano's biggest flaw. Say what you want about his indecisiveness or lack of fire, but no passer gets far being a below average thrower of the football no matter how brilliant his processing ability is. The noise is quiet now, but it remains to be seen if the senior-to-be with continue to grow as a quarterback. Tennessee won despite blah play from this position. Tennessee can get to Atlanta if it gets above average to good play consistently out of it quarterback.
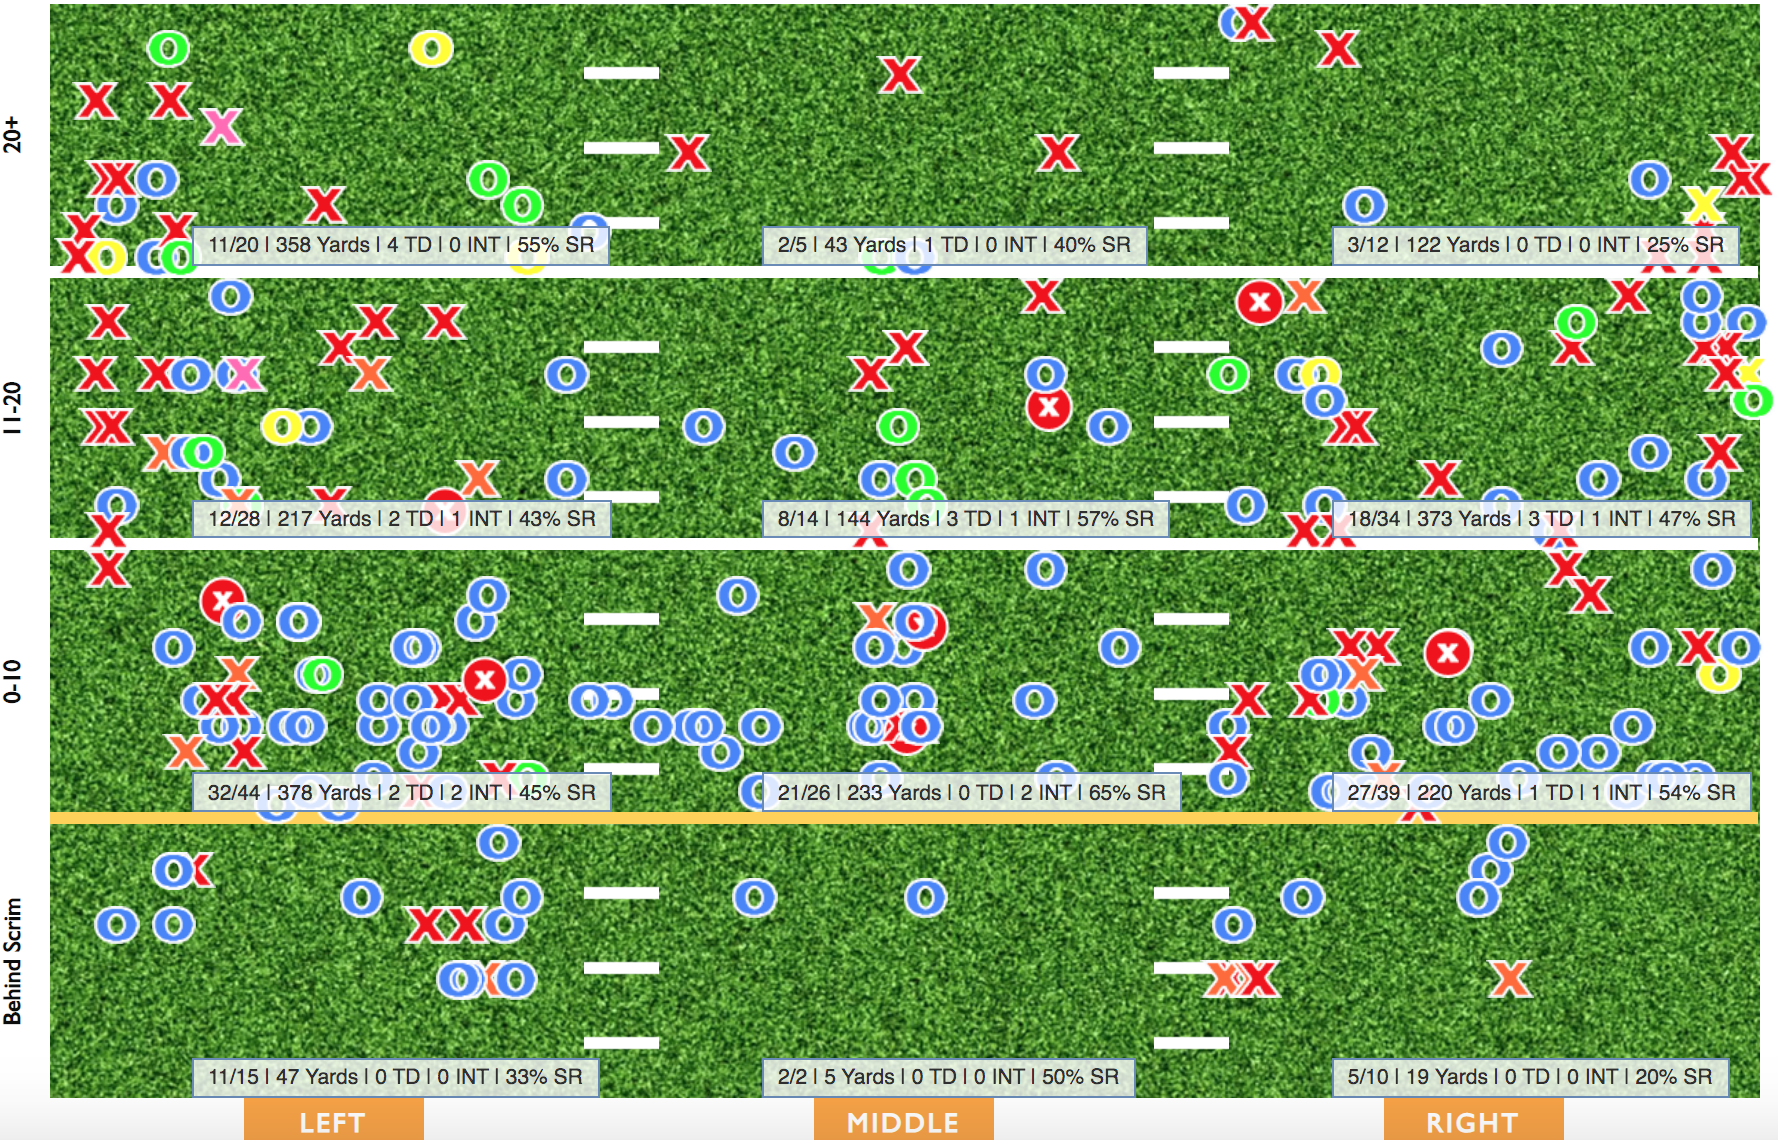
Even with wishy-washy passing, Tennessee finished the year with a top5 receiving corps within the conference. Their collective abilities to win deep and move the chains kept Tennessee's offense in ball games. With UT's run game rarely producing much support, coming up with plays that flipped the field or bought their defense some cushion was vital to Tennessee's gameplan. The Vols ran the second fewest plays/game within the conference this year, which gave their receivers less opportunities to make plays. Even with the small margin of error and high degree of difficulty, Tennessee's receivers remained strong downfield options.

Jauan Jennings, the Vols' primary slot receiver, was this offense's go-to target. With plenty of size and skill that justified a high volume of opportunities, his versatility allowed him to finish as Tennessee's best receiver. His senior season begat career high in volume stats as he led the team in targets, catches, yards, and touchdowns. Jennings's efficiency figures stood firm as well. His Success Rate, Yards/Target, Explosive Catch Rate, First Down+Touchdown Rate, and average yards after the catch all finished inside the SEC's top15. Jennings easily was the Vols most trusted outlet. He saw 12 more targets than the next closest UT receiver while doubling the next man up's yardage on 3rd Downs. In the Red Zone, the same phenomenon happened with his yards but he only saw six more targets than the next man up in that area of the field. The volume was completely warranted as both his 3rd Down and Red Zone Success Rates finished above the 50% threshold and cracked the SEC's top15. Tennessee overall wasn't a big believer in RPOs. Yet, Jennings led the team with 14 RPO targets and sported a 64.3% Success Rate. Despite working short and underneath spots frequently, Jennings also walked away as the Vols' most consistent deep threat. While there's no challenging Marquez Callaway's league-leading 21.2 Yards/Catch, Jennings ended the year with a better Deep Catch Rate and proved to be better on contested targets. As a slot, he often attacked the middle of the field right in the teeth of the defense. He caught 21 of his 25 attempts between the hashes including four of his eight scores. He wasn't a tightrope acrobat as he struggled to win outside the numbers and along the sideline, but there's no denying his diverse skill set. Jennings has the talent to make an NFL roster and be productive at the next level. But, his hothead reputation and off-the-field concerns naturally will hurt his stock.
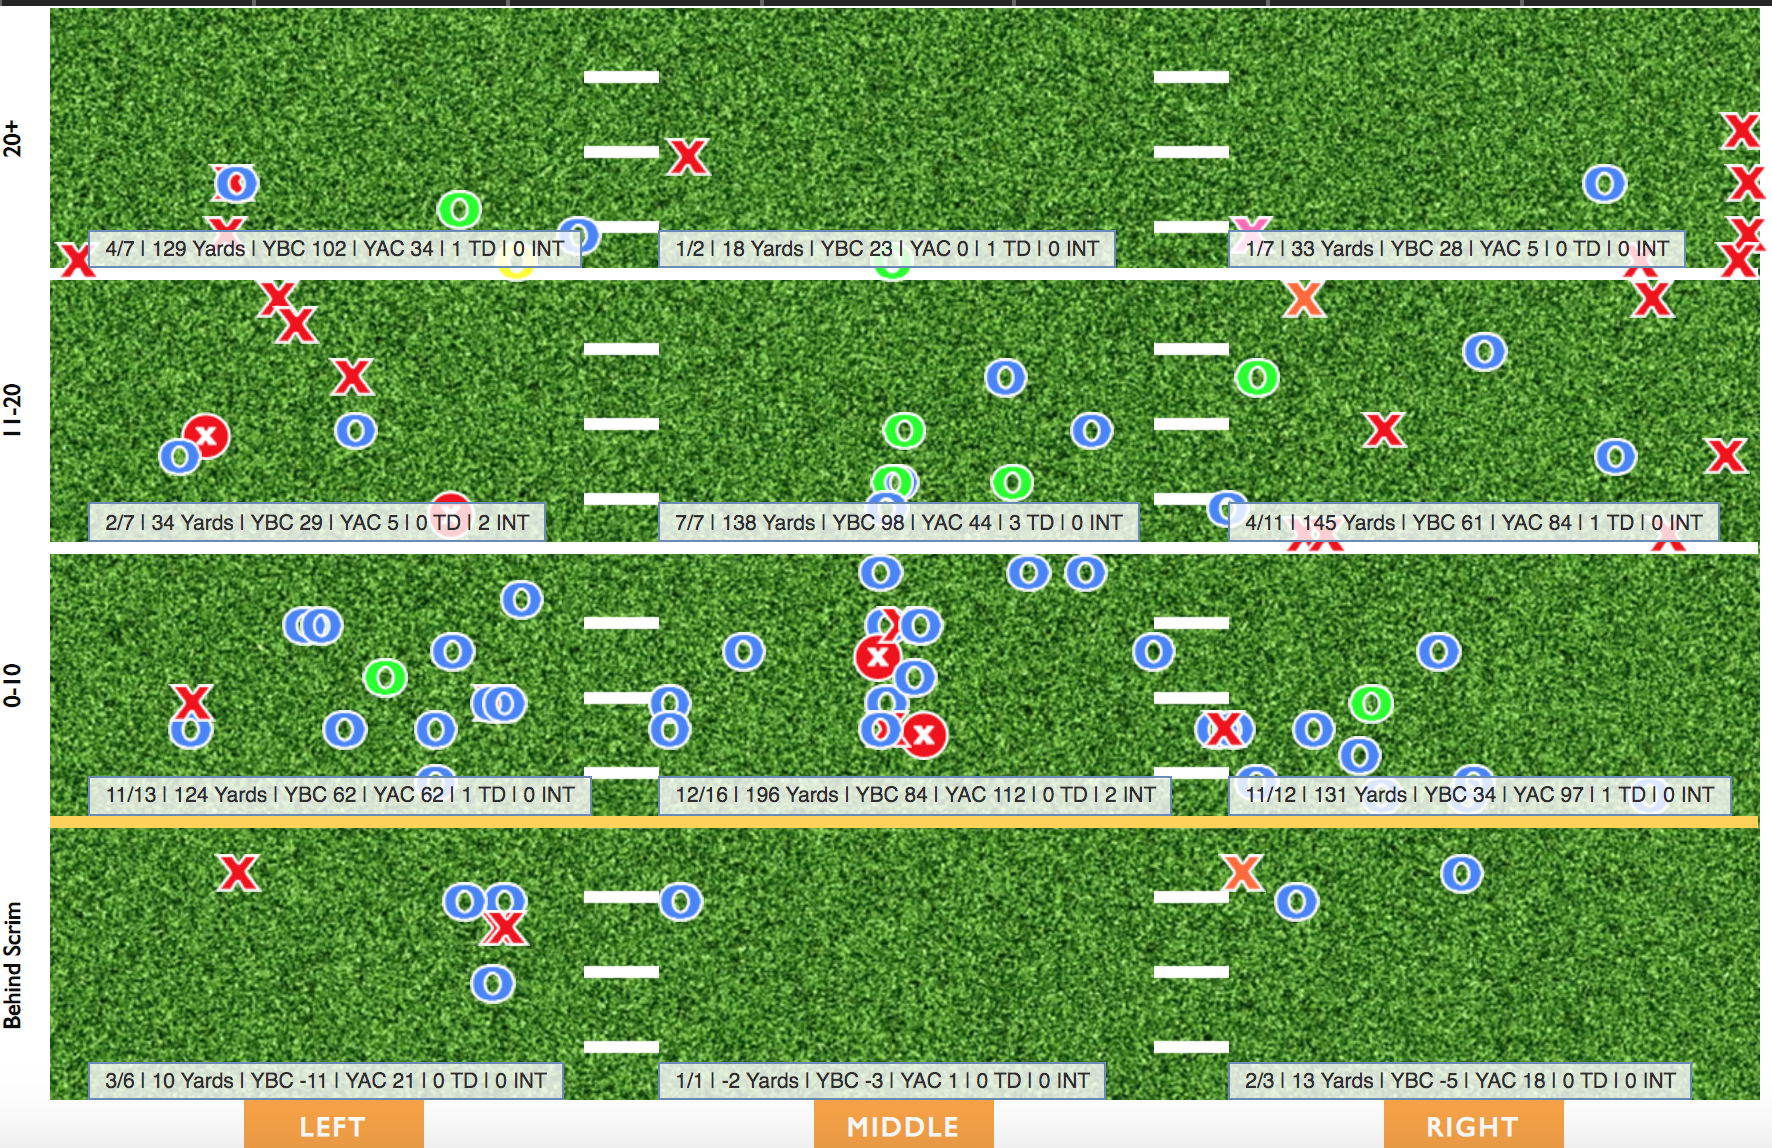
Callaway was clearly this offense's deep threat and operated from the X-position, which is the left outside receiver. Nearly 62% of his targets took place on throws to the left beyond ten yards downfield. Over half of his receiving yards came off throws 20 or more yards downfield. No SEC receiver sported a higher average depth of target (19.1) or Yards/Catch (21.2). But going downtown so frequently made connecting with him a hard ask. Exactly 30% of his targets were not catchable with obviously hindered his overall Success Rate and Catch Rate. Only two other SEC receivers suffered from a worse Uncatchable Catch Rate than Callaway. On accurate passes, Callaway three-fourth of his targets ended in success as he caught 23/24 of them. This surehandedness helped him finish with a team-high 69.3% Depth Adjusted Catch Rate, which applies more weight the further a player is downfield when targeted but omits uncatchable tries. His potency more than made up for his lack of consistency. With a top10 Explosive Catch Rate and Yards/Target, his play making ability downfield was crucial. Half of his deep catches resulted in scores. With plenty of toss ups or off-target chances, Callaway was one of the best in the conference at creating opportunities for himself. While his clip wasn't as good as the next guy I'm going to talk about, his 5.00% Creation Rate placed ninth within the conference.
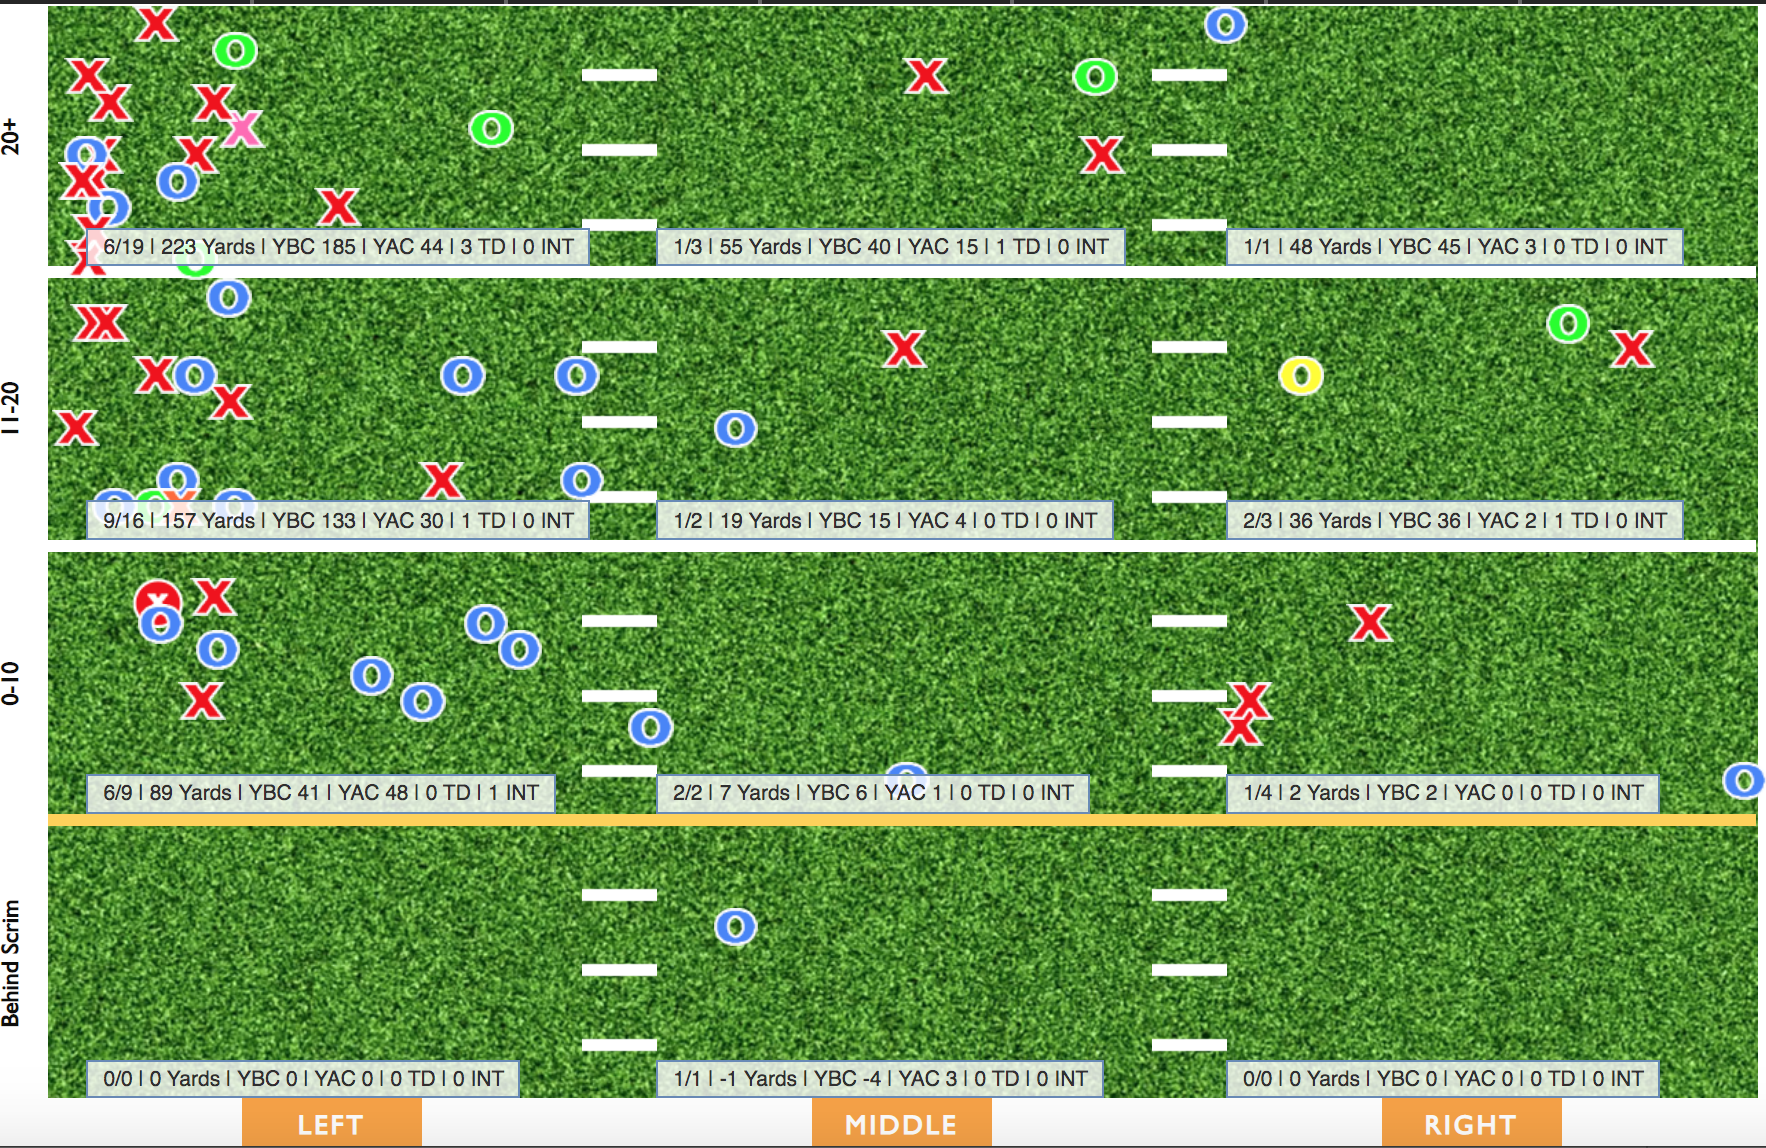

Josh Palmer finished second on the team in catches, but was the tertiary option in terms of number of targets. Like Callaway, he mostly operated from the outside. But rather than predominantly lining up as the X, Palmer was Tennessee's Z-receiver on the right perimeter. Over 80% of his targets occurred on the right side of the field. With more intermediate targets slightly bringing down his clip, his average depth of target was less than Callaway's but still was among the SEC's top10. Plus with less deep attempts, he saw more catchable passes on average. Not that his 17.2% Uncatchable Target Rate was superb, but it was considerably lower than Callaway's. Though his overall figures are somewhat ho-hum, Palmer was sneakily one of the best possession receivers in the SEC. While he was not an efficient option deep, on 3rd Downs, or within the Red Zone, Palmer thrived on contested chances. Along with the SEC's third best Contested Catch Rate, Palmer cracked the conference's top10 in Success Rate as well. On 50/50 balls, Palmer often went above and beyond to make a grab for his team. Numerous catches along the sideline and well timed snags simply would have been incomplete if an average receiver was targeted in those spots. Of his six league-leading created receptions, five occurred on contested targets. Overall, Palmer's 10.3% Creation Rate was the only clip among SEC players with at least 40 targets to finish in the double digits. For good measure, his Drop Rate was among the 15 best in the SEC. Glancing across most of his stats, Palmer delivered adequate results. Half of his tries ended in success and he finished top20 in Explosive Catch Rate and First Down+Touchdown Rate.
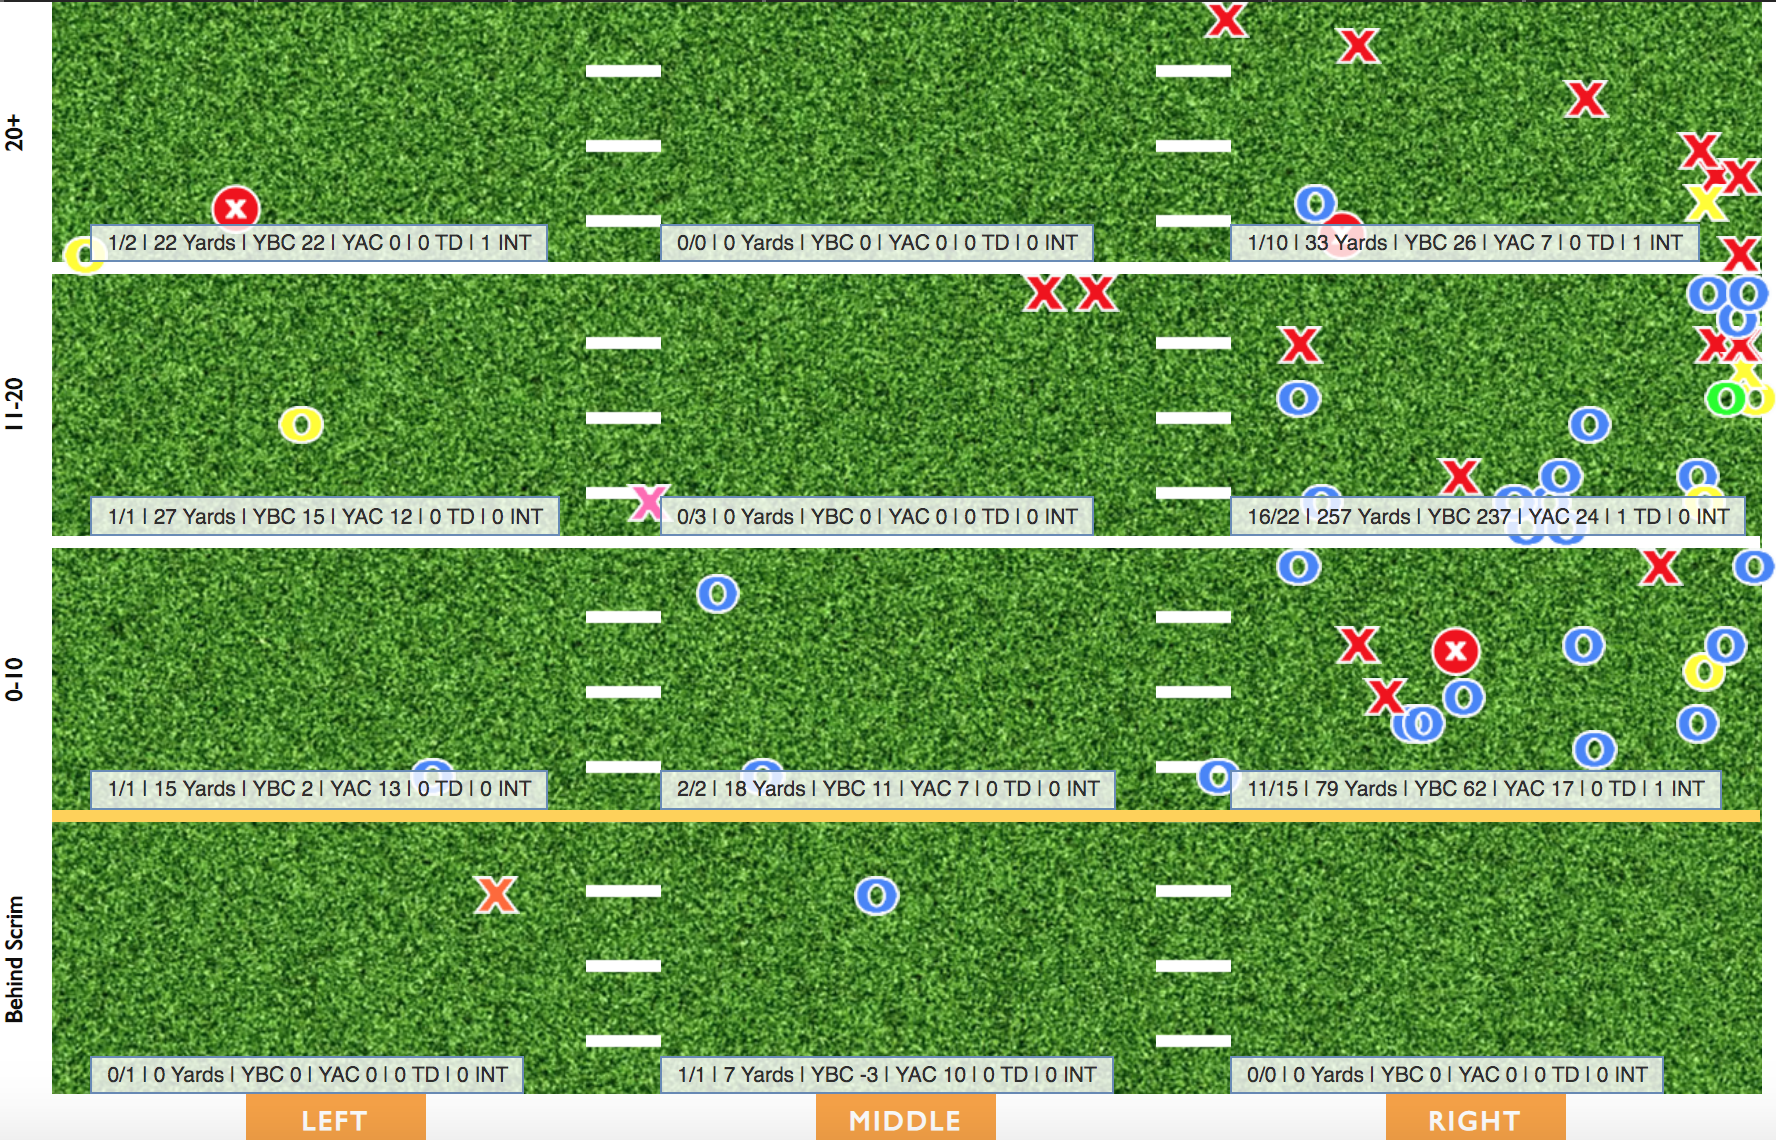
Tight end Dominick Wood-Anderson caught all 20 accurate targets that went his way. He sported the lowest average depth of target and Drop Rate among Tennessee's four main outlets. Like most tight ends in this conference, he was mostly used as a safety value in the line of sight of their passers towards the flat or in the underbelly of coverages. But if the throw was off target or if he was challenged on an attempt, DWA lacked ability to win consistently. With one of the worst Uncatchable Target Rates in the SEC, he finished inside the conference's bottom5 in Success Rate, Catch Rate, Yards/Target, and First Down+Touchdown Rate. With other competent pass catchers on this roster, DWA failed to qualify in the rankers on deep, 3rd Down, Red Zone, and contested attempts due to lack of tries. His sample size of three deep targets is extremely limited, but he managed to haul in two of them. Despite his big frame, he was not a reliable receiver on key targets and posted the worst Depth Adjusted Catch Rate of the Vols' four main options. Catching all of his accurate targets was a start. But even then, DWA rarely did something worthwhile situationally.

In 2018, the Vols had the worst run game in the SEC. No one sported a lower yards before contact clip or Rushing Success Rate. In fact, the latter was so bad that no other conference offense was within five percentage points of their 35.9% rate. With not much help from their OLine and their own shortcomings as ball carriers, both of Tennessee's lead backs donned dismal statistics and analytics on the ground. Though they certainly used less I-formation stuff, the Vols' run game use similar schemes year over year. New OC Jim Chaney -- known for his manilla style in his Georgia days -- had Tennessee operate in manners consistent with his reputation. Though the playcalling wasn't revolutionary, no SEC offense used more presnap motion or shifts on their rush attempts than the Vols. Now what does this do you ask? Well for defenses assigned run gaps based on the strength of the formation, changing the orientation forces the defense to account for this alteration. Over 22% of their runs used motion and an additional 3% used shifts. Despite the eye candy, this run game moved backwards too often. Granted, their 11.1% Negative Run Rate was a noticeable improvement from last year's 20.4% clip. But, it still finished in the bottom3. While the runs were more consistent and kept the Vols plodding forwards, there were less explosive gains and this offense still finished among the worst rushing units in the SEC.

Ty Chandler, last year's volume leader in carries, yards and touchdowns, remained this offense's primary ball carrier. But as last year used a dual-headed approach, Tennessee was all about the running-back-by-committee in 2019. Three ball carriers eclipsed the 100 carry threshold for the Vols. But, Chandler was the only rusher with over 15 attempts in at least four games (Grey and Jordan each only had two). Despite receiving the plurality of Tennessee's carries, Chandler was the Vols' least successful rusher. No Tennessee back had a higher average yards to gain on attempts than Chandler's 8.68. Signifying a decent early down workload, he was given less short yardage opportunities. His Rushing Success Rate was comfortably in the conference's bottom10 even though he was gifted the most cushion on average of Tennessee's three main rushers. Even as Chandler faced defensive contact behind the line of scrimmage on nearly 15% of his carries, his 2.54 yards before contact clip was right at the SEC average. This extra space allowed him to finish as the Vols' most explosive back and best at gaining a conversion or score per carry. Then again, that's not saying much as both his Explosive Run Rate and First Down+Touchdown rate also placed within the SEC's bottom10. A big knock on Chandler is his drive. If a decent run lane presents itself, he's okay and ordinary, but he lacks an edge after contact. While his Broken Tackle Rate was below the conference mean, Chandler's average yards after contact just missed being included in the SEC's bottom5. With him bringing little to the table for this offense, his usage faded over the course of Tennessee's last four games. Though he was held out of the Vanderbilt game, Chandler only saw 24 carries down the stretch after combining for 32 the two games prior.
Tim Jordan was this offense's most successful rusher despite averaging the lowest yards/contact and running for the lowest amount of yards. Though his Success Rate slightly bested the other two ball carriers, Jordan was not an effective rusher this past season. Like last year, Jordan's analytics were near the bottom in every category within the SEC. Early defensive contact surely played a role in Jordan failing to get things done on the ground. With lackluster line play, Tennessee's backs often had to create their own opportunities in space after contact. Jordan was among the 15 best in the SEC at shedding would-be tacklers but he consistently collapsed with early engagement. It's a lot easier to be productive without obstacles constantly blocking your path, but Jordan received no such luxury. His 1.74 yards before contact average was bottom5 and his 2.38 yards after contact was bottom10 in the conference. Though all of Tennessee's rushers suffered from a high percentage of carries with defensive contact behind the line of scrimmage, Jordan ironically sported the lowest clip of the three even with his poor yards before contact clip. Still, Jordan was bottled up more often than not. His Explosive Run Rate and First Down+Touchdown Rate finished inside the conference's bottom3.
Analytically, true freshman Eric Grey had a ho-hum debut season. His Success Rate, Explosive Run Rate, and First Down+Touchdown Rate all finished inside the bottom10 in the SEC. He saw even more contact behind the line of scrimmage than Ty Chandler but proved to be the Vols' most physical rusher. For much of the season, Grey's jolt popped off the screen but just couldn't make the most of this carries. With Chandler and Jordan anchoring Tennessee's colorless run game, the freshman failed to steal carries for much of the season. After Week 2 in which he received 17 touches, Grey would go until Week 14 until he had another game with double digit carries. Grey certainly was advantageous with his chances versus Vanderbilt in Week 14. To that point, Grey only rushed for 207 yards as he noticeably lost a step as the season progressed. But that afternoon, he topped 250 yards on the ground with two long breakaways; the 94-yarder greatly influenced his final 3.14 yards after contact clip. But the fact Grey's clip is the same as Alabama's Najee Harris should be a nice silver lining for next season. Grey totaled 39 carries and 332 yards over the Vols' last two contests. Chandler and Jordan only combined for 25 carries and 80 yards in that span. While the older statesmen lacked a knack for making something happen after contact, Grey seemingly found his niche in this offense moving forward. After all, being able to make plays after defensive engagement is what separates average backs from good ones. While the Commodores and the Hoosiers were far from defensive stalwarts, the freshman responded quite well the the extended snaps. But looking at his macro, Grey has to turn his broken tackles into more substance if he will be a true difference maker for this unit in 2020.