Sideline to Sideline: South Carolina 2019
South Carolina at a glance
South Carolina's football program has become rather stale. While the Gamecocks displayed some flashes in the past, the team has largely regressed back to the middle of the pack. In fact, the last four seasons, the Gamecocks own a 26-25 record. If that doesn't scream, "Average AF", I don't know what does. Despite the competitive landscape of the SEC, South Carolina kept stubbing its toe in winnable contests. They fight, they scratch, they claw, but they often fumble, bumble, and stumble quite often. Whether it was losing ground to other SEC East foes like Kentucky or Tennessee or failing to maximize its talent, Will Muschamp seat has starting to match his fiery temper due to his pedestrian record.
Their quarterback Jake Bentley usually got the bulk of the blame for the Gamecocks' offensive miscues and was often associated with this mediocrity. And his ghosts came to the forefront in Week 1. While blowing their 11 point 4th quarter lead to North Carolina, Bentley went 2/9 for 15 yards while tossing two picks and taking two sacks. Only one of his passes resulted in success as he faced pressure on a third of his dropbacks in the final stanza. Somewhere in the meltdown, he broke his foot. Out for the year. You all know the drill.
Freshman Ryan Hilinski supplanted Bentley as the starter and showed early promise. To both protect their young passer and play to his strengths, Offensive Coordinator Bryan McClendon emphasized West Coast Offense principles. While South Carolina's offense has had elements of this philosophy in the past -- Slants, Spots, gadget sweeps, etc -- there was an apparent effort to attack the underneath areas of coverages. Throwing up a 70 burger is a pretty impressive feat for a first time starter; even if you are playing Poop Southern. Still, that level of production was enough to raise the former four-star's expectations.
With less tape on him, early opponents of the Gamecocks were unsure on how to best pester the South Carolina's young passer. Due to his quick release, pressuring Hilinski into a mistake might proved to be more challenging than anticipated. Hilinski unabashedly sported one of the quickest times to throw within the conference throughout the entire season. Either through coaching or because it was deeply rooted in his West Coast DNA, Hilinski made a concerted effort to transfer the ball swiftly. With short patters, timing routes, and screens receiving healthy reps, it was very much by design to play to that dynamic. Striving to win short eventually invited more defenders into the box, which hurt their run game's execution.
On the ground, the Gamecocks went with a two-headed system with returning workhorse Rico Dowdle and Clemson transfer Tavien Feaster. Despite being okay last year, Dowdle wasn't the toughest runner and there was an obvious need to boost production in South Carolina's run game. Feaster ran angry. He often was the one who initiated contact with a defender rather than the other way around. To fit that mentality, McClendon dialed up more power runs. By the end of the season, over 55% of their designed rush attempts and 52% of their yards came off power concepts. In the age of the zone read, that's a significant clip. Though Feaster out-carried Dowdle overall, each received equal amount of opportunities on gap designs with 67. Despite being the less edgy back, Dowdle's output on powers topped Feaster's. Though the gap in Success Rate was marginal, Dowdle gained 361 yards compared to Feaster's 298 on those concepts. Despite the favoritism on the call sheet, power and zone concepts each finished with 40% Success Rates. Both yielded disappointing returns. Draws, jet sweeps, and end arounds collectively delivered fantastic results in their limited use. Composing barely 5% of their rushes, those looks sported a 57.9% Success Rate.
South Carolina's rushing offense wasn't the SEC's worst by any means, but it still was a grand letdown. Since their passing style did very little to stretch the field vertically, safeties simply didn't feel threatened. With less trepidation of allowing a big play overtop, safeties felt inclined to hone in on the Gamecocks' rush attempts. More bodies in the box meant more potential obstacles for their backs. No offense averaged less yards before contact within the conference than South Carolina. Like common sense suggests, its a helluva lot easier to get somewhere if your path isn't obstructed. Constant badgering on the ground limited South Carolina's backs. Though no SEC team collectively averaged more than SCar's 3.47 rush yards after contact, their yards/carry finished in the bottom5 and the Gamecocks's Success Rate placed ninth within the conference.
Some of the misfires in the run game fell on the OLine. The staff moved pieces around but the unit never came together. Their shoddiness in Week 1 played a hand in Bentley's injury and failure to secure the game. No matter who was in there, the unit lacked consistency week-to-week or even half-to-half. Absolutely, failing to manage overpopulated tackle boxes deflated SCar's potential rushing the ball. But in terms of limiting Havoc plays, this offense was about average. Preventing negative carries was a big reason their 29.5% Havoc Rate fell into the top half of conference offense. No team posted a lower Negative Run Rate than South Carolina's 7.22%. While their carries managed to minimize losses, only Florida and Missouri had a greater percentage of carries gain between zero and three yards within the SEC. For the most part if the Gamecock backs weren't gifted a wide run lane or brought their hard hat, their runs consistently underwhelmed.
The underlying issues on the ground kept forcing this offense to turn more towards the air. Only LSU, Florida, and Texas A&M were more pass-happy within the SEC this season. South Carolina boasted a 58.9% Pass Rate. Faced with scoring deficits and behind the chains situations, running the football provided a less optimal way to play. But Hilinski's conservative nature kept intervening. Constantly checking down and conducting short timing routes put more pressure on his targets to be productive after the catch. It should be no shocker that Hilinski owned one of the SEC's lowest average depths of target. Screens were turned to as an extension of the run game and see if their dudes could make a play in space. In Hilinski's case, his 11.3% Screen Rate only trailed Florida's Kyle Trask among SEC passers with at least seven starts. By volume, Hilinski finished second to Trask in screen attempts (47), completions (41) and yards (288). In terms of efficiency, Hilinski sported the SEC's third best Success Rate on screens (46.8%) despite a below average yards/attempt (6.13). But as a team, SCar's 3.3 average yards after the catch was below the conference average. More often than not, this West Coast scheme would be bottled up after a modest or minimal gain.
South Carolina's offense had a big play problem. With a heightened emphasis on easy completions to space, less chances were being taken downfield. With more short patterns, boxes were more crowded and made finding room to run more troublesome. This offense played themselves and made creating explosive gains a hard ask all else considered. Unfortunately for this program, this issue wasn't just isolated to last fall. Even in 2018, the Gamecocks' 11.9% Explosive Play Rate was comfortably below the conference average. SCar's rate was even worse this past season. While Vanderbilt was the only other SEC offense with an Explosive Play Rate in the single digits, none had a lower clip than the Gamecocks' 9.08%. Less than 6% of their pass attempts yielded a gain of 20 or more yards. Barely 14% of their rushes gained ten or more yards. Less chunk gains meant playing smaller.
At least, this helped them prevent some mistakes. Already, I mentioned that South Carolina sported the best Negative Run Rate in the SEC despite averaging the lowest rush yards before contact. When it came to passing, getting the ball out quickly helped this offense manage pressure and limit sacks. Granted bad things still happened from time to time, but South Carolina allowed the fifth lowest Pressure Rate in the conference. While their Sack Rate (2.79%) was about average, no offense was better at avoiding broken plays like the Gamecocks. Barely over 4% of their offensive snaps were charted as "broken". No other SEC offense had a clip under 5.4%. By volume, South Carolina's 35 broken plays were the least in the conference by 10 snaps.
While attempting to play modestly and limit mistakes, South Carolina ended up running a lot of plays due to their overall inefficiency. Despite averaging the third most plays/game in the conference, the Gamecocks averaged 28.7 yards/drive, which finished 13th. Their 30.9% Three-and-Out Rate was also bad enough to finish second worst in the SEC. The high volume of plays with the severe lacking in big plays also hurt this unit's Touchdown Rate. By both volume and rate, South Carolina only bested Vanderbilt scoring touchdowns. The Commodores aren't exactly the company you'd like to keep all else considered. This mentality to make the game smaller certainly helped them upend Georgia, but it also played a hand in losing the grip in a few of their losses.
No matter how you slice it, their style of play paired with the shortcomings of their personnel made South Carolina one of the worst offenses in the SEC. South Carolina's 38.8% Success Rate only bested the two bottom feeders within the conference. Along with averaging the SEC's second worst yards/play (5.18), their yards/game and points/game clip was comfortably bottom5 as well. In the eyes of ESPN's SP+ metric, this offense was on par with other titans like Western Kentucky, Cal, and Georgia Southern.
Despite their proclivity to throw, the Gamecocks still ran the ball more than they passed on 1st Downs. Like most passers, this is where Hilinski was often his most efficient. Sure, SCar was wildly average in these spots with a 45.5% Passing Success Rate. But compared to other downs, that level of output was far preferable, which is why the Gamecocks wanted to increase Hilinski's chances in those spots. South Carolina owned the SEC's fifth highest Pass Rate on firsts. To aid in that decision, 1st Downs were where their run game displayed most of its inconsistency. Like their overall clip would suggest, no SEC offense averaged less yards before contact than South Carolina's 1.51 clip on firsts. When the threshold for success on those downs is gaining half of the yards to gain, that puts an awful lot on your backs to consistently forge through contact to meet situational goals. Less than 39% of South Carolina's 1st Down runs resulted in success. All in all, their 42.1% Success Rate ranked 10th within the SEC.
South Carolina's money down tactics certainly caused them to take to the skies. The Gamecocks averaged 7.1 yards to gain on 3rd Downs, which shared the third highest distance in the SEC. Only Vanderbilt was more pass-happy than SCar on thirds. The Gamecocks dropped back to pass on 79.1% of these snaps. But with the higher degree of difficulty, Hilinski overly struggled to be a difference maker. While their Rushing Success Rate was close to 50%, the Gamecocks put up a cool 27% clip through the air. Of their six most called concepts on 3rd Downs -- all of which are passes -- only one boasted a Success Rate over 50%. Handcuffed into trusting a putrid passing attack, SCar sported a 31.6% 3rd Down Success Rate, which was the second worst in the conference.
South Carolina might have had a rocky go of it offensively, but their defense remained firm. While the archaic Total Defense stat kept the Gamecocks out of the top50, they finished as the nation's 30th rated unit by ESPN's SP+. Outside of his first season, all of Muschamp's defenses have finished in that metric's top40. When looking at their performance in SEC play, however, South Carolina was very very average. Maybe that's not that much of a surprise considering how special a number of conference defenses were this past season -- eight SEC teams placed higher than SCar in the SP+ defensively. But the Gamecocks sported an ordinary Defensive Success Rate when facing conference foes. Their 40.1% clip, which ranked seventh within the SEC, highlighted their average unit relative to the rest of the conference.
Thanks to a ballooned standard from the elite defenses in the conference, South Carolina failed to be exemplary in any defensive category. With a bland down-to-down Success Rate, they played the third most snaps per game in SEC play. These extra chances played a big part in grinding the sheen off this unit as game progressed. Though certainly okay the first three quarters, only Arkansas and Texas A&M produced worst Defensive Success Rates in the 4th quarter than the Gamecocks' 45% clip in SEC play. Creating Havoc and disrupting opponents was a constant issue. Though SCar manage to create a decent amount of takeaways -- their 2.32% Takeaway Rate cracked the SEC's top5 -- sacks, tackles for a loss, deflections and other Havoc plays were far too infrequent. South Carolina's 16.3% Havoc Rate was the third worst in SEC play. With fewer disruptions, opponents were able to extend drives and tire them down.
South Carolina was sound against the run. Sure, they were far from the best, but being sure tacklers helped them hold their own. Only Auburn missed few run tackles than South Carolina's 20.2% clip in SEC play. The Gamecocks were pretty good at challenging run lanes and make backs go through them. Despite a blah yards before contact clip, the Gamecocks held SEC backs to the third lowest yards after contact.
With a largely average defense and a sputtering offense, the Gamecocks took a step back lost ground within the division. With Bentley transferring out and with SCar's three most experienced rushers graduating, there is no question this will be Hilinski's offense moving forward. Thrown into the fire as a true freshman rarely yields favorable numbers, and the freshman passer clearly took the torch from his predecessor on leaving much to be desired. He will have to shore up his accuracy and develop more aggressiveness throwing downfield. The question remains if the OLine will be sturdy enough to provide him time in order for new OC Mike Bobo to find production with vertical concepts. Also, it always aids inexperienced passers to have a ground game to help shoulder the load. Hilinski has already been brash about not letting 2019 linger or affect South Carolina's future campaigns. That's good he's accepting the responsibility. Because if his unit flounders again, he will have to answer the bell.
South Carolina's favorite run looks
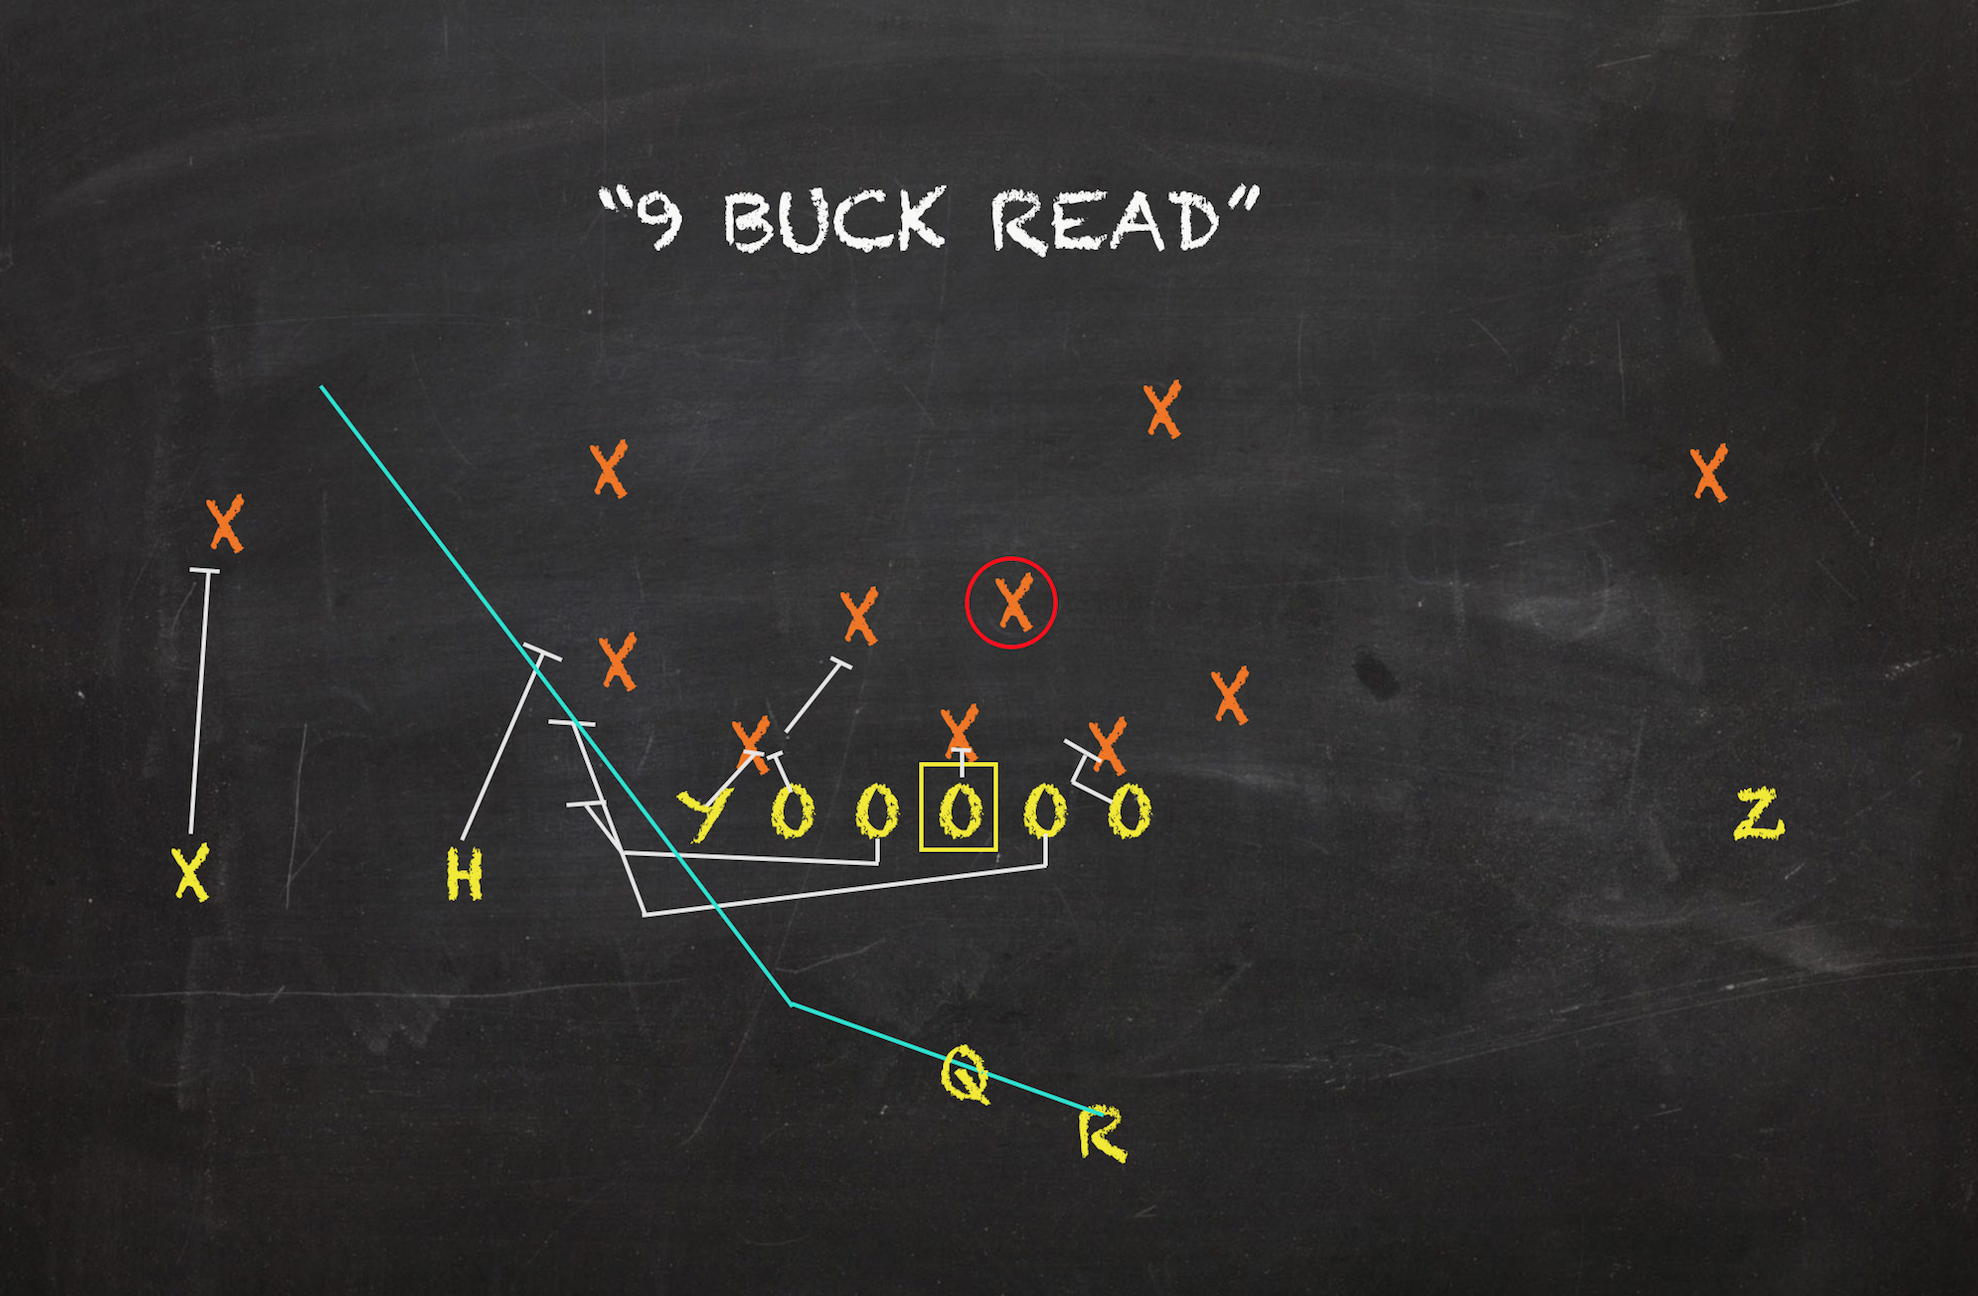
1. Buck Sweep Read 6.52% Play Share 7.82 Y/A 51.8% Success Rate
South Carolina's run game was one of the most unique in the SEC. While they still leaned quite a bit on Inside Zones to fuel their run game, no other offense in the conference had their affinity for outside oriented power runs than the Gamecocks. The Buck Sweep Read sat a top of their play sheet, which was the only instance of a power or gap play doing so within the SEC this past season. Outside of Draws, no other run concept was more consistent. Along with meeting or surpassing situational goals on just under 52% of its reps, the Buck Sweep Read also birthed plenty of big gainers. Now, the threshold in order for a run to be considered "explosive" is ten or more yards. South Carolina used the Buck Sweep Read to generate six carries over 20 yards. At the end of the day, this concept's Explosive Run Rate was 30.4%, which was considerably higher than their 14.2% overall clip. Despite this look's knack for gobbling up yards, it failed to come to the rescue down the stretch. After the Florida game, SCar didn't see another 20-yarder. Over the last three games, not one rep gained more than six yards.
The Buck Sweep is the quintessential outside power play. Made famous by Vince Lombardi, it still a very effective design in modern football. With defenses tilting towards more positionless athletes to fill their ranks, their smaller frames are more vulnerable against two big-bodied guards barreling towards them outside of the bookends. But tagging read and RPO elements on top of this old school staple helped the Gamecocks truly win the numbers game. Though SCar also used non-read Buck Sweeps, the read versions were far more productive. South Carolina used the Buck Sweep as an predominantly as an early down play. They only turned to this look once on a later down, which resulted in an eight yards scamper for a conversion on a 4th Down.
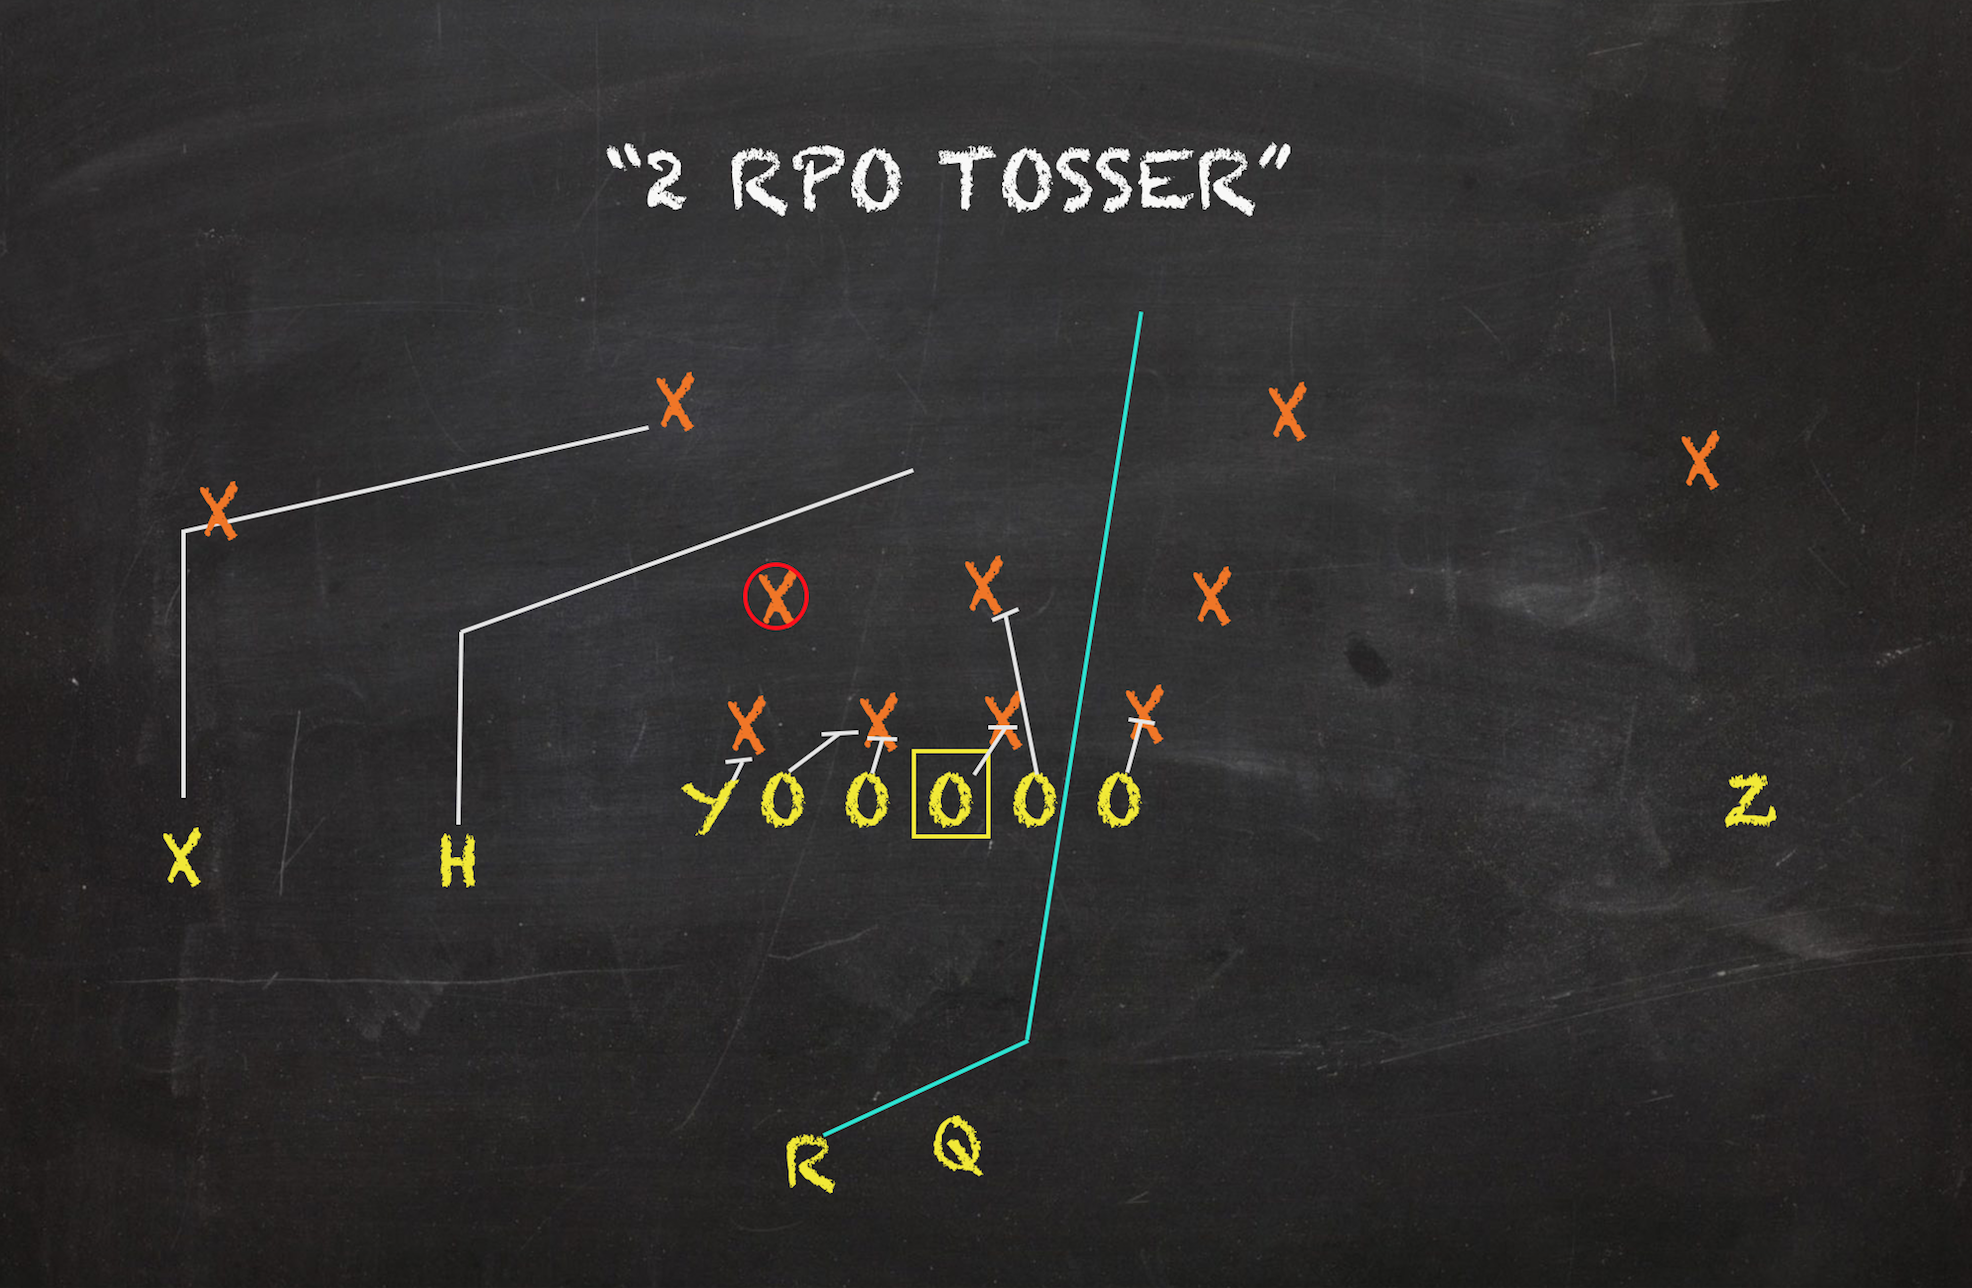
2. Inside Zone Slam Read 5.36% Play Share 7.02 Y/A 45.7% Success Rate
The Inside Zone Slam Read is far and away the most common play in modern spread schemes. A good chunk of college offenses use this look as their bread and butter play to anchor their ground games. Slams are directed towards the B-gap between the guard and tackle. But unlike gap or power schemes, the hole can morph and manifest at other spots along the line based on how the defense is aligned and their post-snap reaction. Though Hilinski wasn't much of a threat to tuck it and run, Slam Reads were often coupled with outlet screens or other downfield route tags via RPOs. In case their numbers were iffy inside the box, their passers had somewhere to go with the ball to make the defense pay. For a run play, this look's 7.02 yards/attempt was one of the team's highest. Even though it was a middling look in terms of Success Rate, South Carolina's backs were able to create a number of breakaways.
Over half of South Carolina's Slam Reads incorporated RPOs. With or without them, this look posted pretty consistent results to its overall figures. Slam Reads were South Carolina's second most favorite 1st Down play behind Buck Sweeps (the latter on received two more looks in those spots than the former). While the Gamecocks were able to still average over 7 yards per pop on firsts, they were far less consistent in executing this concept to start a set of downs. In fact, both early downs saw South Carolina's Success Rate on this look under 40%. Though it was not among one of their six most called looks on 3rd Downs, five of the concept's six reps on the money down resulted in a conversion.
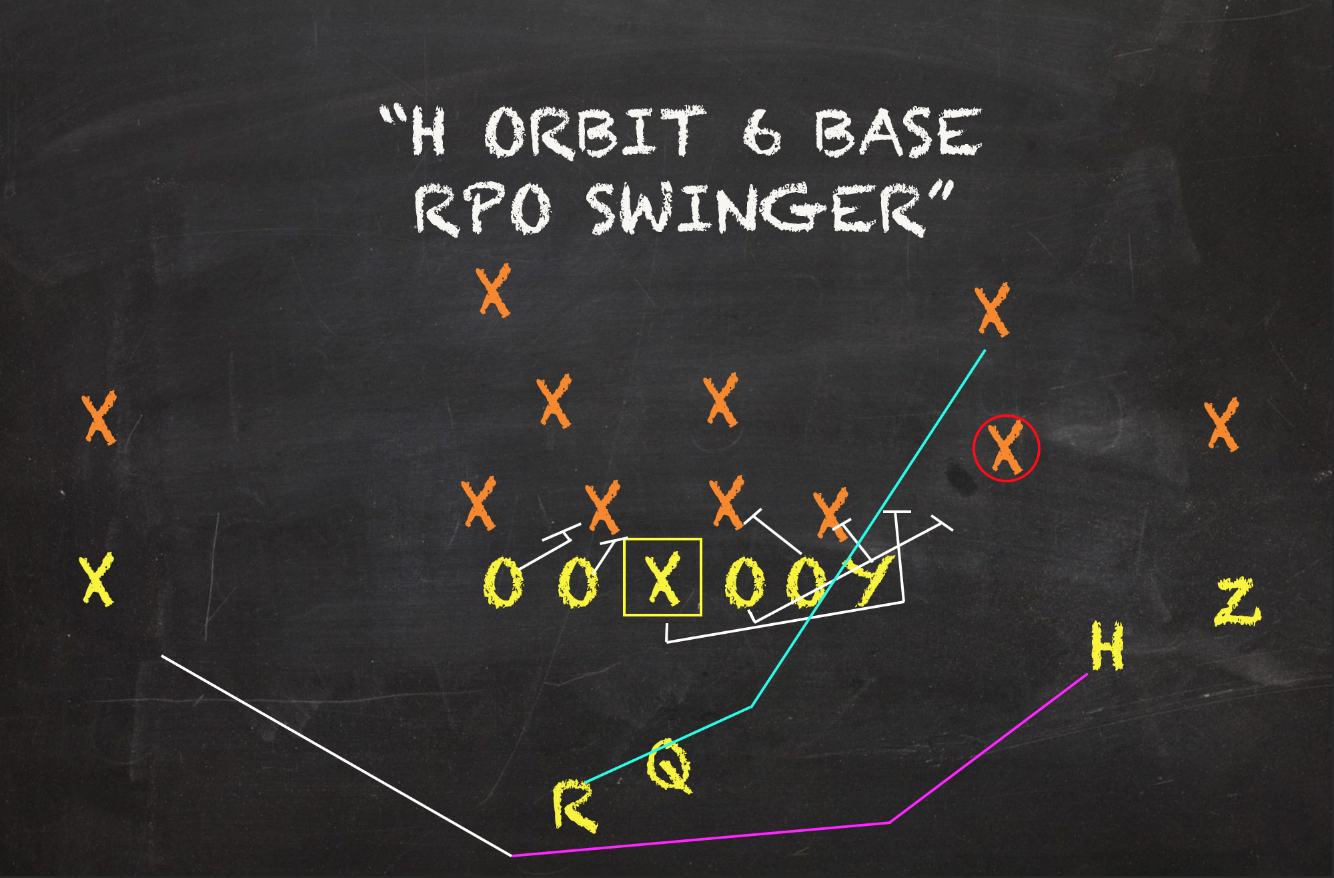
3. Pin/Pull Bases 4.78% Play Share 4.95 Y/A 41.5% Success Rate
Along with the Buck Sweep, Pin and Pull Base runs provided another power wrinkle in South Carolina's scheme towards the perimeter. Both designs share plenty of similarities, but the main difference between those two looks is who is pulling outside. On the Buck Sweep, that task is taken on by both guards. The playside guard becomes the "trapper" -- or edge setter -- and the backside guard becomes the "wrapper" -- or lead blocker. On Bases, the center joins the playside guard as the other puller. The other playside blockers (typically the tackle and at least one TE), violently block down to wash defenders inside so that the pullers can engage with men on the exterior. Though this action screams "POWER", some outside zone wrinkles actually use folds versus certain fronts. South Carolina really liked to go to their two outside power plays when the end man was aligned in a 6-technique -- or headup on the tight end.
Bases emerged early on as a way for South Carolina to have success outside. In Week 3 versus Alabama, read and non-read base action composed about a seventh of their entire script with 12 outright reps for 96 yards. Unfortunately, much of the look's success was buoyed by its production that afternoon against the Tide. All Bases delivered below average results as the year chugged along. Versions with read or RPO elements were more effective than normal Bases. Only four of the 12 non-reads resulted in success while the wrinkle averaged a horrific 1.5 yards/attempt. In general, Bases were not the best early down play for this offense. On 1st and 2nd Downs, Bases only sported a 38.9% Success. But, every one of this concept's reps on the money down got the job done.
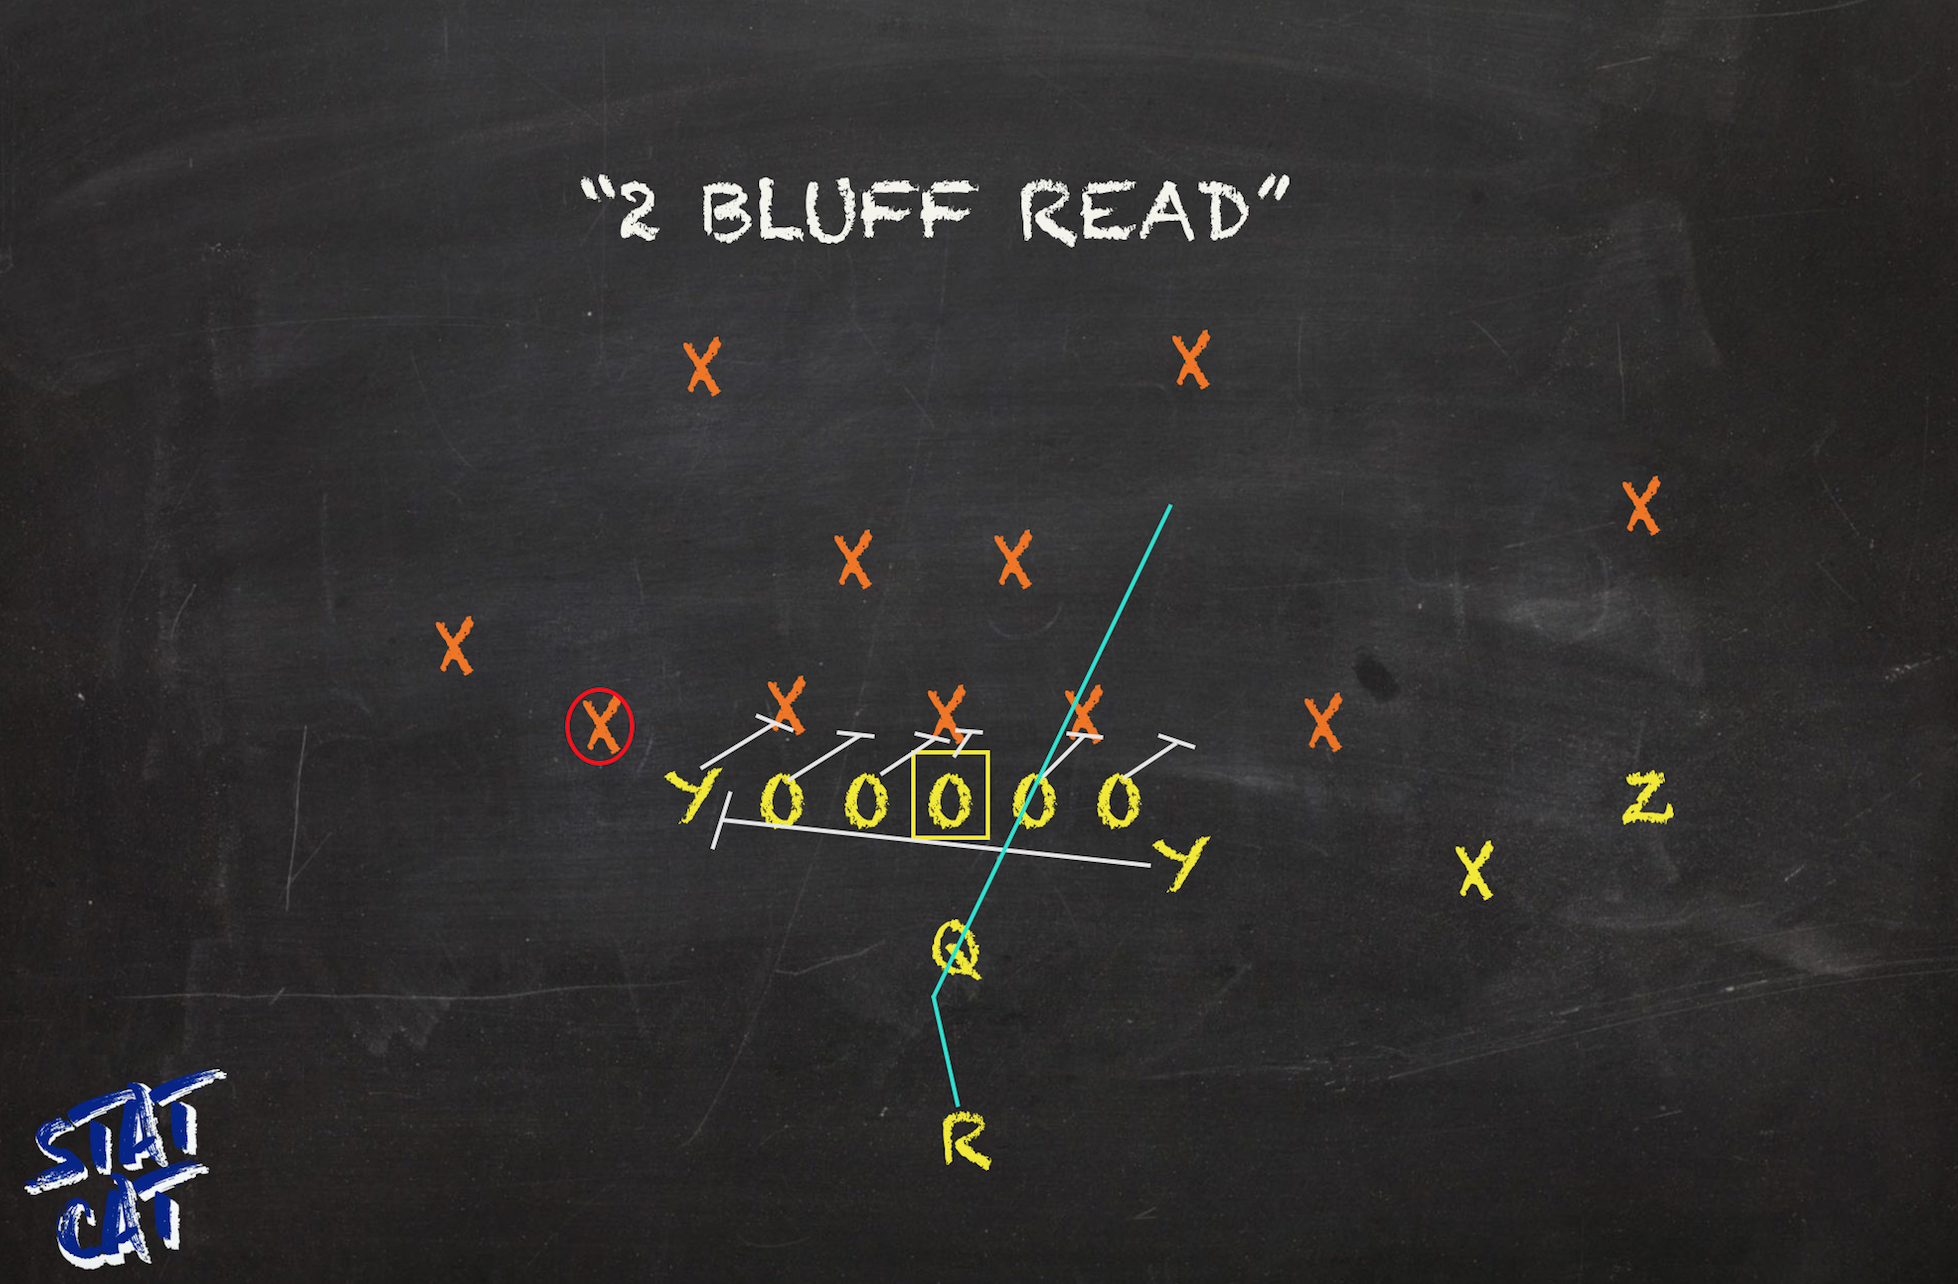
4. Inside Zone Bluff Read 4.77% Play Share 4.41 Y/A 34.2% Success Rate
Bases just edged out Inside Zone Bluff Reads in order to be this offense's third most called concept. But looking at these with their brother, the Slam Read, South Carolina did a pretty good job balancing out the two Inside Zone Reads wrinkles. On the year, the Gamecocks called 45 Slam Reads to 41 Bluff Reads. While both follow basic zone principles and are directed towards the B-gap between the guard and tackle, there is a key characteristic between Slams and Bluffs. Bluff Reads are Split Zones, which call for an offset tight end or fullback to fire against the grain of the playside blocking to seal the endman on the opposite side. In the read game, this player can often arc his path around the edge and become a personal protector for the QB should he choose to keep the ball after this read. Despite the balancing act between Slam and Bluff Reads, the latter was the lesser of the two options. Both Bluff Reads' yards/attempt and Success Rate were considerably worse than what Slam Reads yielded.
The Bluff Read experienced most of its success on 2nd Downs. Half the look's tries met or exceeded situational goals while South Carolina averaged 5.67 yards/attempt. There, only Buck Sweeps received more reps in those spots amongst their run plays. Though Bluff Reads were really dissatisfactory on firsts, the concept was at its worst on the money down. Only one of its six 3rd Down opportunities got the job done. While the majority of Slam Reads incorporated RPOs, barely a third of Bluff Reads utilized route tags. Like Slam Reads, Bluff Reads with and without RPO elements sported similar numbers.
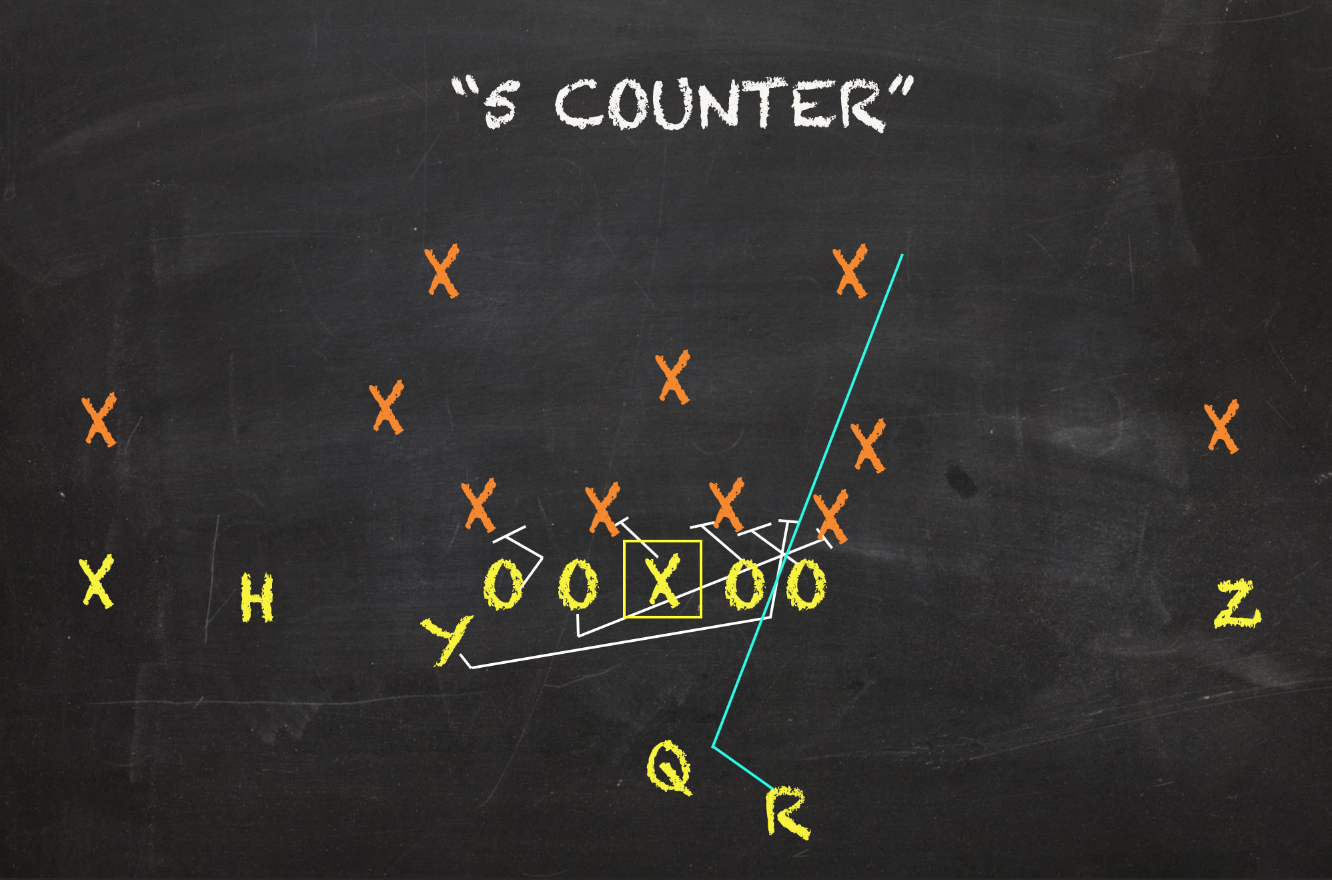
5. Counter 2.56% Play Share 4.95 Y/A 40.9% Success Rate
South Carolina had a clear plan of attack with its favorite ground concepts. If they wanted to go between the tackles, they overly went to their two Inside Zone Reads. When they wanted to gallop around the edge of the formation, they frequently turned to their two Outside Power plays. Traditional Counters rounded out the Gamecocks' five most called run plays because of an underlying need to play physically inside. Since zones call for a coordinated flow from the OLine, backers can key on these designs quicker. The quicker they can diagnose a play, the quicker it can be stuffed. Counters are power runs that feast on over-anxious backers aiming to stile inside zones. Initially, the downblocks undertaken by some of the lineman resemble a normal zone flow. This usually freezes defenders a few beats while the backside guard trapper -- or edge setter -- and tight end/fullback wrapper -- or lead blocker to set up shop after the preliminary misdirection. While the Gamecocks had the right idea to play complimentary football, Counters mostly fell flat for this offense. Of their five most featured runs, only Inside Zone Bluff Reads delivered a worse Success Rate than Counters' 40.9% clip.
As far as play share goes, only Alabama dedicated more plays in its script to traditional Counters than South Carolina within the SEC. On 1st Downs where it was the Gamecocks' fifth favorite play, the look posted its best results. Luckily, that's where the vast majority of their Counters took place. Of the concept's 22 reps on the season, 17 occurred on 1st Down. There, Counters experienced a significant uptick in output. South Carolina averaged 5.76 yards/attempt on a pretty decent 47.1% Success Rate. But since its limited later down reps mostly failed, Counters were a not an optimal play for this offense.
South Carolina's favorite pass looks
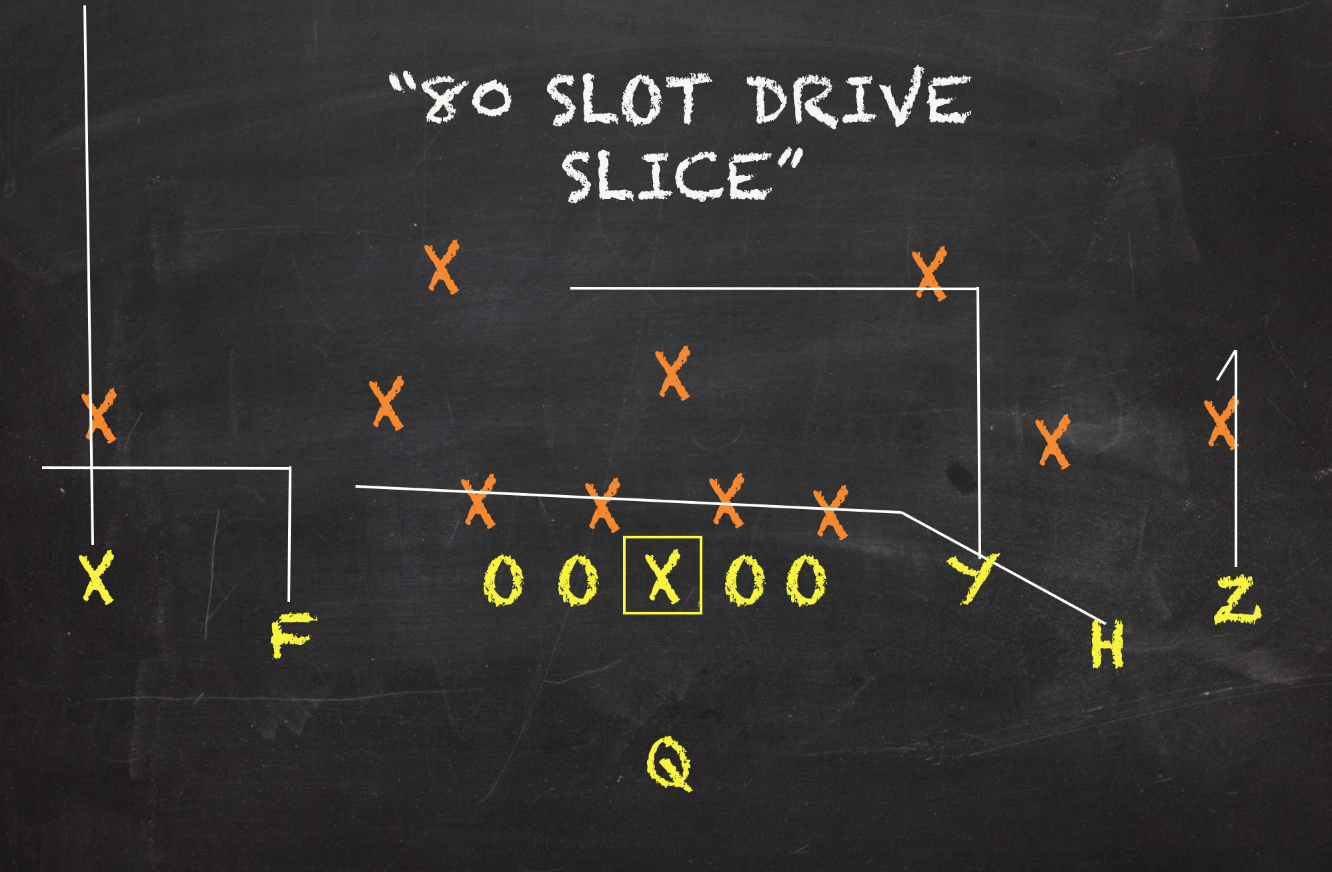
1. Ohio/Slice 3.03% Play Share 8.12 Y/A 60.0% Success Rate
South Carolina -- for better or for worse -- often had to mold its passing attack around their young passer. When veteran Jake Bentley's season was lost after Week 1, plenty of West Coast staples started to creep into the Gamecocks scheme in order to maximize their quick-triggered passer's skill set. Since the Slice concept -- a two man combo consisting of an inside out and outside vertical -- was a simple, defined read, South Carolina turned to it quite often to attack outside the numbers. Getting vertical was a constant hinderance to this offense, but Hilinksi was sound enough targeting the flat and underbelly areas of coverages.
Slice ended the year as the Gamecocks' most successful concept. A big part of getting the most out of a young passer is making them comfortable. Comfort comes with confidence. Since Slice consistently presented easy pitch-and-catch opportunities, which filled Hilinski with confidence. Slice was one of the few pass concepts to see significant reps across all three downs. No matter the down, at least half of the concept's targets resulted in success. On early downs in particular, Slice sported a 61.1% Success Rate. Though the pattern is rather basic, none of their other favorite pass concepts averaged more yards/target. Thanks to its high degree of efficiency, only Buck Sweep Reads and Inside Zone Slam Reads finished the year with more than Slice's 209 yards.
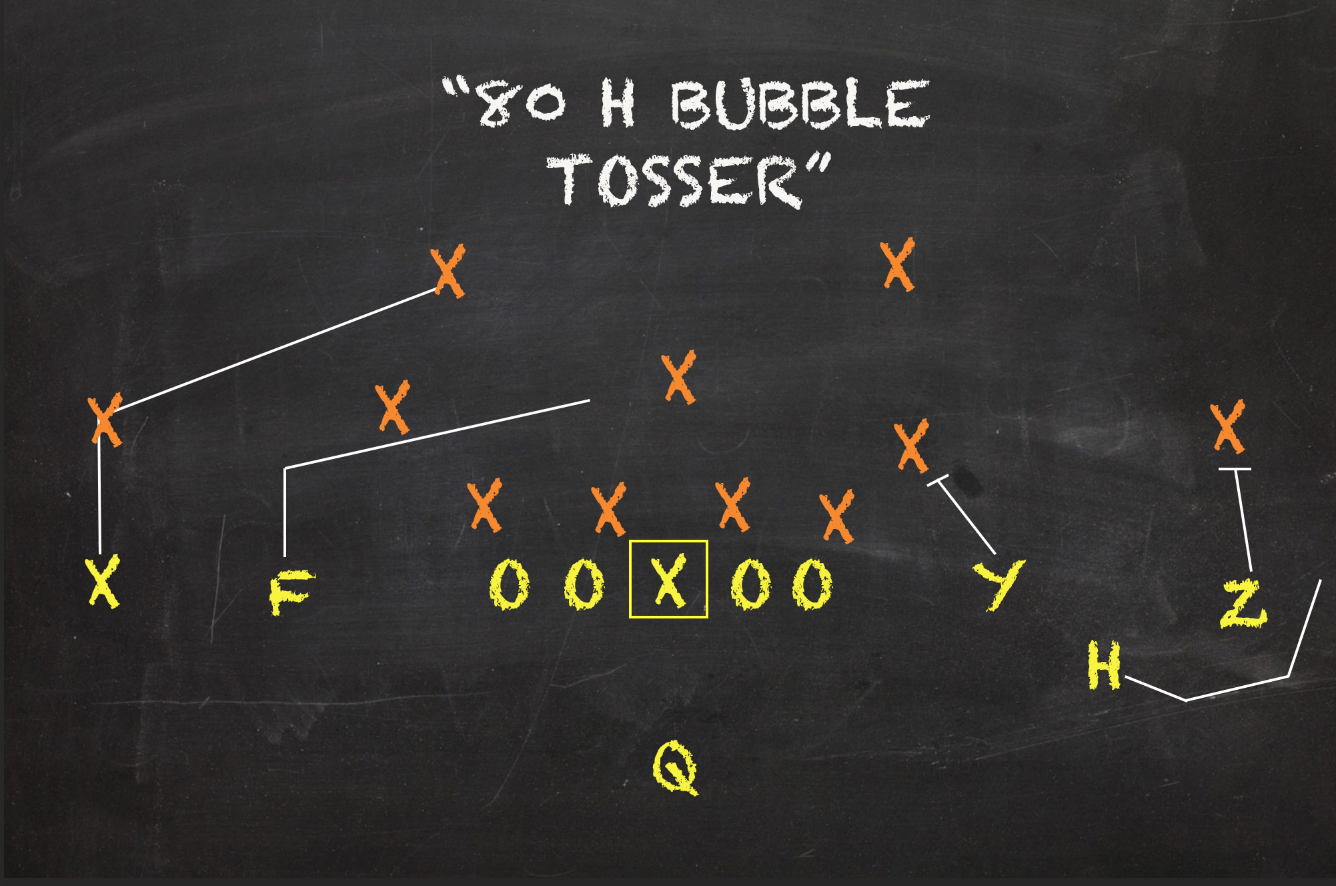
2. Bubble Screens 2.68% Play Share 5.65 Y/A 47.8% Success Rate
With the rise of West Coast principles, these short outlets were embraced by this offense. In this conference when an offense targeted a Bubble Screen, the overwhelming odds would say it was on a Run-Pass Option. Though South Carolina did feature them in that element of their attack, the Gamecocks also used Bubble Screens in their dropback passing game. Since a big part of the West Coast Offense is rooted in short, well-timed passes, these were a natural fit to include in their normal offense. Both RPO and non-RPO Bubble Screens saw equal weight within South Carolina's play share, but dropback designs delivered a better Success Rate. Often seen out of trips or empty formations, Bubble Screens on non-RPO designs were paired opposite Drives, Solo Slants, Rubs, and Fades. Even though RPO Bubble Screens averaged more yards/target, non-RPO's boasted a 58.3% Success Rate compared to a 33.3% clip on RPO attempts.
Bubble Screens were targeted exclusively on early downs. All 23 of this concept's attempts occurred on either 1st or 2nd Down. Most of its reps took place on seconds where Bubble Screens saw a slight uptick in yards/target (6.0). Despite that, only 42.9% of its targets resulted in success compared to 55.6% of their 1st Down chances. On RPO designs, Bubble Screens allowed the Gamecocks to play the numbers game sideline to sideline. On dropbacks, they played a similar role. If the defensive alignment didn't account for all the guys out wide, it was an easy decision for Hilinski to make. Plus, it should be said hitting a Bubble Screen is a relatively easy throw; Nearly 96% of South Carolina's Bubble Screens were completed last season.
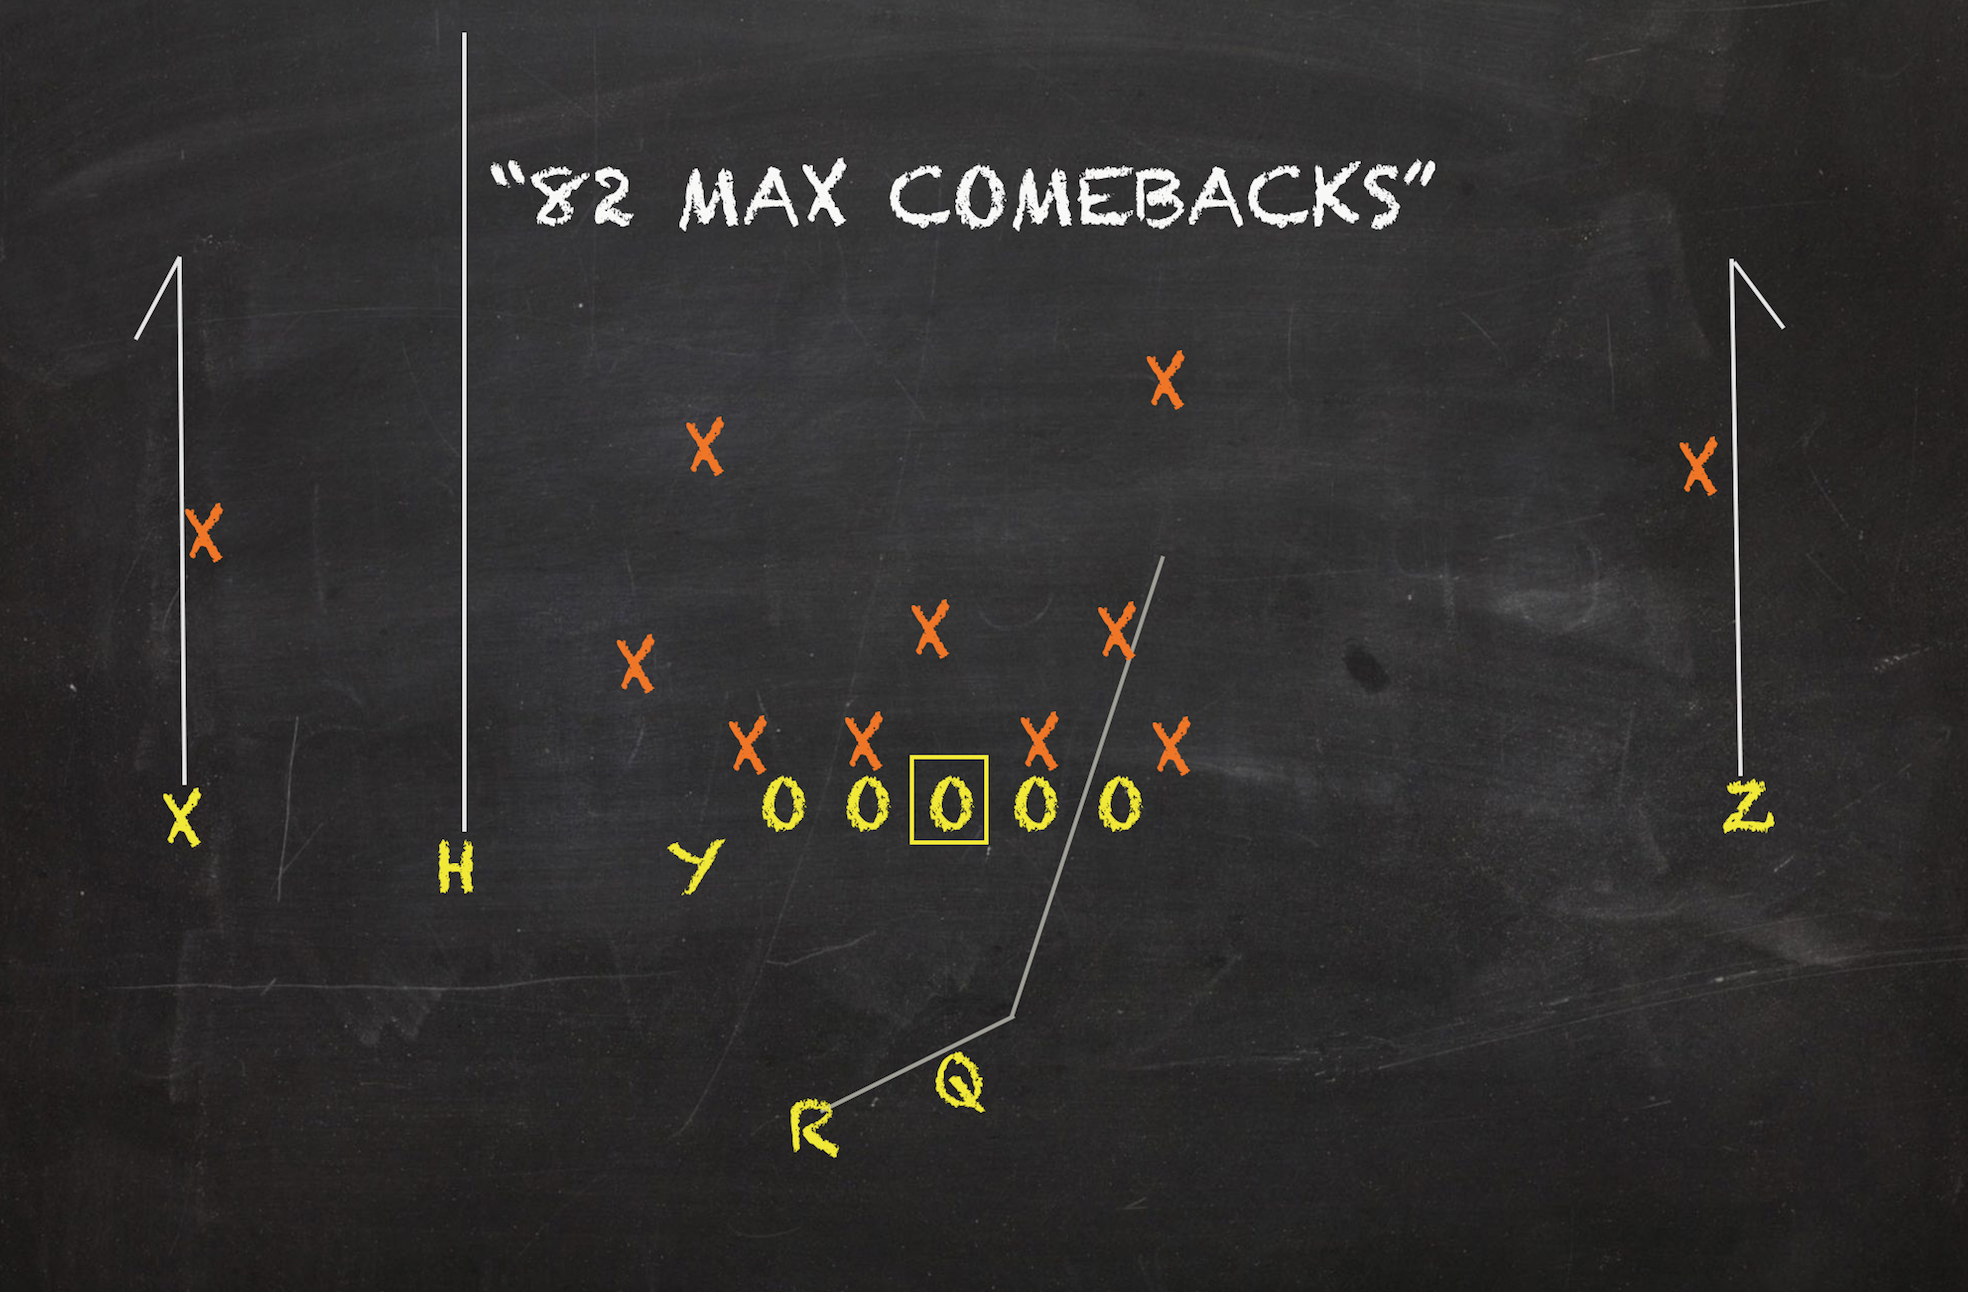
3. Comebacks 2.56% Play Share 4.36 Y/A 31.8% Success Rate
Seam+Sideline combos were other simple pass patterns South Carolina turned to win outside the numbers. When all of this concept's wrinkles are combined, Seam+Sideline combos totaled a 4.3% play share for the Gamecocks. Even though Hoss was more successful, Comebacks saw more usage. Comebacks -- consisting of a titular deep comeback and inside seam -- sounds dismissible due to its lack of brainpower. But despite its simplicity, Comebacks is capable of winning versus numerous coverage. Versus Single high, the deep comeback can often find room working back towards the sideline. Against Cover 2, the middle seams can split the safeties. If the safeties don't respect the verticality of their routes, its an easy completion in the middle of the field. If they hone in on the seam, there's no help left overtop for the corner to defend the comeback. While the concept is straightforward, South Carolina rarely stuck to the traditional design. At times, they'd isolate the deep comeback to one side. Others, they would bastardize the look all together by pairing it with other route combos.
Comebacks was not an effective play for this offense despite providing Hilinski a watered-down read. Though Comebacks saw a decent amount of distribution across the three downs, it mostly was utilized on early downs were 17 of its 22 targets occurred. The look's most consistent down was on seconds where 44.4% of its targets met or exceeded situational goals. Comebacks was a very frustrating look on 1st and 3rd Downs. In those spots, this design yielded 25% and 0% Success Rates, respectfully. Even though the comeback provided a more downfield threat, connecting with that route proved troublesome for this offense. Of SCar's five favorite pass patterns, none finished the year with a lower yards/target than Comebacks. The Hoss concept, which subs in an outside curl/hitch in favor of the deep comeback, finished the year with a 50% Success Rate and probably should have been featured more than its brother concept.
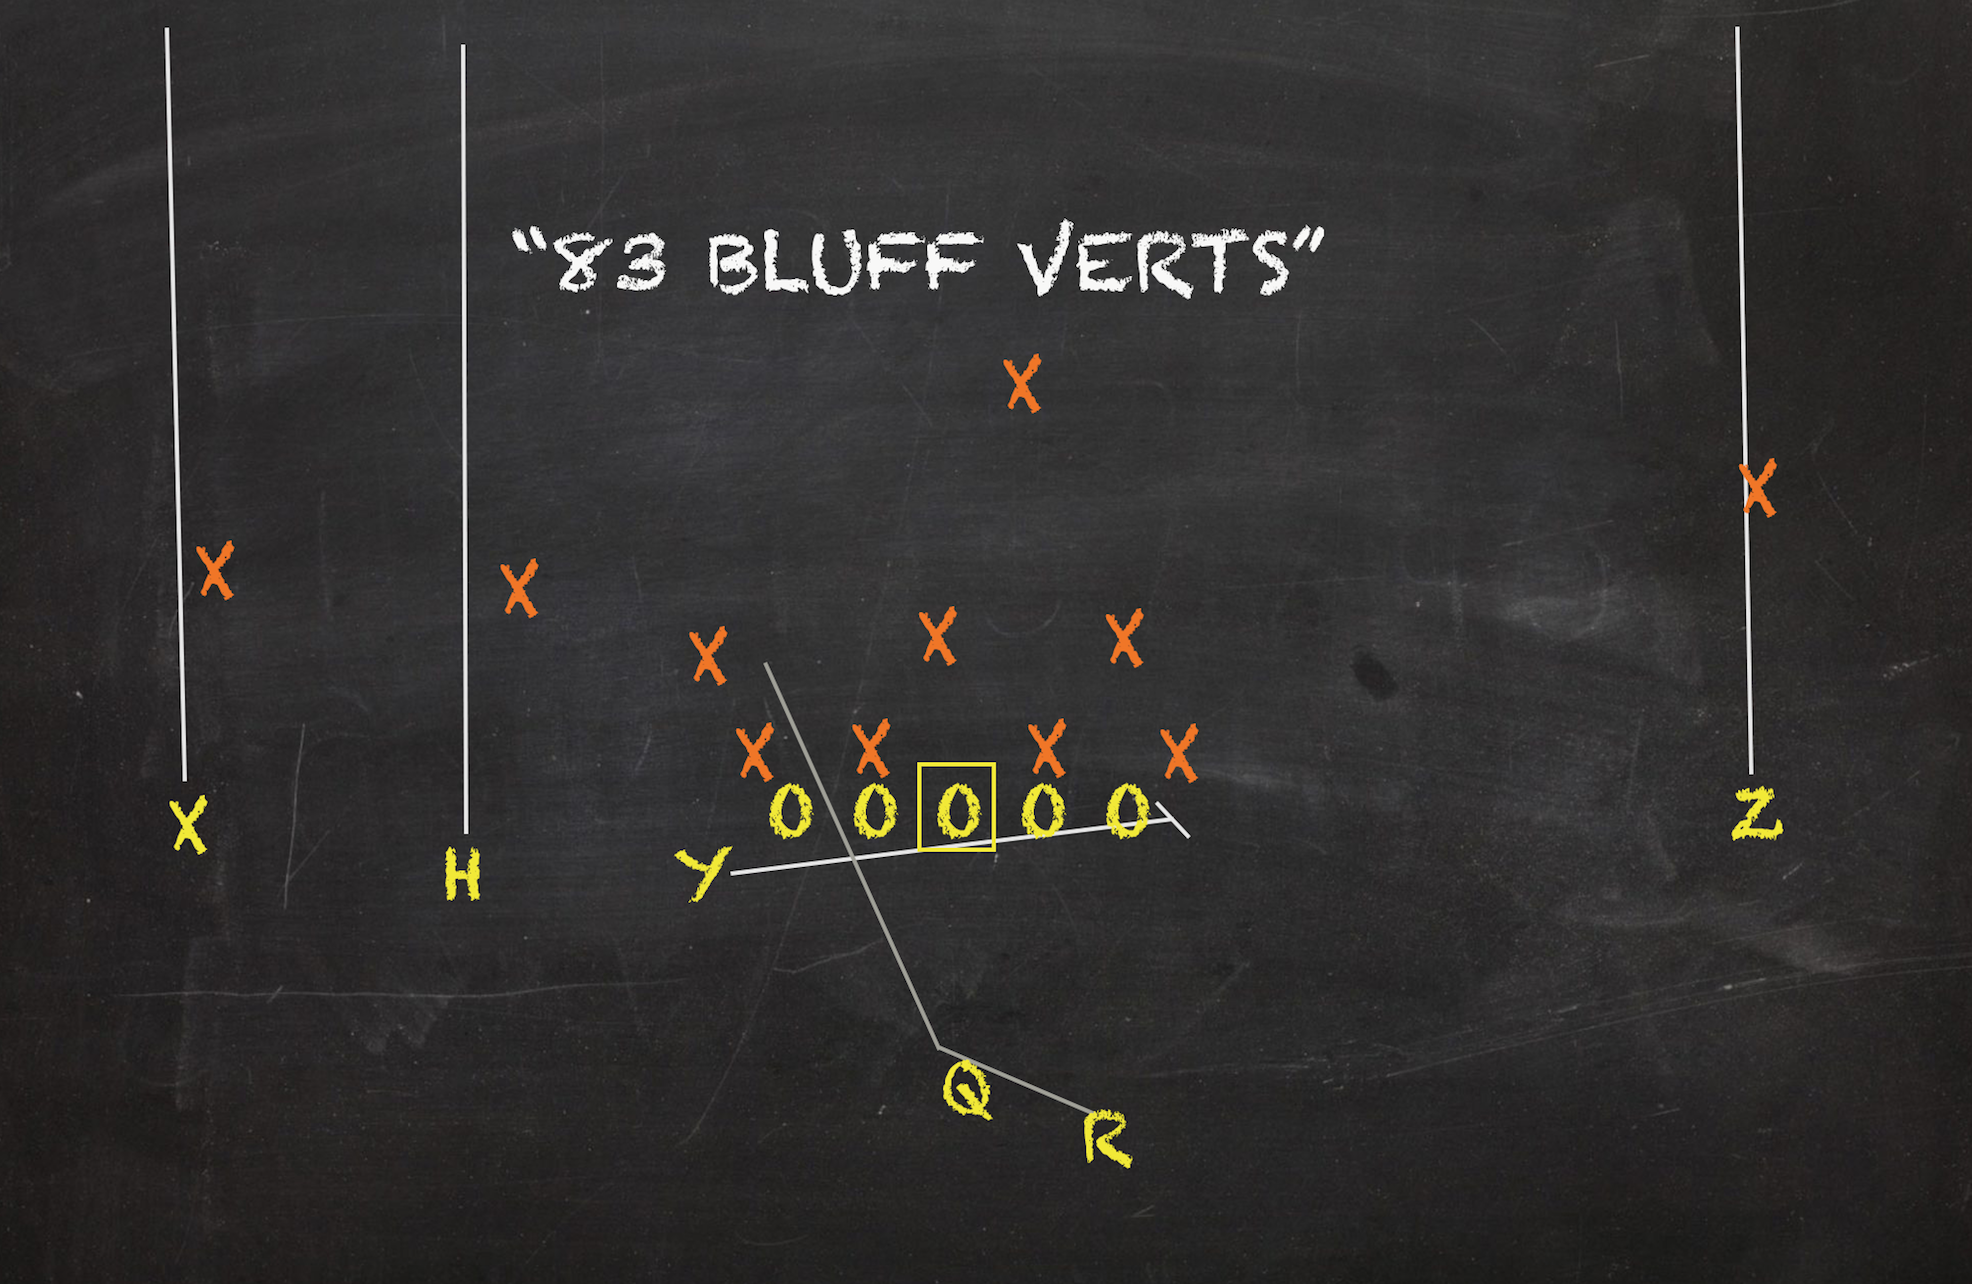
4. All Verts 2.56% Play Share 5.09 Y/A 18.2% Success Rate
Though the vast majority of South Carolina's passing game was West Coast and aimed to work the defenses laterally, All Verts were aggressively featured by this offense when they needed a big play downfield. But since Hilinski's skill set was immensely lacking when it came to the deep ball, the Gamecocks constantly were left shaking their heads. South Carolina joined Missouri, Kentucky, and Vanderbilt as the only SEC offenses who finished below a 20% Success Rate on this concept. Though you'd think someone with Bryan Edwards' frame would be a natural person to target on this deep look, two of the Gamecocks' most targeted players on this concepts were tight ends Kyle Markway and Nick Muse. The duo combined for six targets, three catches and 61 yards. But thanks to one of those catches failing to convert on a third on long, one two resulted in success. The other two successful catches came via Shi Smith, who's four targets on this concept led the team. For what its worth, 40% of Hilinski's attempts on All Verts were charted as uncatchable.
Though you'd think because they frequently played behind the chains that South Carolina went to this look more on 3rd Downs, All Verts saw consistently distribution across the three downs. But in the end, the plurality of this concept's targets occurred on the money down where it was the Gamecocks fifth favorite play. On first and thirds, a quarter of All Verts' attempts resulted in success. While on the surface that is still bad and below the 28.5% SEC Average, that's still better than 0%, which was South Carolina's Success Rate on 2nd Downs.
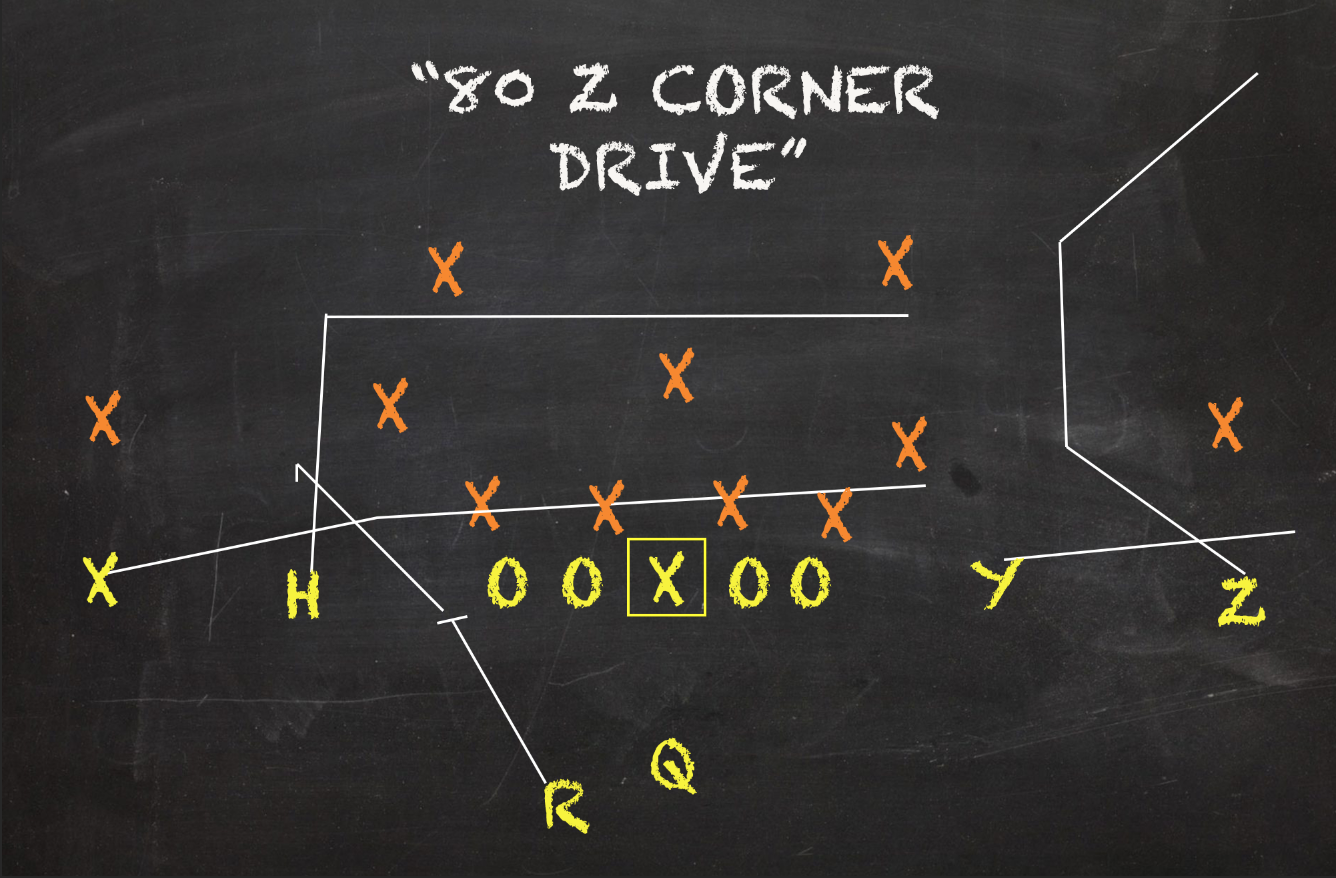
5. Corners 2.44% Play Share 5.24 Y/A 38.1% Success Rate
Smash patterns remain one of the most common pass concepts in the game. Though over the decades this look had morphed and evolved, it still remains an effective pattern in all levels of football. South Carolina leaned on the Corners variation of the Smash family the most. Since coverages too have evolved on how to better hone in on this concept, coordinators had to tweak the basic design to keep them honest. Corners is basically an inverted version of the traditional Smash. While the classic design calls for an outside hitch and inside corner, Corners flips that dynamic and asks the perimeter receiver to run a "C" corner complimented by a flat route by the inside man. That kind of corner can find itself right in the "honey hole" versus Cover 2 or underneath a deep third defender along the sideline. If the passer faces pressure or if the defense overly bails, the flat route is there for the taking.
Corners was often paired with backside flood principles like Crosses, Drives, and Levels. But it wasn't out of the question for this offense to pair it with some zone beaters like Poker -- a common Curl+Flat combo -- or Salem. As lackluster as South Carolina was finding production off of this concept, it was far preferable to other Smashes. Traditional Smashes and Benches delivered deplorable 28.6% and 25% Success Rates, respectfully. Corners saw it's best results when it was called on early downs. On 1st and 2nd Downs, two-thirds of the concept's tries ended in success while averaging 8.33 yards/target. But when the Gamecocks turned to this look on the money down, Corners let them down time and time again. Despite sharing the third-most 3rd Down reps of any concept, Corners only posted a 11.1% Success Rate. No play saw more chances on 4th Downs than Corners' three reps, but only one resulted in a conversion.
Chalking up South Carolina's most successful looks
(min 1.3% Play Share)
1. Ohio/Slice 3.03% Play Share 8.12 Y/A 60.0% Success Rate
This rudimentary two-man combo was the Gamecocks most targeted pass play. Slice consists and an inside out and an outside vertical. Though simple, it can be effective versus numerous coverages. Versus single high coverages, the out route often finds cushion outside the numbers. Against Cover 2 zone, the vertical can find room in the "honey hole" beyond the curl/flat corner and the deep half safety. With Hilinski's affinity for getting the ball out of his hands quickly, he frequently targeted the underneath route. More often than not, that proved to be the effective choice. It wasn't out of the question for the Gamecocks to pair Slice on Draw RPOs. Since the concept was relatively simple, it remained versatile to couple with other passes. From game-to-game, the Gamecocks showed a decent amount of variety on where they deployed Slice. However, South Carolina paired Slice with Drives and Curl+Flat combos the most.
2. Swing Screen 1.75% Play Share 6.33 Y/A 60.0% Success Rate
Swing screens were a notable feature of South Carolina's offense this past season. Even if they weren't always targeted, these were seen via extensions of orbit motion, on RPO designs, and paired opposite isolated routes. Only Kyle Trask threw more true screens within the SEC than Ryan Hilinski's 47. Over a fifth of those attempts were Swings - and that's excluding the RPO targets. South Carolina utilized orbit motion action on 5.36% of their snaps this past season. Alabama was the only team in the conference with a higher usage. The Gamecocks paired Swings on both power and zone read plays. But, the concept delivered better results on non-RPO designs. On those, SCar averaged 7.3 yards/target on a 70% Success Rate. Even if swing action occurred on a fair share of their snaps, the Gamecocks only targeted about one per game on average. Despite being their most consistent look, complimentary patterns coupled with Swings often received more attention. Swings screens saw most of their targets on early downs. The look was at its most efficient on 2nd Downs. There, SCar averaged 8.2 yards/attempt on a 80% Success Rate.
3. Play Action Bootlegs 1.40% Play Share 8.75 Y/A 58.3% Success Rate
Play Action Boots and Waggles were a seldom, yet effective way the Gamecocks manufactured completions for their young passer. Waggles were the more featured wrinkle receiving eight of the concept's 12 tries. Considering their limited reps, it's a wonder why the Gamecocks overly avoided using play action. In general, only Jake Fromm had a lower Play Action Rate among SEC passers who started at least seven games than Hilinski's 16.7%. While the Gamecocks sucked on the ground, there's plenty of evidence to suggest play action works whether or not a team is able to run ball. Though Hilinski's Success Rate only improved marginally off play fakes, it still helped him be better. With Hilinksi being one of the quickest triggers in the conference, Play Action Boots and Waggles provided him quick hot routes in his line of sight. Half of this concepts targets went to the tight end in the flat. Boots and Waggles are essentially the same design. Both incorporate flood principles (most are weakside floods), but where the tight end lines up determines which wrinkle it is. On Boots, the tight end will align away from the run action and run a delayed flat towards the bootleg. On Waggles, they will align on the same side as the run action but run a slide route towards the other side of the formation. This compliments split zone designs that call for that position to fire against the zone blocking flow to set a hard edge on the backside. Overall, this concept was an early down play. Of its 12 reps, 11 occurred on either 1st or 2nd Down. But Boots and Waggles were at their best on first. All four reps resulted in success and the Gamecocks averaged 16.8 yards/attempt.
4. Draw 1.75% Play Share 8.27 Y/A 53.3% Success Rate
Starting in the Alabama game, South Carolina started featuring Draw RPOs as a change-of-pace wrinkle. Often paired with perimeter oriented manbeaters likes Fades, Slices, or the Hoss concept, Draws averaged the most yards/play than any other run concept inside their normal offense. With their pass-heavy scheme getting linebackers on their heels, Draws were a natural way to seize yardage once they made their drops. This was a sporadic look and South Carolina really picked their spots when calling this look. The Gamecocks went five games without a Draw; three others only saw one rep. The two weeks including the Tennessee and Florida games saw the highest usage. Nearly 10% of their play calls sported a Draw action (even if they all didn't result a handoff). Tavien Feaster was far and away their preferred back to run Draws. Only Georgia's D'Andre Swift matched his 12 Draw carries, but no none could top his 132 yards or 66.7% Success Rate off this look within the SEC. The only spot where Draws were disastrous for this offense was on 2nd Downs. All five of the concept's reps there failed to meet situational goals and combined to gain -4 yards.
5. Solo Slant 1.75% Play Share 6.73 Y/A 53.3% Success Rate
A modern tactic for many offense often pairs a zone beating concept on side side of the formation and a manbeater on the other. To help their young passer speed up his thinking and get the ball out of his hands faster, South Carolina fed into this philosophy with a good amount of their passing game. Whether opposite trips or quads or on RPO designs, an isolated Slant was this offense's favorite manbeater to couple with other concepts. Formationally if SCar was granted one-on-one coverage, Hilinski had the green light to target the slant regardless of the down or distance. Solo Slants were seen opposite Bubble and Swing Screens, Spots, and Sticks. SCar did similar things with the "Tosser" -- or dual slants -- wrinkle but those attempts were far less efficient. Tosser delivered a unsavory 26.3% Success Rate on 2.42 yards/attempt while being South Carolina's most targeted Slant Variation. Though the Gamecocks were subpar targeting Tosser, Solo Slants rounded out their top5 most successful concepts on the year. Regardless of what concept they were coupled with, Solo Slants saw their best numbers on 1st Downs. On firsts, the Gamecocks boasted a 83.3% Success Rate and 11.3 yards/target. On the other two downs, they look was rather disappointing. There, Solo Slants only averaged 3.67 yards/target with only a third of its reps resulting in success.
Where South Carolina's weapons ranked
From afar, South Carolina fans always seemed lukewarm on Jake Bentley. Though he was overly competent, he frequently made plays that preventing the Gamecocks from getting over the hump. From where I'm sitting, he was a middle-of-the-road SEC starter. But entering his senior season, the bar was raised. With four top10 teams on the schedule, Bentley couldn't afford another pedestrian season if he was to quarterback his team to a bowl birth. Of course, it all went sideways in a hurry. Bentley had one of his worst days throwing the ball and was outdueled by a true freshman as South Carolina blew an 11-point 4th quarter lead to their rivals to the north.
Though it was revealed soon after that Bentley broke his foot, that was the kind of performance that had become all too commonplace with him undercenter. Certainly Bentley would have remained the starter if he didn't get sidelined, but it was time for this offense to move in a new direction. True freshman Ryan Hilinksi -- one of the country's top pro-style prospects -- took control of this offense and instantly provided a spark. You often see this in sports. When the incumbent or long-time starter is supplanted by a back up, opponents can play more conservatively when feeling out a newbie. With such limited tape on a player, defensive coordinators often play it safe. Faced with more manilla designs and a lesser opponent, Hilinski's play in his first start helped the Gamecocks top 70 points. Despite the gaudy point total and 58.1% Passing Success Rate that afternoon, that game provided a nice litmus test for how the green passer would be utilized moving forward.
Hilinski had no issue playing hot potato with the football. For much of the season, he averaged the SEC's quickest time to throw. At the end of the year, Ole Miss's Matt Corral's 2.03 average time to throw just edged out Hilinski's 2.05 clip for honors for quickest trigger in the conference. This was a drastic about face year over year. By our charting, only Tua Tagovailoa averaged more time to throw within the SEC last season than Bentley's 2.82 average. I understand the aspect of a young passer wanting to get the ball to an outlet in space efficiently, but there were often times Hilinski sped himself up. This unnecessary urgency led to off-target tosses, which often hurt his targets' forward momentum when they tried to corral an attempt. This also resulted in Hilinski passing up more rewarding throws for quick gains. Rather than letting a design marinate an extra few beats, he overly preferred to seize a few quick yards underneath and hope his receiver could do some more damage after the catch. Hilinski is a west coast kid. Though its not always the case with those who grow up adjacent to the Pacific, he also was molded to thrive in West Coast Offenses, which strive to stress defenses horizontally in the short areas of the field. Passers have to be accurate, nuanced, and possess good timing with their targets. The ball must come out on time as the passer is mostly a facilitator rather than a playmaker. Processing speed and decision making are at a premium in that scheme. Of course, those are two characteristics most young passers take time to develop.

As you can imagine due to the West Coast Offense emphasizing short routes and Hilinski's quick release, the freshman had the second lowest average depth of target in the SEC. While Bentley too had one of the lower ADOTs in the conference last season, his 9.04 clip greatly exceeded Hilinksi's 7.30 average. Nickel and diming is an okay way to play when chemistry and contested pass catching is optimal. When both elements are average or below average, this style of play not only negates the advantage of passing the ball but shoehorns you into more downs behind the chains, which makes play calling that much more challenging. No SEC passer had a higher percentage of their throws travel less than ten yards downfield than Hilinski's 73.5% clip. Only Vanderbilt's Riley Neal saw a greater percentage of his pass yards come after the catch than Hilinski. "Air Yards" composed less than 37% of his total output.
But after awhile, you eventually need to take the top off of defenses in order to prevent DBs from crowding the box and meddling with the timing of the short routes. Only LSU's Joe Burrow, Georgia's Jake Fromm, and Auburn's Bo Nix took more deep shots within the SEC than Hilinski's 38 attempts. While he was the fourth highest per volume in this respect, Hilinski had the fourth lowest Deep Pass Rate at just 9.34%. Of SEC passers with at least ten attempts 20 or more yards downfield, Hilinski's 18.4% Completion% fell into the bottom5 of qualifiers.
Play action was a tactic this offense used sparingly to take advantage of creeping safeties. Even last year, Bentley's 13% Play Action Rate was near the conference floor. While Hilinski's 16.7% clip was a bottom5 rate within the SEC, a good chunk of his deep attempts utilized play fakes; over 47% of them to be exact. Despite not aiding his deep ball, play action noticeably helped begat more success passing the football. On play action throws that traveled less than 20 yards downfield, Hilinski saw an increase in Success Rate (47.3%), Depth Adjusted Accuracy (43.6%), and First Down+Touchdown Rate (32.4%) compared to his overall numbers.
But with the freshman's affinity for the short stuff, his inability to connect deep, or the increased difficulty of his targets making plays after the catch, Hilinski ended the season as one of the SEC's least efficient quarterbacks. Outside of this underwhelming 5.79 yards/pass, Hilinski finished in the bottom5 within the conference in Depth Adjusted Accuracy and First Down+Touchdown Rate. Only Deuce Wallace, who failed to have a single completion net 20 or more yards, ended the year with a worse Explosive Pass Rate than Hilinski's 5.65% clip. Though by a percentage basis his Interceptable Pass Rate was better than the conference mean, his 27 by volume were tied with Florida' Kyle Trask for the most in the SEC. Serving up about two chances a game for the defense to potentially snatch the ball is not a great way to play effectively. While you might be able to guess his 39.6% Success Rate was below average due to the incessant futility moving the ball through the air, its more concerning to see Hilinski's Accuracy% fall below average considering the copious amounts of short throws with which he padded his passing figures.
What should be much more concerning to Gamecock fans is how the young passer handled himself from clean pockets. Scouts and analysts often put more weight when evaluating a passer on these attempts, because they are a more consistent reflection of someone's ability down-to-down. Simply put, pressures occur far less often than snaps without pressure. By examining how a player does "when conditions are perfect", there are less variables to point to and say they effected the outcome. After all if a passer can't perform adequately when everything functioned as designed, how can you expect them to rise to the occasion once everything breaks down and chaos ensues. Thanks to his internal clock, Hilinski performed okay versus pressure considering his age. With him excessively getting the ball out quickly whether pressured or not, Hilinski's play was relatively better when under duress. While he was top10 within the conference in all of the above metrics against pressure, he was comfortably below average overall. Like his cumulative number would suggest, Hilinski was risk adverse when pressured. No SEC QB had a lower ADOT when under duress than his 7.45 clip. Despite representing the conference's floor in this regard, Hilinski experienced an uptick in explosive plays. Since he held onto the ball longer on average when pressured, plays were allowed to develop further and were more prone to generating a chunk gain. Though still dreadfully below average relative to the rest of the SEC, Hilinski's Explosive Pass Rate climbed up to 6.74% when pressured, which was rated 11/19 qualifiers.

Despite being "Jeff Fisher mediocre" against pressure, Hilinski was flat out terrible from clean pockets. Outside of his Interceptable Pass Rate that was near the SEC average, the freshman finished the season inside the conference's bottom5 in Passing Success Rate, Depth Adjusted Accuracy, and First Down+TD Rate when kept clean. Like his overall figures insinuated, Hilinski really didn't push the ball downfield too often. He was content picking at the underbelly of coverages rather than trying his luck overtop. Again because he often rushed his read and wanted to get the ball out, he struggled with his precision. Though his raw Accuracy% was less damning, Hilinski only outperformed Tennessee's Brian Mauer (a scattershot, turnover prone passer in his own right), Kentucky's Sawyer Smith (who was forced to suit up with numerous upper-body injuries that clearly affected his play) and Lynn Bowden (a wide receiver who was frequently asked to complete deep shots when he wasn't fueling UK's ground game) in terms of Depth Adjusted Accuracy from clean pockets within the SEC.

With today's modern schemes hiding passers behind screens and RPO's, it's important to break out a quarterback's figures on pure dropbacks. By doing so, you can get a better perception of someone's overall ability and whether or not coaches aggressively attempted to hide his shortcomings. In the glance section, I already talked a bit on how this offense made use of plenty of screens. Over 11% of Hilinski's attempts were screens. Plus when you notice nearly 13% of his attempts utilized RPOs, you can step back and recognize all the ways this staff tried to beef up its passing numbers. Though Hilinski had a higher Dropback Pass Rate than other young SEC quarterbacks, his stats were obviously ballooned by screens and RPOs.
From sideline to sideline, Hilinski was not a strong passer. Thanks to his frequent throws to the flat, he was most accurate outside the numbers. His 50.6% Accuracy was the closest to the SEC average than any other area of the field. Not to sound redundant, but these were overwhelmingly short throws. But thanks to his pedestrian precision, his Success Rate outside the numbers was his closest clip to the SEC average. By raw weight, throws between the numbers and the hashes was where the young quarterback displayed his best accuracy. Failing to complete 60% of your passes is seen as inefficient in today's game. It's hard to surpass that number if you aren't even accurate on two-thirds of your throws. While its easy to make excuses due to his age and lack of experience, this will be a major obstacle to hurdle now that this is his offense moving forward. While poise, nuance, and intangibles can improve with more reps, very rarely does accuracy follow the same kind of trajectory.
With Hilinski's tepid nature and inconsistent ball placement, South Carolina's receivers finished the year with lackluster stats. As much as a playmaker as Deebo Samuel was for the Gamecock offense, he was a middling player in terms of Success Rate. South Carolina's next two players in the passing pecking order each sported higher yards/target. But with his X-factor abilities taken to the professional ranks, defenses could now defend this offense without having an eye on Samuel. Due to the extra attention Samuel received, Bryan Edwards and Shi Smith were able to be more advantageous with their targets, which resulted in more chunk gains. All three finished with an Explosive Catch Rate over 11%. None of the Gamecocks three main targets reached that threshold this season due to West Coast philosophies commandeering this offense and Hilinski's below average deep ball.
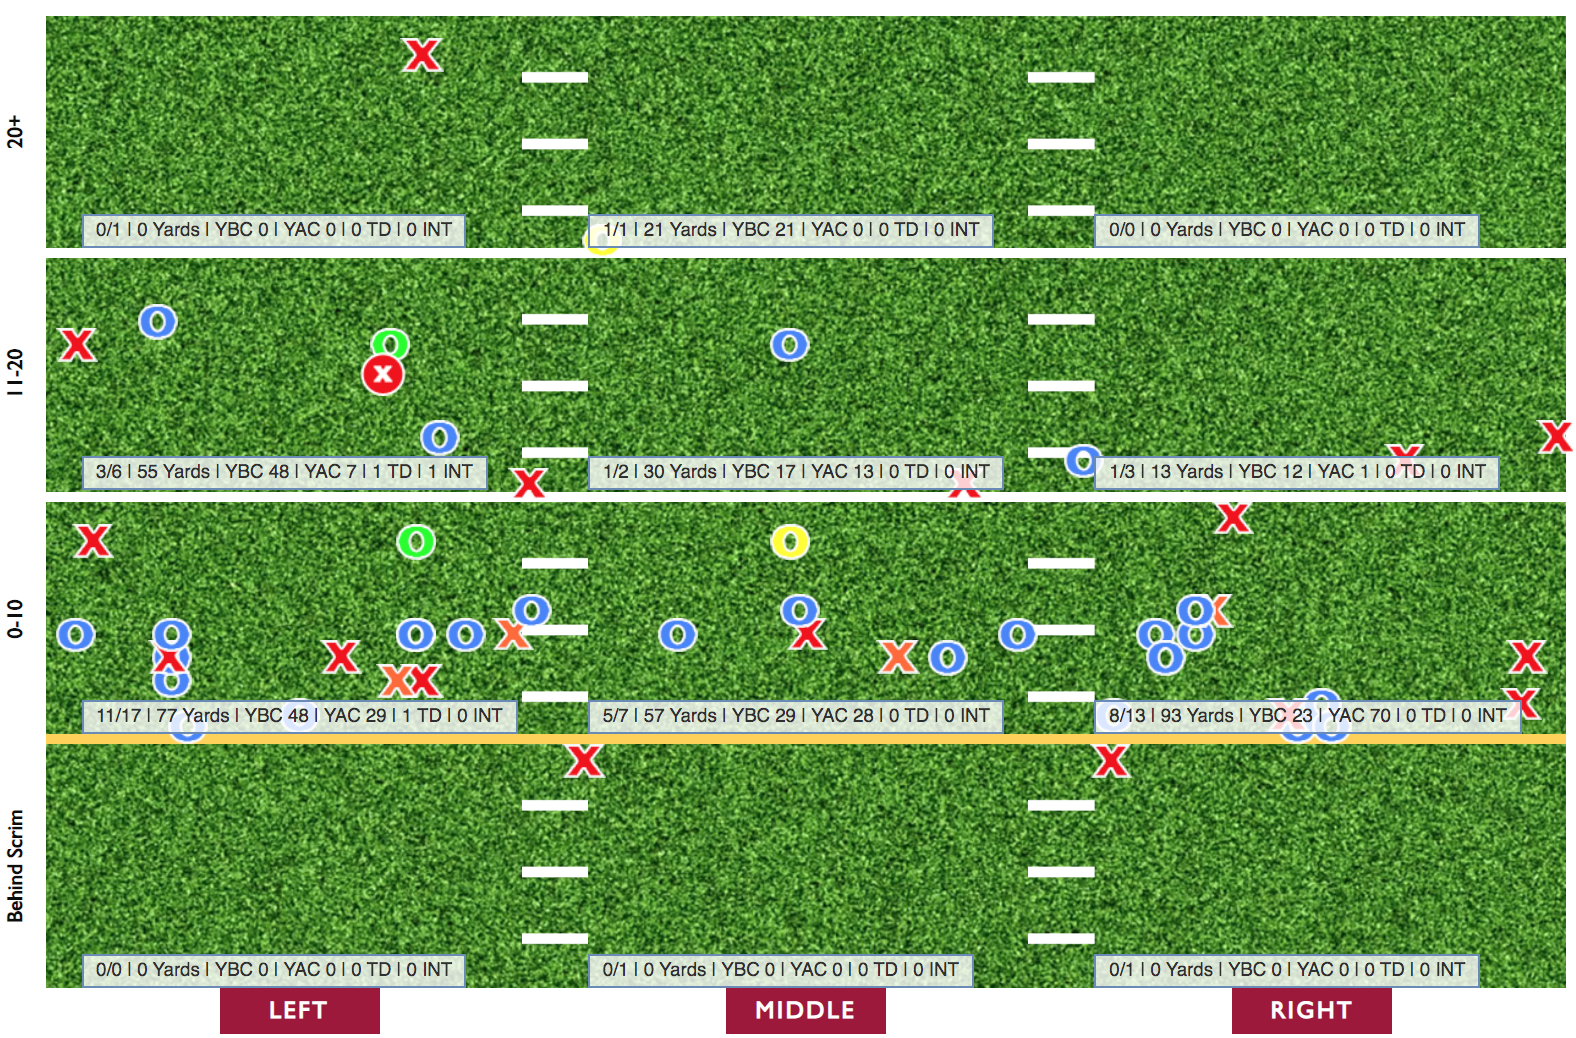
When Deebo Samuel was around, Bryan Edwards was South Carolina's clear number two receiver. This year, there was no doubt who was the big dog outside. Edwards commanded 110 targets, which was the fourth most in the SEC. Last year, Edwards primarily operated as the Gamecocks Z receiver -- often lining up on the far right of the formation. His role was to operate as an up-and-down target outside the numbers. Of his 85 targets in 2018, 70% of his targets were directed outside the numbers to the right. There was a clear role for him to scratch. Looking at his catch chart below, he was much more versatile in his senior campaign. Since the was the main receiver, he was often looked upon to make a play in a variety of ways. Even though he was one of most productive deep receivers a year prior, Bryant soon saw reps on Utah passes, jet sweeps, and screens. Rather than lining up predominately at the Z-spot, he started to move around the formation.

Though more short targets helped him see a slight improvement in his Success Rate, his yards/target fell by about a yard and a half and, his Depth Adjusted Catch Rate -- that omits uncatchable targets and places a premium the further a player is downfield -- fell by about 16 percentage points year over year. Nearly a fifth of his targets were charted as uncatchable, which obviously would hurt anyone's overall numbers. With the increased emphasis on West Coast principles, Edwards responded nicely to the new scheme. Not many wide-frame receivers can be effective playmakers in space. Edwards' average gain after the catch was among the 15 best clips in the SEC. Speaking of his wide-frame. Edwards was commonly looked upon to win jump ball against defenders. Though he saw the eighth most contested targets on the year, his Contested Catch Rate was only above average. But subpar passing constantly hindered his potency. When those contested targets where charted as accurate, his clip shot up to 88.9%. Hilinski wasn't the best deep ball passer so much that he negated one of Edwards' best traits. Though his 174 deep receiving yards cracked the conference's top15, he only was able to corral a quarter of his deep targets. With a lower degree of difficulty on his chances, Edwards dropped fewer balls than in 2018. His Drop Rate went from over 10% to 3.64%. While that's all well and good, being just okay or significantly below average analytically is not where you'd like your top receiving option to finish the year.
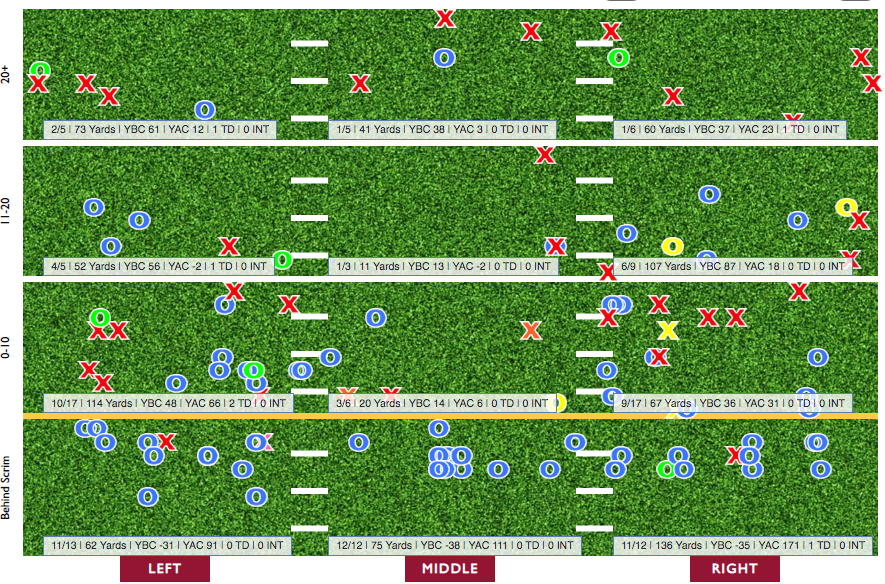
Shi Smith was the team's second most targeted player and one of the least efficient outlets in the SEC. Though his Catching Success Rate crossed the 50% plateau in 2018, a high Uncatchable Target Rate drastically reduced his ceiling this past season. Nearly 23% of his targets were charted as such. That clip was almost high enough to finished in the bottom10 in the conference. With Hilinski's style of play anchoring most of the Gamecocks receivers closer to the line of scrimmage, that's where the vast majority of his damage took place. Over three-fourths of his catches and 44% of his yards came on throws less than ten yards downfield. Though Smith found a nice pocket on intermediate throws to the left, nearly 42% of his targets beyond ten yards were uncatchable. With so many wayward tosses his way, his efficiency took a massive hit. Smith finished inside the SEC's bottom10 in Catching Success Rate, Catch Rate, yards/target, and First Down+Touchdown Rate. Though he shared the team's top number of 3rd Down targets with Edwards (each player commanded 29), he was the lesser of the two options. While Edwards managed to be about average, Smith was one of the worst on the money down with a paltry 27.6% Success Rate. But again, that's not necessarily a knock on Smith himself. But due to his smaller frame and Hilinski's trouble threading the needle, Smith's numbers clearly soured over the course of the year. In addition to being one of the worst options to target on 3rd Downs, the slot had issues being consistent on contested catches. Less than a quarter of those targets resulted in a completion. But Smith was as sure-handed as they come. His 1.25% Drop Rate was the best clip amongst SEC qualifiers. Smith's lone drop came on a contested target.
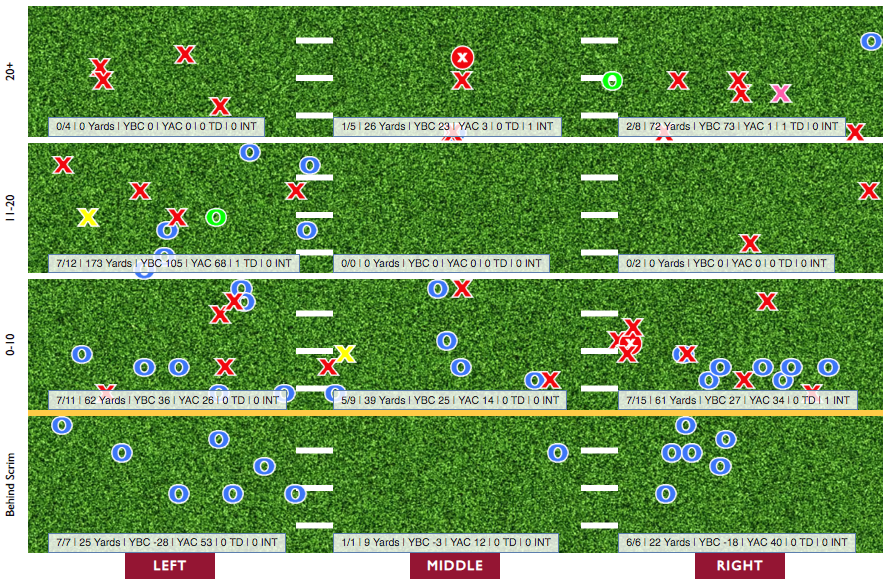

Like most tight ends in this conference, Kyle Markway was predominately a safety valve in the flat or in other vulnerable spots in the defensive coverage. In South Carolina's pace and space West Coast attack, Markway often was targeted quickly before the defense honed in an his quick routes. Though a good deal of tight ends come to expect plenty of tight windows and contested targets, barely a fifth of Markway's targets were charted as contests. For reference, fellow Gamecock tight end Nick Muse's Contest Target Rate was 42%. Plenty of chances or not, Markway was exceptional winning those battles. HIs 54.6% Contested Catch Rate was among the five best in the SEC. Despite that and the fact he led their main options in Depth Adjusted Catch Rate, Markway had butterfingers last fall. He was one of eleven SEC players with five drops. Sure, that kept him out of the bottom10 by volume. But considering the number of targets he received, his Drop Rate was amongst the conference's bottom5. Though he led all Gamecocks with at least 15 targets in yards/catch, Markway was overly a lackluster outlet. Since his role was pretty defined and wasn't asked to go gangbusters, his conservative usage yielded a very below average season as far as analytics are concerned. His Success Rate on throws less than ten yards was just 46.1% and dropped to 38.5% on throws beyond that mark. Of course in this offense, he never set out to be a vertical option. His lone deep catch was a created reception for 21 yards. Outside of his Depth Adjusted Catch Rate, Markway literally finished below the conference average across the board.
With a passing scheme that really didn't threaten safeties if they crowded the box, South Carolina's run game struggled to find room to operate this past season. Even with the increased emphasis on power and gap designs in their script, the Gamecocks' run game was blah. With the increased body count in the box, they really struggled to forge run lanes and create breakaways. As aforementioned, no SEC offense averaged less yards before contact than SCar's 1.79 clip on designed carries. Naturally, the added obstacles in their rush lanes proved quite a challenge for this unit to create explosive runs. Failing to take the top off of secondaries who dared to overload the box resulted in South Carolina's 14.3% Explosive Run Rate. For context, only Tennessee's rate was worse within the SEC. With a committee type of approach, there was plenty of blame to go around.

Rico Dowdle had become accustomed to operating as this offense's bellcow back. His sophomore season was the only year where he failed to rack up over 100 carries. Despite his volume, Dowdle was about an average producer as he failed to surpass 800 rush yards in any of his collegiate seasons. If run lanes were presented for him, he held his own. That certainly was the case last year. In 2018, Dowdle had about an average yards before contact clip relative and finished with about an average Success Rate relative to the SEC. In 2019 averaging less than 2 yards before contact, Dowdle saw a massive regression in his overall figures. Sure his volume numbers took a hit as he missed some games, but he was a subpar back across the board.
Dowdle was never the best squirting out of tackles or bullying tacklers after contact. That kind of playing style will surely downturn if its run blocking follows suit. While there's something to be said about trusting your line to play smashmouth, Dowdle didn't have much of a choice. Though the Gamecocks still featured quite a bit of zone plays, their frequently called power designs provided less wiggle room if the Gamecocks line failed at the point of attack. Down-to-down, Dowdle's Rushing Success Rate finished in the SEC's bottom10. Again, the early contact by defenders won out over the course of the season. About 12.2% of his carries experienced defensive engagement behind the line of scrimmage.
Like Dowdle, Tavien Feaster saw a high percentage of his carries amount to very little. But while Dowdle was an average rusher in term of tenacity, the former Clemson Tiger discernibly ran with a purpose. His hard-nosed running style meshed well with the Gamecocks' desire to play power football. His production leaped him over Mons Denson -- SCar's previous preferred power back -- in the pecking order. It didn't take too long with him around the program before his ate into the team's carry share. Though over 11% of his carries suffered from defensive contact behind the line, Feaster finished 2019 with a top15 Negative Run Rate within the conference. Like his roughriding style would suggest, Feaster was a hard man to bring down. Though his Broken Tackle Rate noticeably waned as South Carolina got deeper and deeper into their schedule, he was clearly one of the SEC's most physical runners. He averaged a broken tackle on about one out of every three carries by year's end and commanded a 3.69 yards after contact clip, which was good for eighth best in the conference.
Despite his determination, Feaster was mostly contained. His average yards before contact was the third lowest in the conference. However, some early contact was initiated by Feaster. Either way like Dowdle, over 45% of his carries gained between zero and three yards. With such a high percentage of his carries resulting in futility, his overall analytics were a bit dinged up. His Success Rate, First Down+Touchdown Rate, and Explosive Run Rate all were decidedly below average. Still, his numbers were all better than Dowdle's. Since he provided slightly more consistency and effectiveness versus crowded boxes, he finished the year as South Carolina's lead back.
Mons Denson became the forgotten man. To reiterate, Denson had primarily been this offense's power back before Feaster's arrival. Since Feaster was perceived as an upgrade in that department by their coaching staff, a passing of the torch was made. Denson finished the year with only 39 rushes despite totaling over 80 a year prior. Since he failed to qualify per minimum touch requirements, I'll only glance over what he brought to the table this past fall. Like you would expect from a man whose first name translates to "mountain", Denson didn't ease up his running style. He remained a bull looking to bash and bruise defenders. Thanks to a 4 yards after contact average, his yards/carry topped both of SCar's main backs. Contrary to intuition, he only broke tackle on about a fifth of his carries, which was lower than both Dowdle and Feaster. He also was one of their less explosive options as his 10.3% Explosive Run Rate was the worst on the team with at least 10 carries. But Denson was a force that always strove to move forward. He might not have shedded tacklers at a great clip but he still moved the pile. Thanks to this running style, none of his 39 carries went for a loss.
With all three of those backs set to depart, Kevin Harris and Deshaun Fenwick will get their chances to fuel this rushing attack. Granted while most of their damage occurred versus South Carolina's lesser opponents, some new faces could rejuvenate this rutted run game.