Sideline to Sideline: Mississippi State 2019
Mississippi State at a Glance
Joe Moorhead never came off as a good fit in Starkville. Though he was a creative offensive mind and did a pretty good job of putting his players in positions to succeed, something was always off. Sure, this was the coach’s first job south of the District of Columbia. So some assumed there would be a bit of a culture shock operating from The Golden Triangle of Mississippi. His perceptions as a carpetbagger prevented him from latching on with a fan base hungry to stay relevant after the Mullen Era. His dramatic exit cemented that notion.
His first year was a good, not great campaign. Despite having the best defense in the country per the S&P, Nick Fitzgerald’s skill set greatly shoehorned how the Bulldogs would play offensively. At least the Bulldogs kicked ass running the rock in 2018. No SEC offense boasted a highest Success Rate. Yet, the passing game just couldn’t get off the ground. Though their Rushing Success Rate was tops, their Passing Success Rate was near the conference floor.
Year two was supposed to be somewhat of a transition year. With more of “his” guys within MSU’s ranks, two new passers, and a good amount of defensive turnover, getting to eight wins would be more difficult, but it wasn’t out of the question.
No matter how you slice it, inconsistent quarterback play doomed Mississippi State this season. While Fitzgerald had his faults, the guy was built like a 6’6 fullback and was capable of shouldering the load for their offense. Incoming grad transfer Tommy Stevens was far less reliable. Though his numbers were very solid to start the season, Stevens noticeably worsened after he was injured in the 2Q of the Southern Miss game. His next three starts would fail to see him play more than two quarters. Due to his poor passing and decision making, Moorhead yanked him in favor of freshman Garrett Schrute -- I mean -- Shrader.
Shrader showed flashes but mostly in the run game. While the offense was balanced under Stevens, the Bulldogs leaned more into the run game with Shrader on the field. Overall on the season, MSU had the SEC’s fourth lowest Pass Rate at 47.1% and the sixth best Success Rate at 44.2%. In the games where Shrader started, those clips dipped to 46.8% and 42.8%, respectively.
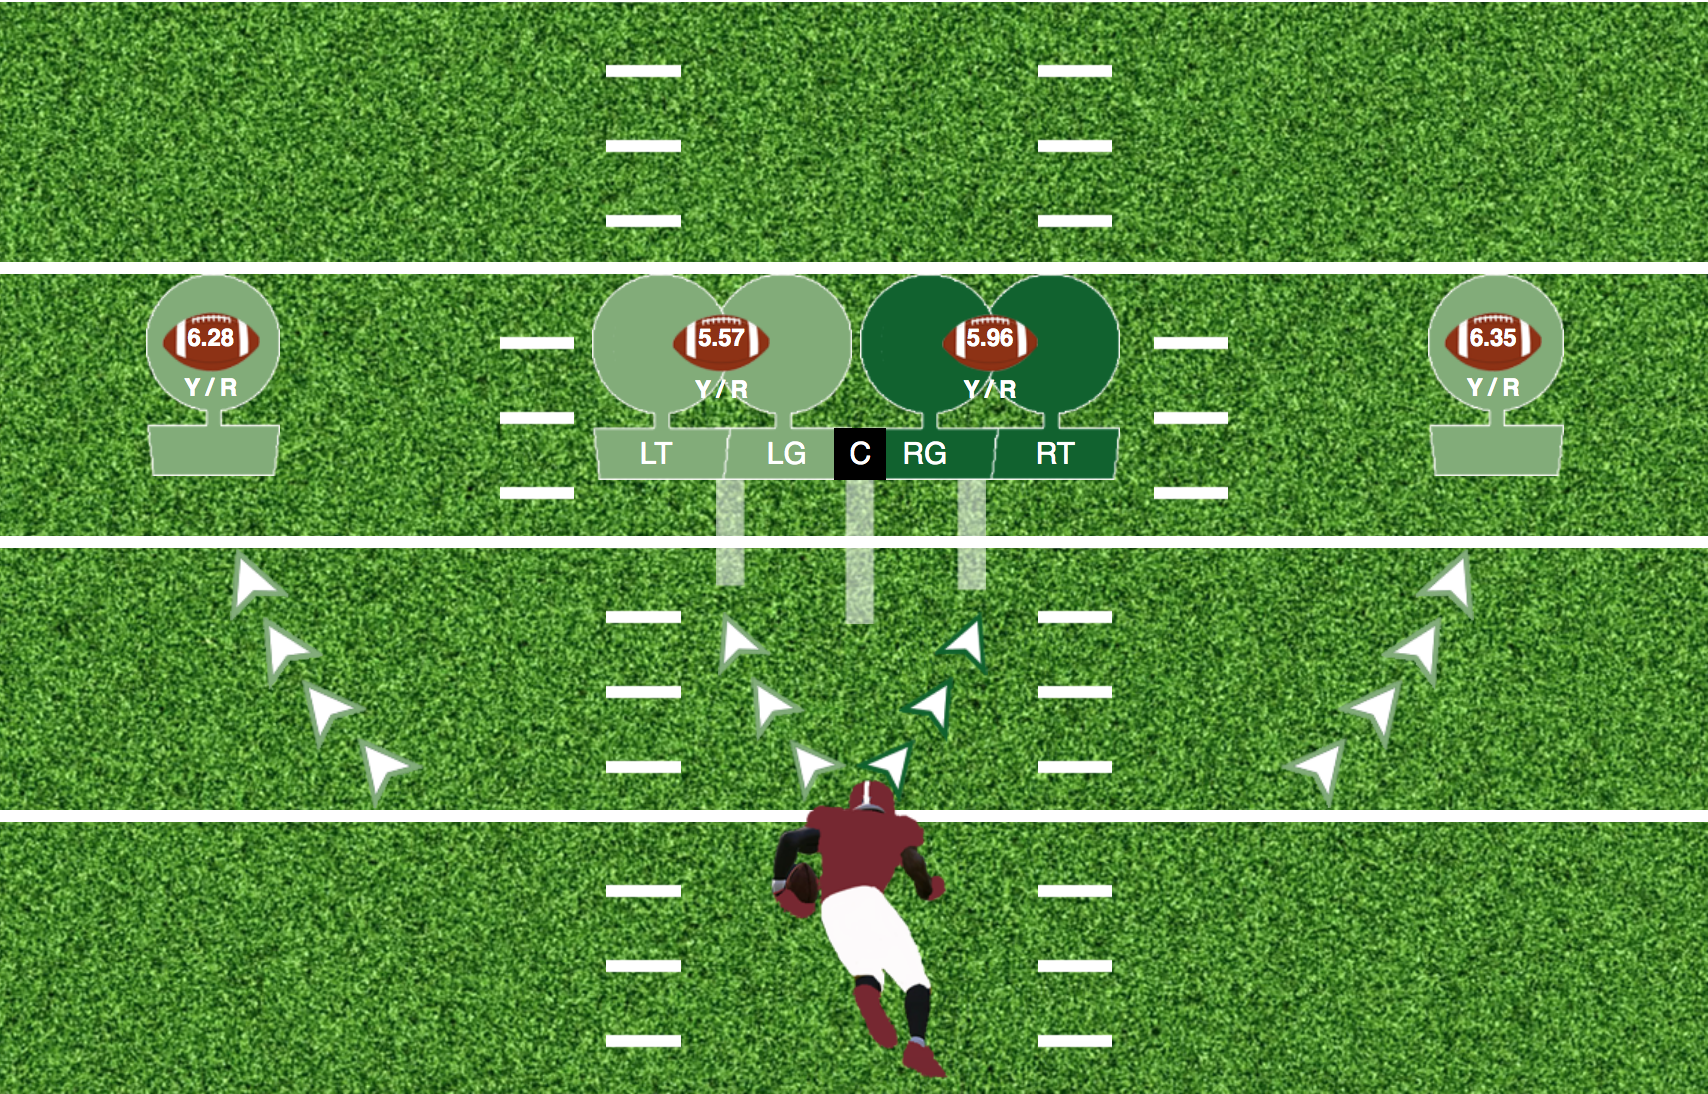
Taking a step back and examining their production, Mississippi State did numerous things very well offensively in 2019. They just couldn’t put it all together as the year progressed. Like recent Bulldog offenses, most of their strengths were reflected by their run game. Their yards/carry placed second within the conference and their 47.4% Rushing Success was good for fifth best. No SEC offense was more explosive on the ground than MSU. About 23.4% of their runs gained ten yards or more.
Much of those big gainers were direct results of fantastically forged run lanes. Despite over a third of their rush attempts suffering from a form of Havoc, the Bulldogs averaged exactly 3 yards before contact, which was the second best clip within the conference. But when Havoc plays intervened, MSU’s backs collectively were blah after contact.
With them being one of the most run-heavy offenses in the SEC, Moorhead wasn’t shy of incorporating Run-Pass options into his attack. Roughly 27% of the Bulldogs snaps included a RPO design. MSU was one of the few teams in the conference where RPOs aided both facets significantly. On RPO rush attempts, the Bulldogs averaged 6.62 yards/carry on a 48.9% Success Rate compared to 5.51 and 45.5% on non-RPO runs. Through the air, RPO and normal passes averaged roughly the same yards/attempt. But the Bulldogs’ Passing Success Rate on RPO throws was 53.7% compared to a cringeworthy 38.7% clip on normal attempts. MSU’s overall Success Rate on RPOs was 51.1%, which made them one of four conference teams to break the 50% plateau.
Rewinding a bit, MSU’s passing woes were a result of failing to execute dropback passes efficiently. Both Stevens' and Shraders’ Passing Success Rates were below the conference average in these spots. I mean, just look at that vast differential in terms of success from dropback and RPO attempts. Their line didn’t really do the best job to help out in that regard. Their overall Pass Havoc was okay, but the Bulldogs suffered from the SEC’s third worst Pressure Rate (35.1%) and Sack Rate (3.45%). For two guys in a new system, its easy to see why neither found solid footing. In fact, 8.8% of their plays constituted as “broken”, which was the fourth highest clip in the conference.
Overall, their passing game was just okay, which was a major improvement from being -- and I’m using a technical term -- trash. In 2018, their 36.6% Passing Success Rate only bested Arkansas within the conference. This year, their 44.2% clip earned the SEC’s six spot despite them averaging the fifth lowest yards/pass. While there were moments where everything clicked through the air, MSU sustained little success across their schedule.
The Bulldogs owned the conference median in points/game and yards/game, but MSU ended 2019 with the SEC’s fifth best Touchdown Rate at 5.35%. Though they were one of the best teams scoring a touchdown on any given snap, they also were one of the most likely to suffer a turnover. MSU’s Turnover Rate of 2.26% was the SEC’s fourth highest. No matter how many points you score, turning the ball over frequently is a good way to set yourself up for a loss. The Kentucky game was the only instance this season where the Bulldogs lost the turnover battle and won. They had four games with three turnovers; hard to blame the playcalling if you ask me in those respects.
While I personally think his schematics were sound, you certainly can criticize Moorhead’s methods with his tactics. MSU basically followed the old school mentality of using the run to set up the pass, which meant they dedicated a good deal of their first down play calls to establishing its ground game. I mean with the conference’s fourth lowest Pass Rate, I’m sure you too could have come to that conclusion.
If you are going to operate that way, you simply have to execute runs better on early downs than what the Bulldogs did in 2019. Like their overall Rushing Success Rate, no SEC offense could top their clip on 1st Downs last season. That efficiently spoke for itself. This season, however, their Rushing Success Rate dropped about 13 percentage points in these spots. Their 39.1% clip was the sixth worst clip within the SEC. This lack of production commonly placed the Bulldogs behind the chains.
High RPO usage on early downs helped inflate their passing numbers, but their Passing Success Rate shrunk on each subsequent down. On firsts, they were one of six SEC offenses with a clip above 50%. But only Vanderbilt, Arkansas, South Carolina, and Kentucky were worse through the air on 3rd Downs within the SEC. On 3rd Down passes, no offense within the conference averaged more than their 9.31 yards to gain. For a freshman and banged-up veteren with limited passing outlets, converting was often a hard ask. About 26% of MSU’s drives ended in a Three-and-Out -- good for the fourth highest clip in the SEC.
Obviously the Bulldogs could have executed better running the ball on firsts. But that still didn't affect their high Early Down Conversion Rate. MSU boasted the SEC’s second best 2nd Down Success Rate with a 49.1% clip. Over 20% of their 2nd Down plays were a run of ten or more yards or a pass of twenty plus. Alabama was the only SEC offense with a higher percentage of plays that gained 15+ in these instances. The best 3rd Down offenses are often the offenses that avoid 3rd Downs the most. Only LSU bested MSU’s 76.3% Early Down Conversion Rate within the conference.
Moorhead smartly utilized play action to help disorientate defenders and open up his restricted pass game. Stevens’ used the second most play action in the conference among passers with at least 74 attempts and Shrader’s clip ranked sixth. Though the fifth-year was one of the most successful passers off of play fakes, Shrader only saw minimal improvement in his Success Rate.
When the Bulldogs entered the Red Zone, they were one of the best offenses in the SEC down-to-down. While their Red Zone Offense finished 51st nationally, both their Success Rates cracked the SEC’s top4 as did their yards/play. But only 30.1% of their drives resulted in a trip to this area of the field, which was right below the SEC average.
Mississippi State was one of the few teams with a better Success Rate on the road than when at home. Thanks to hosting the likes of Alabama and LSU, the Bulldogs had the fifth worst Success Rate at home within the SEC.
While there was obviously some reshuffling schematically, MSU’s offense remained consistent as far as ESPN’s SP+ metric is concerned. In 2018, they finished 32nd while ranking 36th this year. The defense plagued by departing talent and a turnover-prone offense, saw a drastic decrease in efficiency. Though they commanded the best defense in 2018, the SP+ had them as the 70th best unit in college football this season.
Versus conference opponents, the Bulldogs defense was far from stellar. MSU was essentially bottom5 across the board. In case you were curious on what areas that entailed, MSU ranked 11th in Defensive Success Rate (44.8%), 12th in yards/play allowed (6.76), 13th in Explosive Play Rate (15.9%), 12th in Touchdown Rate (6.45%), 11th in yards/game (419.3) and 11th in rush yards before contact (2.4) versus SEC foes. The only analytic where they weren’t bad or middling was their Takeaway Rate, which was the SEC’s third best. MSU’s 3.02% clip was one of the rare areas where they had a positive margin (remember their TO Rate was 2.26%).
Their defense was particularly bad against the pass. Nationally, Mississippi State’s Passing Efficiency Rating ranked 105th out of 130 teams. Within the SEC against conference opponents, only Arkansas sported a worse Defensive Pass Success Rate. No one allowed more than their 8.3 yards/attempt or 15.6% Explosive Pass Rate. Their Pass Havoc, Pressure Rate, and Sack Rate were all three decidedly below the conference average.
Inner turmoil, exterior pressure, and on-the-field backsteps brought Moorhead's tenure to a close in Starkville. Again for whatever reason, something was just off and his deal never quite fully meshed. After all, you don’t see many head coaches dismissed from their positions with winning records after 26 games. Whether it was the rumors tying him to Rutgers, failure to adjust his play calling, or unable to rally the fan base, MSU’s brass simply abandoned their support. Despite being a good offensive mind, he bore the weight of his unit’s mistakes and shortcomings. Now, one of the conference’s most run-heavy offenses in recent years will turn to the squadron commander of the Air Raid Offense to help reascend this program upward.
Mississippi State’s favorite run looks

1. Inside Zone Slam Read 16.3% Play Share 6.34 Y/A 46.7% Success Rate
Mississippi State had 19 looks that composed at least a 2% play share for them in Joe Moorhead’s second season in Starkville. None were as featured as the Inside Zone Slam Read. This look hinges many modern offenses’ rushing attacks regardless of that team’s overall style of play. Though Moorhead wanted to take to the skies more, his hands were largely tied as he attempted to play towards his roster’s strengths. With mobile, yet flawed passers and a jukebox of a back, this straightforward read play was their default go-to. Only six SEC teams repped this look more than the Bulldogs this season. Across all downs, Slam Reads led the way in number of reps.
Despite the shortcomings, Mississippi State had one of the better rushing offenses in the SEC in terms of both yardage and Success Rate. Though their production off Slam Reads was close to the team’s overall figures, both its 6.34 yards/attempt and 46.7% Success were below average by MSU’s standards. Part of this concept’s lackluster numbers are a direct result of its failure to win on 1st Downs. Garnering three times the reps as the next closest concept, Slam Reads on firsts -- like their rushing numbers in general -- averaged under 4.9 yards/carry on a Success Rate less than 40%. Luckily for the Bulldogs, they were much better executing Slam Reads on 2nd and 3rd Downs.

2. Inverted Power Veer 6.42% Play Share 6.26 Y/A 42.6% Success Rate
While a basic zone variety led their script, Mississippi State very smartly sprinkled in numerous read plays to find different pressure points against defensive fronts. Hang tight and you’ll see every one of their five most called run concepts were reads. The Inverted Power Veer was the Bulldogs favorite gap play. Most read options call for the running back and quarterback to hit opposite sides of the center, but not this look. Both attack the same side, which greatly tests a defense’s gap integrity and discipline. The numbers advantages increases for the offense with the addition of a backside guard puller. Another wrinkle Power Veers utilize calls for the backfield to swap their orientations that you’d normally see on a typical read. Meaning, the back works the edge and the QB is the dive player.
Though it played into their personnel’s strengths and birthed a handful of nice gains, the Power Veer was the Bulldogs’ least successful run play among their five most favorite ground concepts. Aiming to get five untouched yards on the perimeter for the back or a north and south carry for the quarterback, this was one Mississippi State’s favorite early down plays to establish a decent down and distance. Of the concept’s 54 reps, 44 occurred on either 1st or 2nd Down. Yet, most of the success this look saw occured on later downs. Both of Power Veers’ yards/attempt and Success Rate increased on subsequent downs. Sporting a paltry 4.52 average and 33.3% Success Rate on firsts, production ticked up to 6.76 / 47.1% on seconds and 12.3 / 62.5% on thirds, respectively. Only Inside Zone Slam Reads amassed more yardage than Power Veers’ 338 this season for the Bulldogs.

3. Inside Zone Bluff Read 4.40% Play Share 4.49 Y/A 51.4% Success Rate
Moorhead was a clever schemer with his play designs. A number of Mississippi State’s Inside Zone Slam Reads incorporated an RPO with the playside tight end firing across the formation on a slide route away from the zone flow. While a smart use of spacing and personnel, this plays like a split zone -- or “bluff” action -- wrinkle. But on those, that player engages the backside end man on the line of scrimmage setting a hard edge opposite the playside zone. In the read game often full of bang-bang reps, using their tight ends in this fashion were one of the Bulldogs’ favorite ways to pick on indecisive or slow-footed backers.
Thanks to the head game aspect, Inside Zone Bluff Reads were one of the few run concepts to break the 50% Success Rate barrier for Mississippi State despite having the team’s lowest yards/attempt of its five favorite run looks. Their production across the three downs was generally an inversion of what their brother concept Slam Reads did in terms of success. So Bluff Reads were at great to start a set of downs, horrendous on seconds, and superb on the money down. Though the looks’ Success Rate was 80% on 3rd Downs, the Bulldogs only managed to average 1.27 yards/attempt on seconds and thirds. Despite their inability to snatch chunk gains, Bluff Reads accumulated 166 yards, which was the fifth most yards of any look for MSU’s offense.

4. Power Read 3.92% Play Share 7.09 Y/A 66.7% Success Rate
Along with its run-of-the-mill zone reads, Mississippi State was also keen on using the power variety. Like these zone counterparts, the QB will either give or keep the ball based on how a key defender reacts towards the backfield mesh. The obvious difference is the use of a backside guard puller and playside blocking that aims to set a hard edge. While Inside Zone Reads were largely hit or miss often favoring the latter, Power Reads were the Bulldogs’ best play. I mean, two-thirds of these plays resulted in success. Of MSU’s five favorite run and pass plays, only a pair of passes designs averaged more yards/attempt.
Power Reads were Mississippi State’s fourth most called play to start a set of downs. Of the looks 33 reps, 20 occurred on 1st Down. While any team would take the Bulldogs’ production off this play in these spots, their 55% Success Rate on 5.55 yards/carry was largely dwarfed by their numbers on later downs. Power Reads on second and thirds boasted an eye-popping 84.6% Success Rate on a 9.46 yards/attempt. Only Inside Zone Slam Reads and Power Veers out-gained its 234 yards.

5. Bully Read 3.69% Play Share 6.74 Y/A 51.6% Success Rate
Before this season, I had never seen this particular design. The Bully Read -- named after Mississippi State’s mascot -- was another gap read design the Bulldogs went to every so often. This look operates like ordinary Power Reads but takes on a wrinkle akin to veer options. Instead of the quarterback and running back hitting opposite sides of the center, both head the same way. Essentially, Bully Reads are Inverted Power Veers without the “inversion” of paths. Meaning, the back is still the inside “dive” player and the quarterback hits the edge.
The Bully Read was about an average look overall for the Bulldogs. But with numerous other read plays littering their script, it was all a part of Mississippi State’s goal of disorienting backers and potentially beating defenders to a spot. Like Power Reads, Bully Reads saw the majority of their reps on 1st Downs where they too put up their worst numbers. There, this look produced a subpar 42.1% Success Rate and a blah 4.16 yards/attempt. But on later downs, the Bulldogs mauled fronts executing this play. On 2nd and 3rd Downs, MSU’s Success Rate on Bully Reads shot up to 66.7% while averaging 10.8 yards per pop.
Mississippi State’s favorite pass looks

1. Outlet Screens 4.16% Play Share 5.03 Y/A 45.7% Success Rate
With every single one of their five most called run concepts being read plays, it shouldn’t come as a major shock that RPO outlet screens combined to total the highest play share of Mississippi State’s pass concepts. After all, the Bulldogs dialed up RPOs at the SEC’s fifth highest Rate at 26.8%. Aiming to allow the Bulldogs to spread out and win in space one way or another, targeting outlet screens largely failed to help them play efficiently. While “spacing” outlets like an isolated slide or hitch route boasted a 56% Success Rate, “screen” outlets like Bubbles, Tunnels, and Swings largely disappointed to the tune of a 37.9% clip.
With the playbook wide open to start a set of downs, Outlets only succeeded a third of the time. Considering three of the five most called runs on firsts had Success Rates under 40%, this failure to consistently win with numbers mostly put the Bulldogs behind the chains. Tommy Stevens was more likely to lean on these than his freshman counterpart. Stevens’ RPO Throw Rate of 17.4% was the fifth highest in the SEC while Garrett Shrader was one of six conference passers with at least 70 attempts with a clip in the single digits.

2. Sail Variations 2.73% Play Share 7.65 Y/A 47.8% Success Rate
Sails are strongside varieties of floods. Floods are named due to the fact they call all receivers to flow towards one side of the defensive coverage so that they can outnumber a zone. Sails consist of a deep vertical, deep out/corner, and underneath route towards the flat. Mississippi more times than not dialed up two-man Sail patterns consisting of the two deep routes. The tertiary route was often added from a backside complimentary concept from Shallows or Drives -- both of which ended up being among their five favorite passes.
Sails were responsible for 176 yards on the season, which was the fourth most of any look for the Bulldogs. It was one of the few pass concepts with equal targets across the three downs. But, its reps increased each subsequent down. The look’s eight tries on 3rd Down were tied for the fourth most of any concept. But despite averaging 9.46 yards/target on a 61.5% Success Rate on early downs, Sails put up an unsatisfactory 37.5% clip on the do-or-die down.

3. Shallow 2.73% Play Share 6.35 Y/A 34.8% Success Rate
The Shallow concept is more than just a drag route racing from one side of the formation towards the other. But, that is one of the look’s signifying characteristics. The other is an overtop dig going the opposite way. Since any receiver can be the concept’s pointman, the concept can take many different forms and is malleable based on offensive style or personnel. Like its brother concept Drive, Shallow was paired with a number of concepts including Smashes, Comebacks, Sails, Double Digs, Verts, and Ohio/Slice. Functionally, many of these designs became Flood Variations.
Looking at snaps where the Shallow concept was targeted, the concept failed to deliver more times than not. MSU was the second most pass-heavy team in the SEC on 3rd Down, and Shallow was their most repped pass play in those spots. And that’s where the majority of its targets occurred. Of Shallow’s 23 chances on the season, 16 were on the money down. Only four of those tries ended in success. This obviously hindered the concept’s overall Success Rate. Shallow’s 34.8% clip was the lowest among their five favorite pass and run plays. Plus, it was the only one of these five looks to exhibit a Success Rate below the team’s overall Passing Success Rate of 40.7%.

4. Drive 2.14% Play Share 5.83 Y/A 50.0% Success Rate
The Drive concept and the Shallow concept both call for the same core routes. But while the drag and dig head opposite ways on Shallows, they share the same orientation on Drives. This characteristic makes Drives perfect backside routes to pair with frontside Sails, Smashes, or Switch Variations to encompass a weak flood pattern. Though they averaged less yards/target than Shallows, Drives were the only pass patterns among Mississippi State’s favorites to own a 50% Success Rate.
Mississippi State was the only SEC offense to run more than 35 combined Drives and Shallows this season. Like Shallows, this concept was highly inefficient with its chances on 3rd Downs. Only one of the six Drives resulted in success in those spots. But Drives were one of the Bulldogs best on firsts or seconds. A robust 75% of targeted Drives resulted in success on early downs. On Drives and Shallows, no SEC player saw more than Stephen Guidry’s nine targets. For good measure, slot receiver Dedrick Thomas chipped in another five, which was good for third most in the conference.

5. Cross 1.90% Play Share 7.56 Y/A 43.8% Success Rate
Thanks to the pairing of complementary concepts, a good amount of Mississippi State’s passing offense were floods. With the majority of them coming out of balanced formations, most of these would be characterized as weak side floods, macroschemetically speaking. The traditional Cross concept is also exactly that. Interestingly enough, both of Mississippi State’s two favorite Flood Variations boasted the two best yards/target averages among the Bulldogs’ favorite pass concepts.
Mississippi State seemed content riding their frankenstein flood designs (Sails paired with a horizontally breaking complimentary concept) rather than dialing up Crosses. They targeted only one Cross concept per game on average. When MSU did, it was mostly on early downs. Of the concept’s 16 targets, 13 occured on either 1st or 2nd Down. And that makes sense. On early downs, Crosses posted up a 53.8% Success Rate on a 9.31 yards/attempt. But thanks to going o-fer on thirds, Crosses ended up as a rather pedestrian look.
Mississippi State’s most successful looks
(min 1.3% Play Share, click on concept title to for video link)
1. Power Read 3.92% Play Share 7.09 Y/A 66.7% Success Rate
In Mississippi State’s read-heavy scheme no look was more successful than Power Reads. When two-thirds of something’s chances gain the necessary yards to gain pertinent to the situation, it’s safe to say it was executed quite well. Of the Bulldogs five most successful plays, the Power Read was the only one among their five favorite run or pass concepts. Operating like a read option but switching out a coordinated zone flow in favor of downblocks and a backside guard puller, Power Reads made fronts pay if they were misaligned or outnumbered towards the play’s orientation.
While Power Reads are less straightforward and hence more prone to variability, there is no question these should have been featured more. Power Reads weren’t even the Bulldogs favorite gap play. That honor went to Inverted Power Veers. If the idea was to try and give Power and Bully Reads equal weight in the playsheet, then mission accomplished. Both had comparable play shares and both broke the 50% Success Rate plateau, insinuating defenses were unable to correct diagnose these wrinkles more often than not.
2. Play Action Waggle 1.43% Play Share 7.17 Y/A 58.3% Success Rate
If you are going to be a run-first offense, you probably should have some nice play action plays in your back pocket to make overaggressive defenders pay. Waggles are direct counter towards fronts expecting a split zone or “Bluff” action. In an effort to not repeat myself, read the blurb above on what differentiates this look from a typical zone. With the offset tight end or fullback running a slide route rather than engaging with the end man on the line, defenses can be caught with their pants down in the flat for a few beats. If the hot route slide is covered up, the rest of the receivers all break within the QB’s line of sight and can be found overtop.
Play Action Boots and Waggles are weak side floods. If you remember from above, a good amount of their passing concepts fell into that mold. The most basic backside combos on these are an inside cross with outside dig or post. On the playside, it's very typical to see a comeback. Already a fan of Sails, Mississippi State occasionally used the slide route to fit a playside strongside flood.
3. Tackle Counter Read 1.55% Play Share 7.46 Y/A 53.9% Success Rate
Counter Variations occasionally popped up in the Bulldogs’ script this season. Most used read aspects. While some QB Counters with spacing outlets were utilized like their draw RPOs, the vast majority of MSU’s Tackle Counter Reads were of the Tonka Variety. Tonka is a shorthand term we used to label Tackle Counters with only the backside tackle pulling. Most teams ask both pull both the backside guard and tackle -- as opposed to a TE or FB -- on Tackle Counter designs. But the Bulldogs very much favorited a single puller. Everything else about the play unfolds like a traditional Power Read.
Tackle Counter Reads only received 13 reps on the season; so about one per contest on average. Eight of the concepts reps occured on 1st Downs where the look also sported its best figures. On firsts, Tackle Counter Reads averaged exactly 10 yards/attempt on a 62.5% Success Rate.
4. Inside Zone Slash Read 1.55% Play Share 5.46 Y/A 53.9% Success Rate
Like the Bully Read, the Inside Zone Slash Read presented a wrinkle I hadn’t previously seen when entering this season. Instead of sending the potential ball carriers on opposite sides of the center like on normal read options, both attack the same side as they would on a Veer. The back will align on the same side as the run orientation. Meaning if its a rightward carry, he’ll be on the QB’s right, which is also very different than typical zone designs. The wrinkle allowed the Bulldogs’ run game to steal a step or two against slightly confused backers. Trust me, the first time I saw a Slash Read on film it took a few replays before I could diagnose what all was going on.
This was a very seldom-run look for MSU. On average, only about one per game would pop up. While it was one of their best looks in terms of success, Slash Reads didn’t produce many big gainers. It’s 5.46 yards/attempt was the lowest of MSU’s five most successful plays with only Inside Zone Bluff Reads and Outlet Screens being worse in that regard among their five most called runs or passes. Eight of its 13 reps occured on 1st Down. But that’s where the look had its worst production. There, Slash Reads had a Success Rate of 37.5% on 4.88 yards/attempt. Four of its five later down reps resulted in success, which obviously had a tremendous effect on this look being among the Bulldogs most successful on the season.
5. QB Draw 1.78% Play Share 7.40 Y/A 53.3% Success Rate
Though they ran less QB-centric run plays with Nick Fitzgerlad out of Starkville, the Bulldogs still incorporated them into their script. Outside of their read game staples, the QB Draw was MSU’s favorite way to do so. Sure, they also used similar designs on QB Counters. But, Draws were featured more. Of their five most successful looks, QB Draws only trailed Power Reads in play share and only Tackle Counter Reads averaged more per attempt. Most if not all of their QB Draw designs called for passing outlets on the perimeter; this in turn made them RPOs.
Running back flair motions that morphed into swings, slot hitches, and Sticks were their favorite route tags to pair with QB Draws. Since RPOs are overly a numbers game, MSU’s passers simply had to count and see where they outmanned the defense. If they had numbers inside, it was a QB Draw. If they didn’t respect the pass outlet in space, it was pitch and catch. Of the 15 QB Draws the Bulldogs repped this season, four occured on 1st Down with eight more coming on 2nd Down. On seconds, the look really thrived. In those spots, QB Draws had a 62.5% Success Rate and averaged 9.13 yards/attempt.
Where Mississippi State’s weapons ranked
The Bulldogs’ quarterback conundrum was quite the puzzle to solve. Injuries, chemistry issues, and situational woes frequently made their down-to-down production unpredictable. Though Tommy Stevens and Garrett Shrader both flashed occasionally, each had obvious faults.
Coming into the season, the bar was set pretty low for the Bulldog QB battle. The outgoing Nick Fitzgerald finished either last or second to last across the board within the conference in passing analytics. For instance, his Success Rate was a mere 38.2%, which was about 5 percentage points below the two newcomers in 2019. But to say this season wasn’t rocky for the Bulldogs’ signal callers would be a flat-out lie.
The original plan was to give Stevens the reigns. But an early injury lingered throughout much of the first half of the schedule, which clearly diminished his on-field performance. Shrader -- ready or not -- was thrown into the fire four times in their first six games to relieve Stevens’ poor passing (not to mention he outright started the game versus Kentucky). From Week 8 on, each started three of the remaining six regular season games. Due to the differences in production from the two, it prevented MSU from finding an offensive groove.
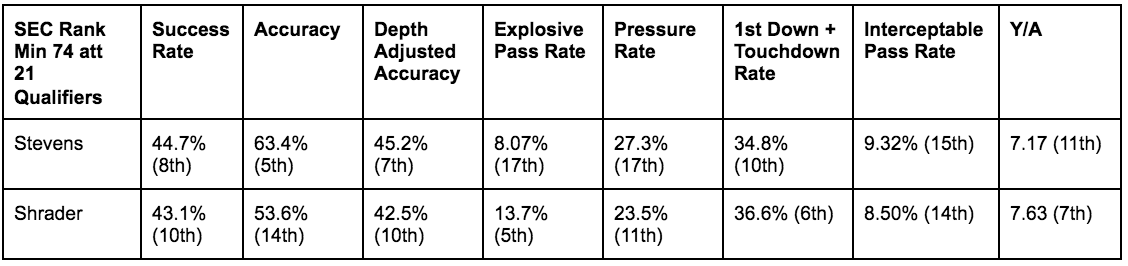
Stevens was brought in to command a run-heavy scheme while providing balance with both his above-average mobility and his experience playing under Moorhead’s tutelage. He was far more reserved down-to-down of the two passers, but that isn’t to say he didn’t try his chances every once in awhile. Pressing became his greatest flaw. Though his underneath accuracy was good and a number of completions were padded by his high RPO Throw Rate, Stevens had one of the highest Interceptable Pass Rates in the SEC with a 9.32% clip.
Shrader was no real upgrade on curbing risky throws. His 8.5% Interceptable Pass Rate was only slightly better and only one spot higher in the conference rankings. His average depth of target was second highest in the league. Unlike Stevens, he was one of the SEC’s least reliant passers off RPOs. With less easy completions and one of the highest degrees of difficulty in the conference, his overall passing numbers took a hit. Considering he was a freshman who wasn't thought of as a strong passer, it was a bold move to ask his arm to constantly bail his offense out of tough spots. But as we have mentioned, sometimes Moorhead really didn’t have any other choice. But since he often was more aggressive, he was low-key one of the better bang for buck passers within the SEC this season. His yards/attempt finished seventh, his First Down+Touchdown Rate placed sixth, and his Explosive Pass Rate -- or percentage of passes that net 20 or more yards -- cracked the conference’s top5.
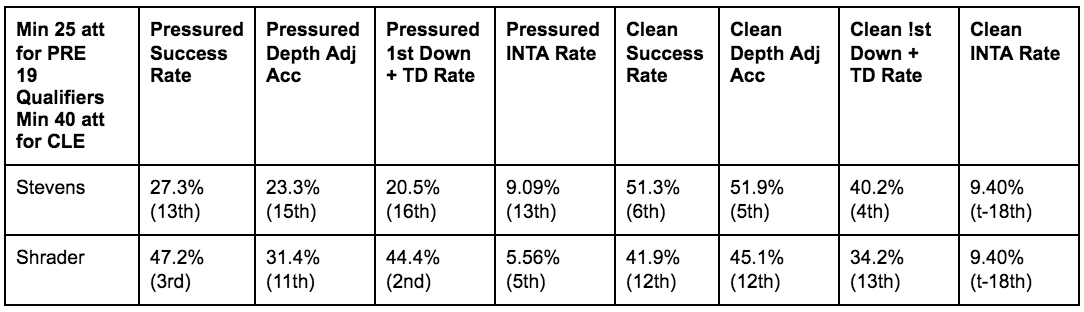
Ironically, the more-seasoned Stevens bucked the trend that veterans are calm under pressure. He was dreadful when frazzled. His lack of extended snaps certainly showed when he stared down the barrel. Both his downfield accuracy and First Down+Touchdown Rate under pressure fell into the bottom5 of SEC passers. But when he was kept clean, Stevens slung the pill with the best of them...outside of his Interceptable Pass Rate. Strangely, both he and Shrader had worse clips when kept clean than when under pressure. Play action was a big catalyst for creating clean avenues for Stevens. His 29.2% Play Action Rate was the second highest in the conference.
Shrader produced well beyond his years in versus pressure. Though he wasn’t anything special in terms of accuracy, his decision making was among the best in the conference. He was one of the few SEC passers to sport a better Success Rate when under pressure than when not. Not only did he limit his turnover worthy throws when under pressure, but he also consistently found his target for nice gains per his top3 Success Rate and First Down+Touchdown Rate. This potency didn’t carry over when he was kept clean, but his inaccuracy did.
Shrader’s inability to consistently produce from clean pockets is worrisome as far as Mike Leach’s incoming Air Raid Offense is concerned. Since clean attempts are more consistent, they are a better reflection of a passer’s ceiling. After all if you cannot hit your targets under “perfect conditions”, when can you? He can still chalk those shortcomings up to youth and inexperience. Still, Leach values accuracy above all else when evaluating a passer. While decision making can be shored up, you can only do so much to fix someone’s mechanics or precision.
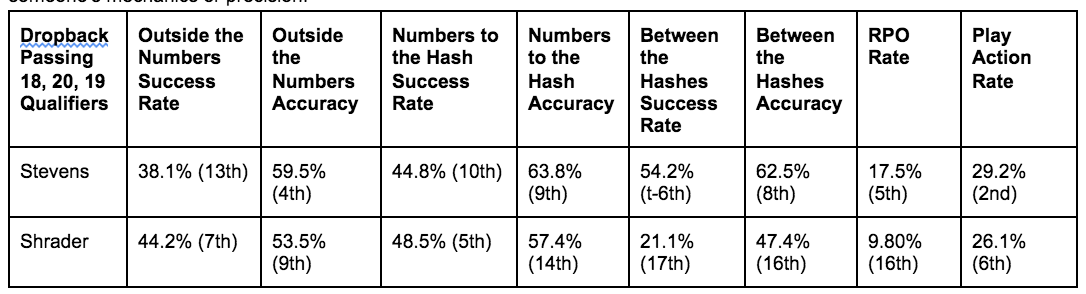
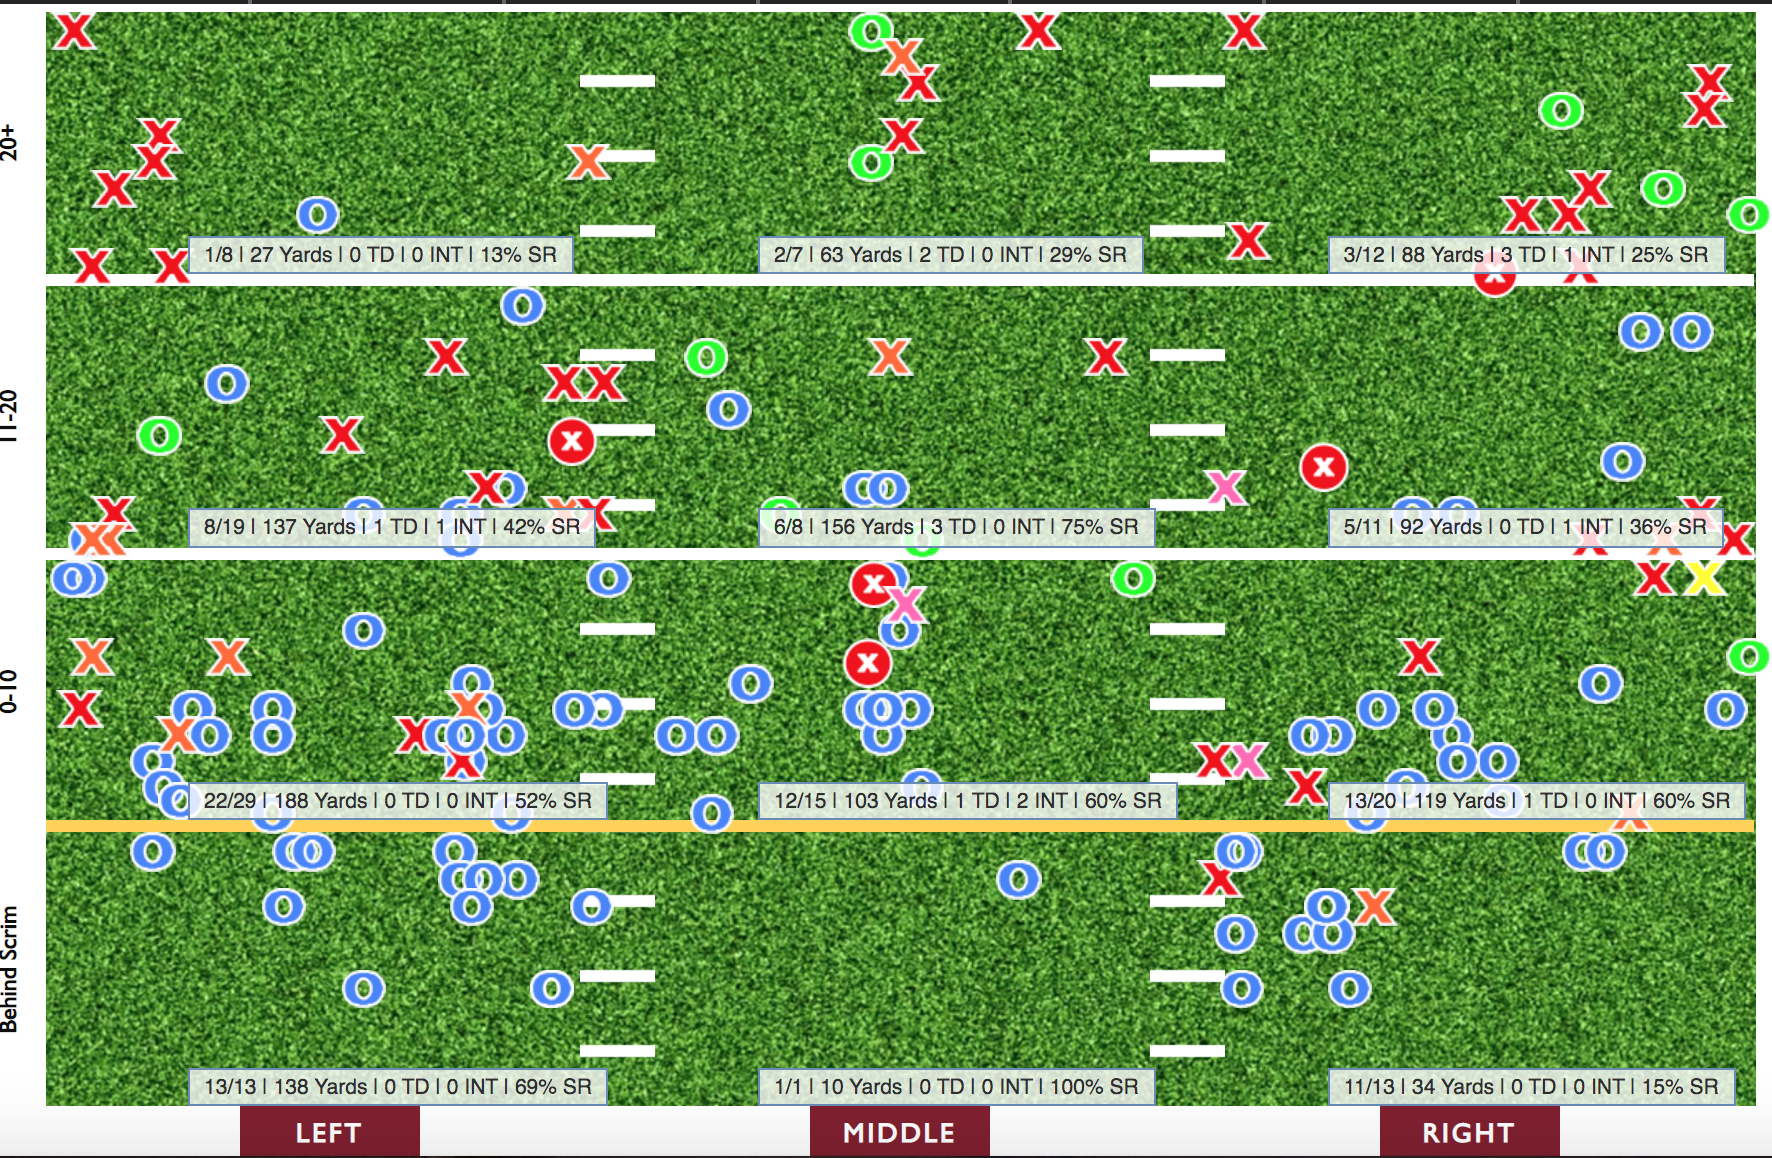
Though Shrader had a higher percentage of his throws come off dropback attempts -- ie non RPOs or screen passes -- Stevens proved to be the more accurate passer from sideline to sideline. On the perimeter where there are generally less defenders, Stevens’ Accuracy% was good for the SEC’s fourth best clip. Despite this, his Success Rate was in the back half of conference starters. He was his most accurate targeting players between the numbers to the hashes. But in terms of production, he was blah relative to the rest of the conference. Targeting the middle of the field yielded Stevens’ best Success Rate.
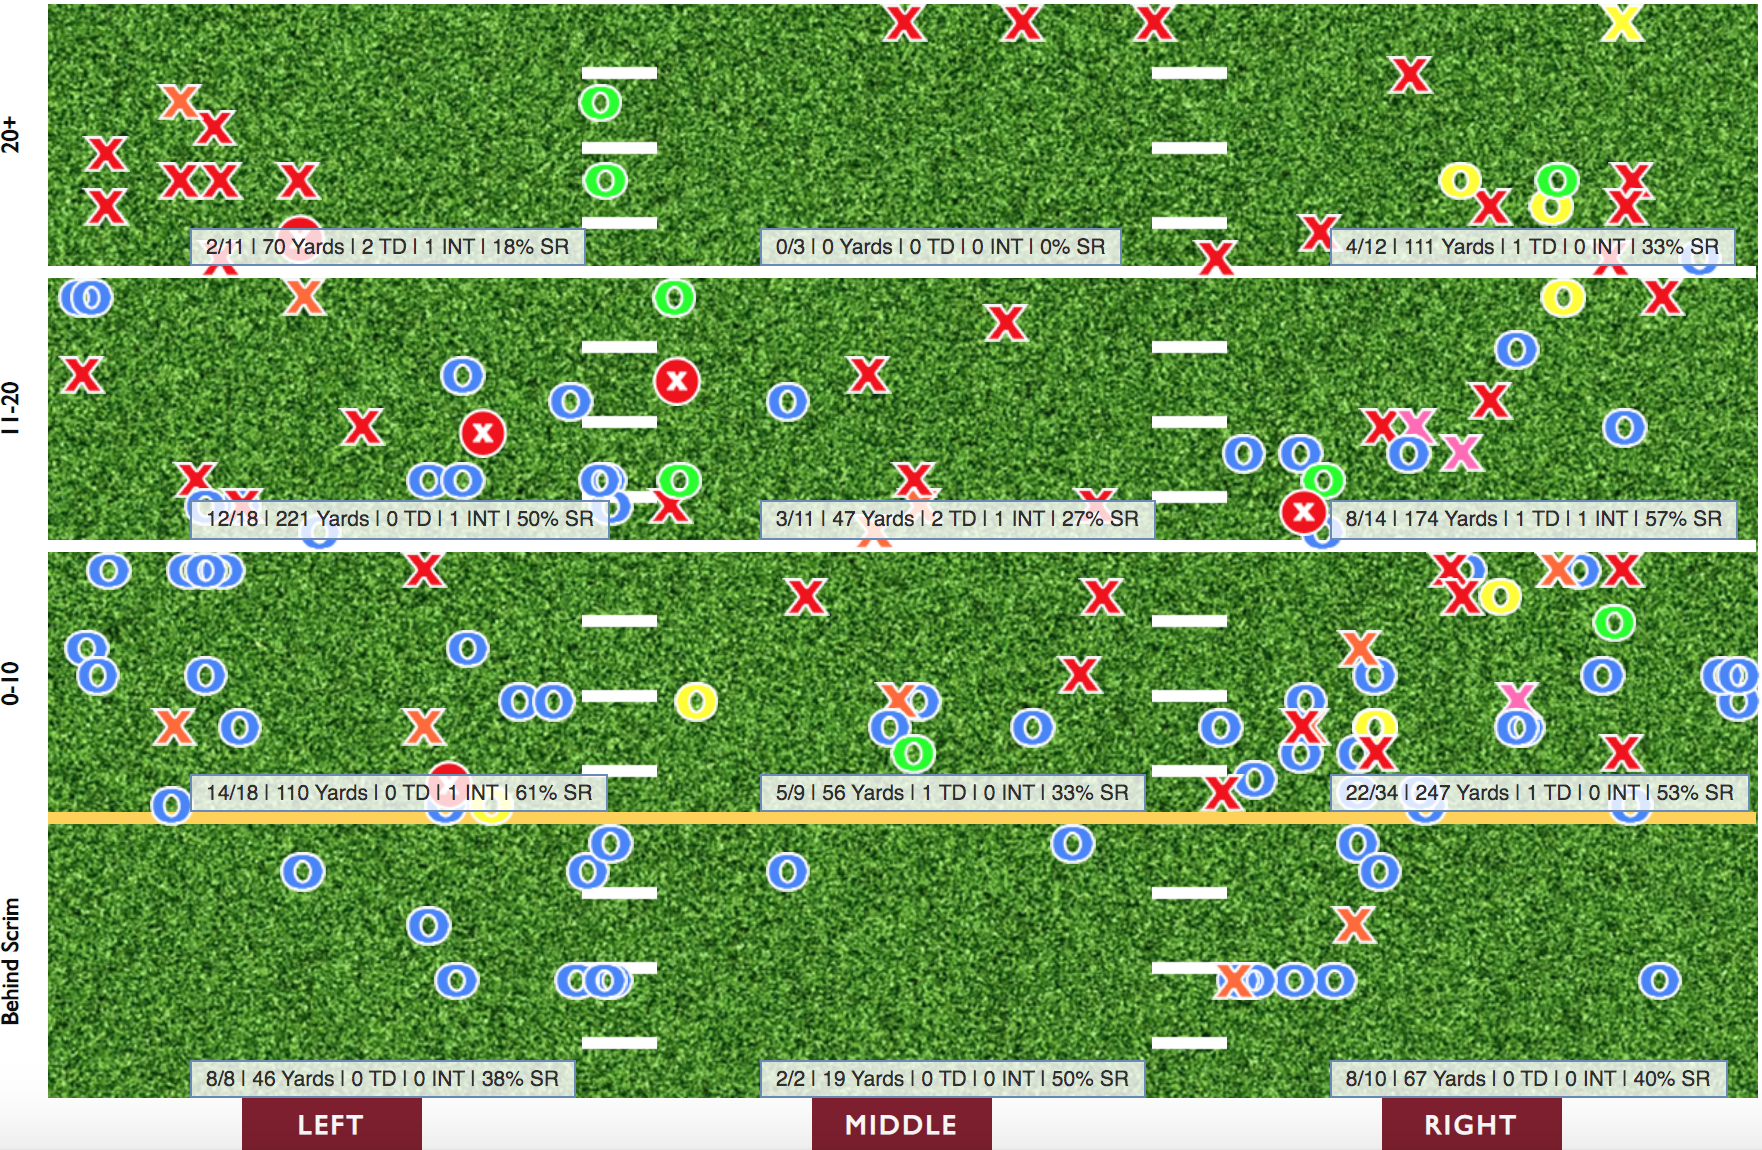
Outside the hashes, Shrader’s throws were more successful on average than old man Stevens despite being a clearly less accurate passer. His clip from the numbers to the hashes was good enough to finish fifth in the SEC. But when the youngster targeted the teeth of the defense, he was one of the worst around. Looking at his Pass Chart (below left), there are plenty of red x's between the hashes. Both his Success Rate and Accuracy% fell inside the bottom4. Less than half of his attempts in the middle of the field were deemed as accurate. Though the freshman stood tall in the face of pressure and was able to find men at a decent rate, it remains to be seen exactly what his role will be moving forward thanks to his subpar precision.
Mississippi State had an average group of receivers. By traditional volume stats, they certainly were well below that threshold. No receiver of theirs had more than 450 receiving yards to more than 30 catches. Because there really wasn’t a true alpha within their ranks, they decided to spread around the wealth. No other SEC passing offense saw its top3 options all within four targets of one another. Stephen Guidry, Osiris Mitchell, and Dedrick Thomas all had between 50 and 54 this past season. Though there was no go-to, each had defined roles within MSU’s scheme.
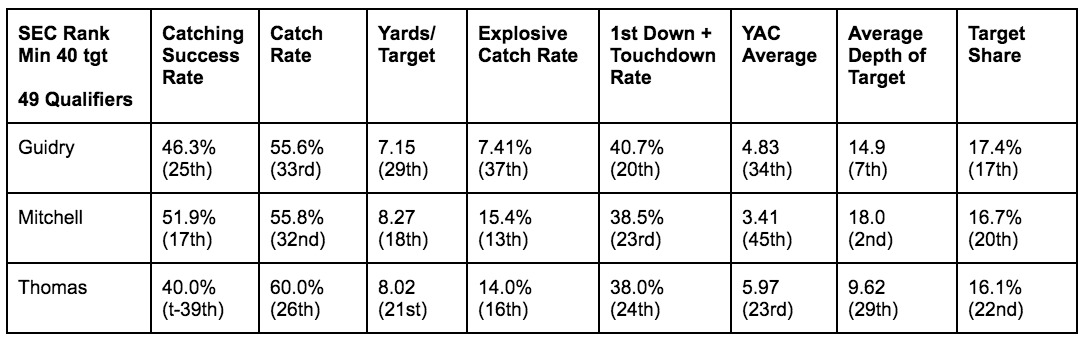
Guidry ended the year as the Bulldogs target leader with 54. MSU wanted his 6’4 frame to be a physical force outside the numbers and win 50/50 balls downfield. His average depth of target was the SEC’s seventh highest. But thanks to a high degree of difficulty on his chances and a disappointing drop problem, he was overly below average relative to the rest of the conference. His Success Rate, Catch Rate, and Yards/Target all fell below the SEC mean this season. His size did come in handy, however, from time to time. Of their three main targets, no one turned a catch into a first down or a touchdown at a higher clip than Guidry. He also fell into the upper-quarter of SEC receivers in Contested Catch Rate with a 41.7% clip.
Guidry was not an efficient deep threat for the Bulldogs. He only hauled in two of his 14 deep chances for a mere 55 yards. His Explosive Catch Rate was a stale 7.41% clip, which was almost half of what the other two main options produced. But his shortcoming in these spots wasn’t entirely on him. Sure he had more deep drops than catches, but eight of those 14 targets deep were deemed as uncatchable. That 57.1% clip was the fifth highest within the SEC this past season. Overall, he fell into the conference’s bottom third with a 22.2% Uncatchable Target Rate. Unfortunately for the Bulldogs, scattershot passing was kind of the norm. Roughly a fifth of their targets towards their three main options were not catchable.
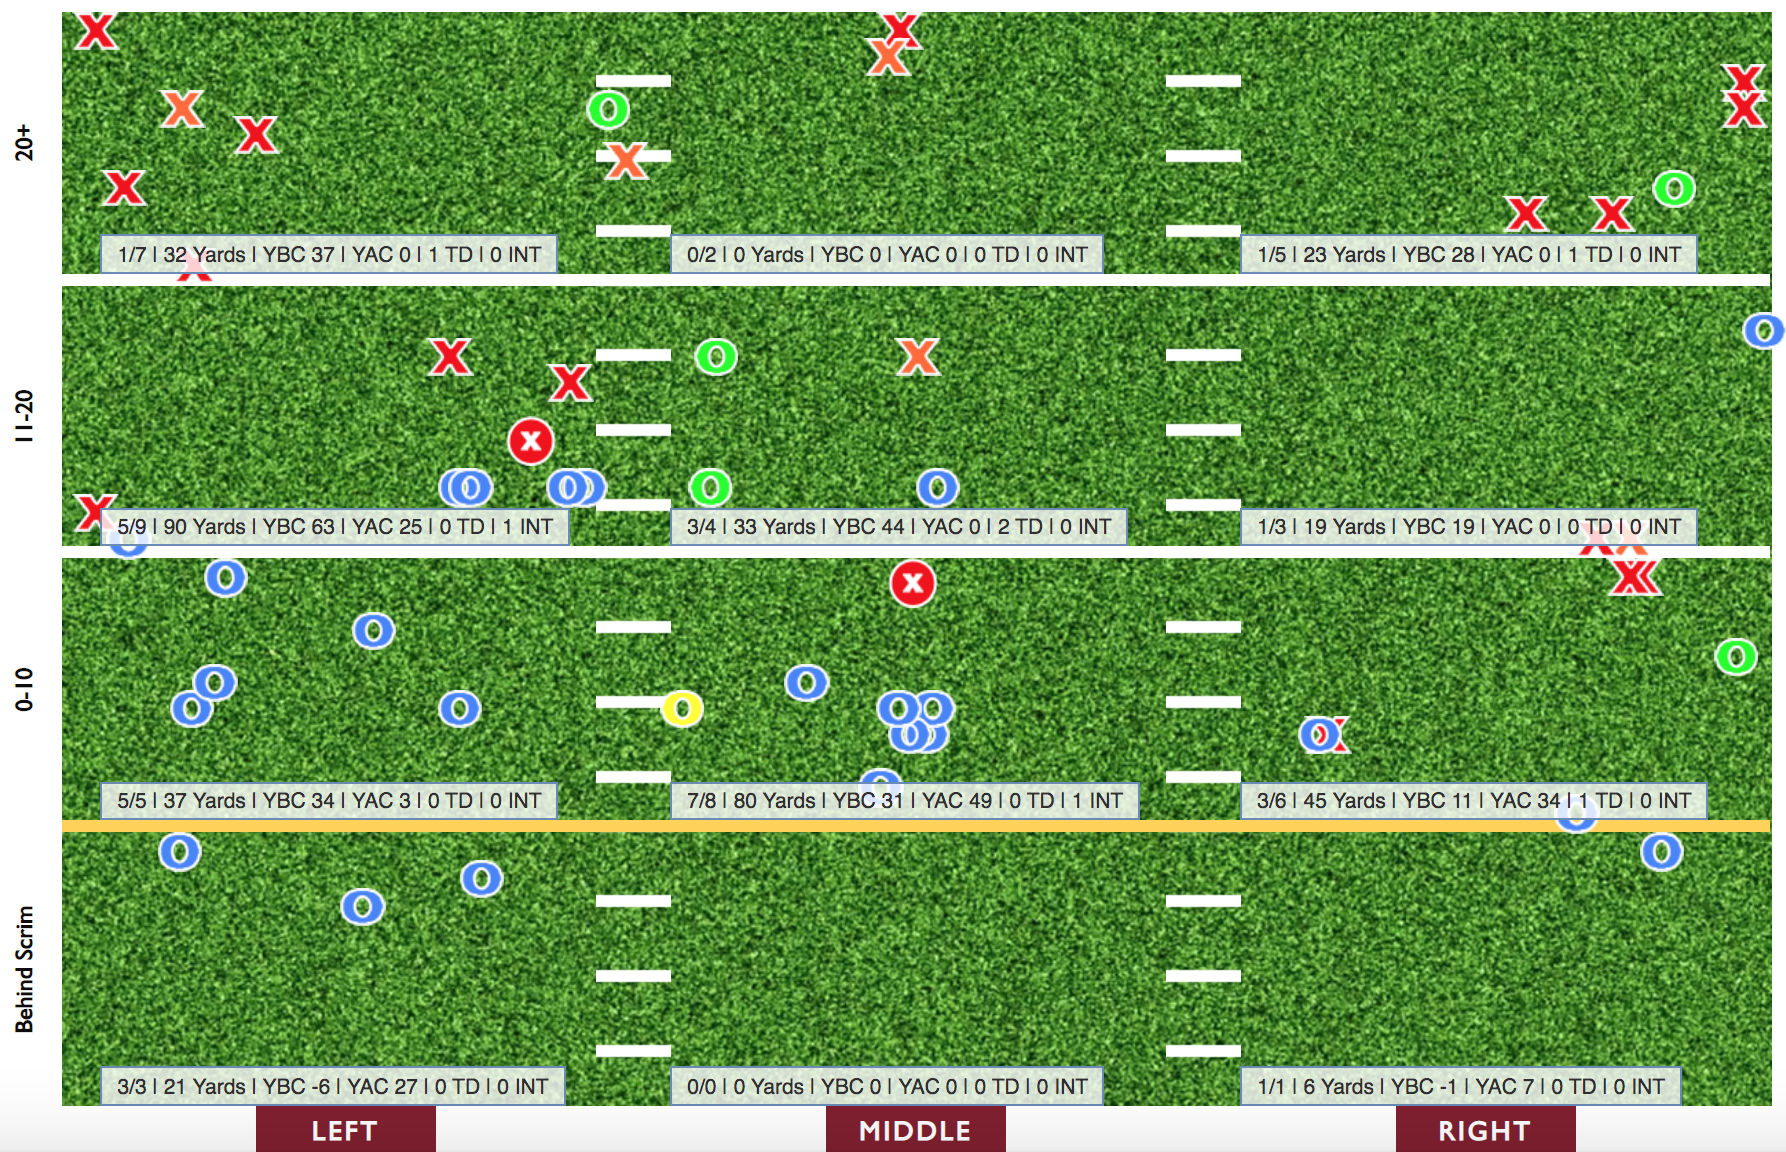
Their tallest receiver, Mitchell, was their best deep threat. His 151 yards lead the team by 84 (Isaiah Zubler managed to total 67). All five of his deep catches resulted in scores. Too bad, the other 13 targets fell flat on the turf. Only Tennessee’s Marquez Callaway finished the year with a higher average depth of target among players with at least 40 total targets within the SEC. Despite underwhelming deep results, his Explosive Catch Rate fell inside the SEC’s top15. That along with his 8.27 yards/target led the team. Outside of going deep, Mitchell was largely an underneath receiver with very few intermediate targets relative to his total. Winning consistently in these spots allowed him to command the team’s best Success Rate; no other Bulldog with at least 15 targets broke the 50% benchmark.
But he was a forgotten man on the money down and when the Bulldogs entered the Red Zone. Though both of his clips in these spots were satisfactory, his small sample size negates their weights. With his such a low Catch Rate on his deep and intermediate chances, Mitchell was among the ten worst SEC receivers in terms of Depth Adjusted Catch Rate. Though he didn’t have a drop problem like Guirdy, he was certainly less sound coming up with contested catches. Mitchell was only able to corral a quarter of his tight window opportunities, which placed him comfortably in the back half of SEC qualifiers.
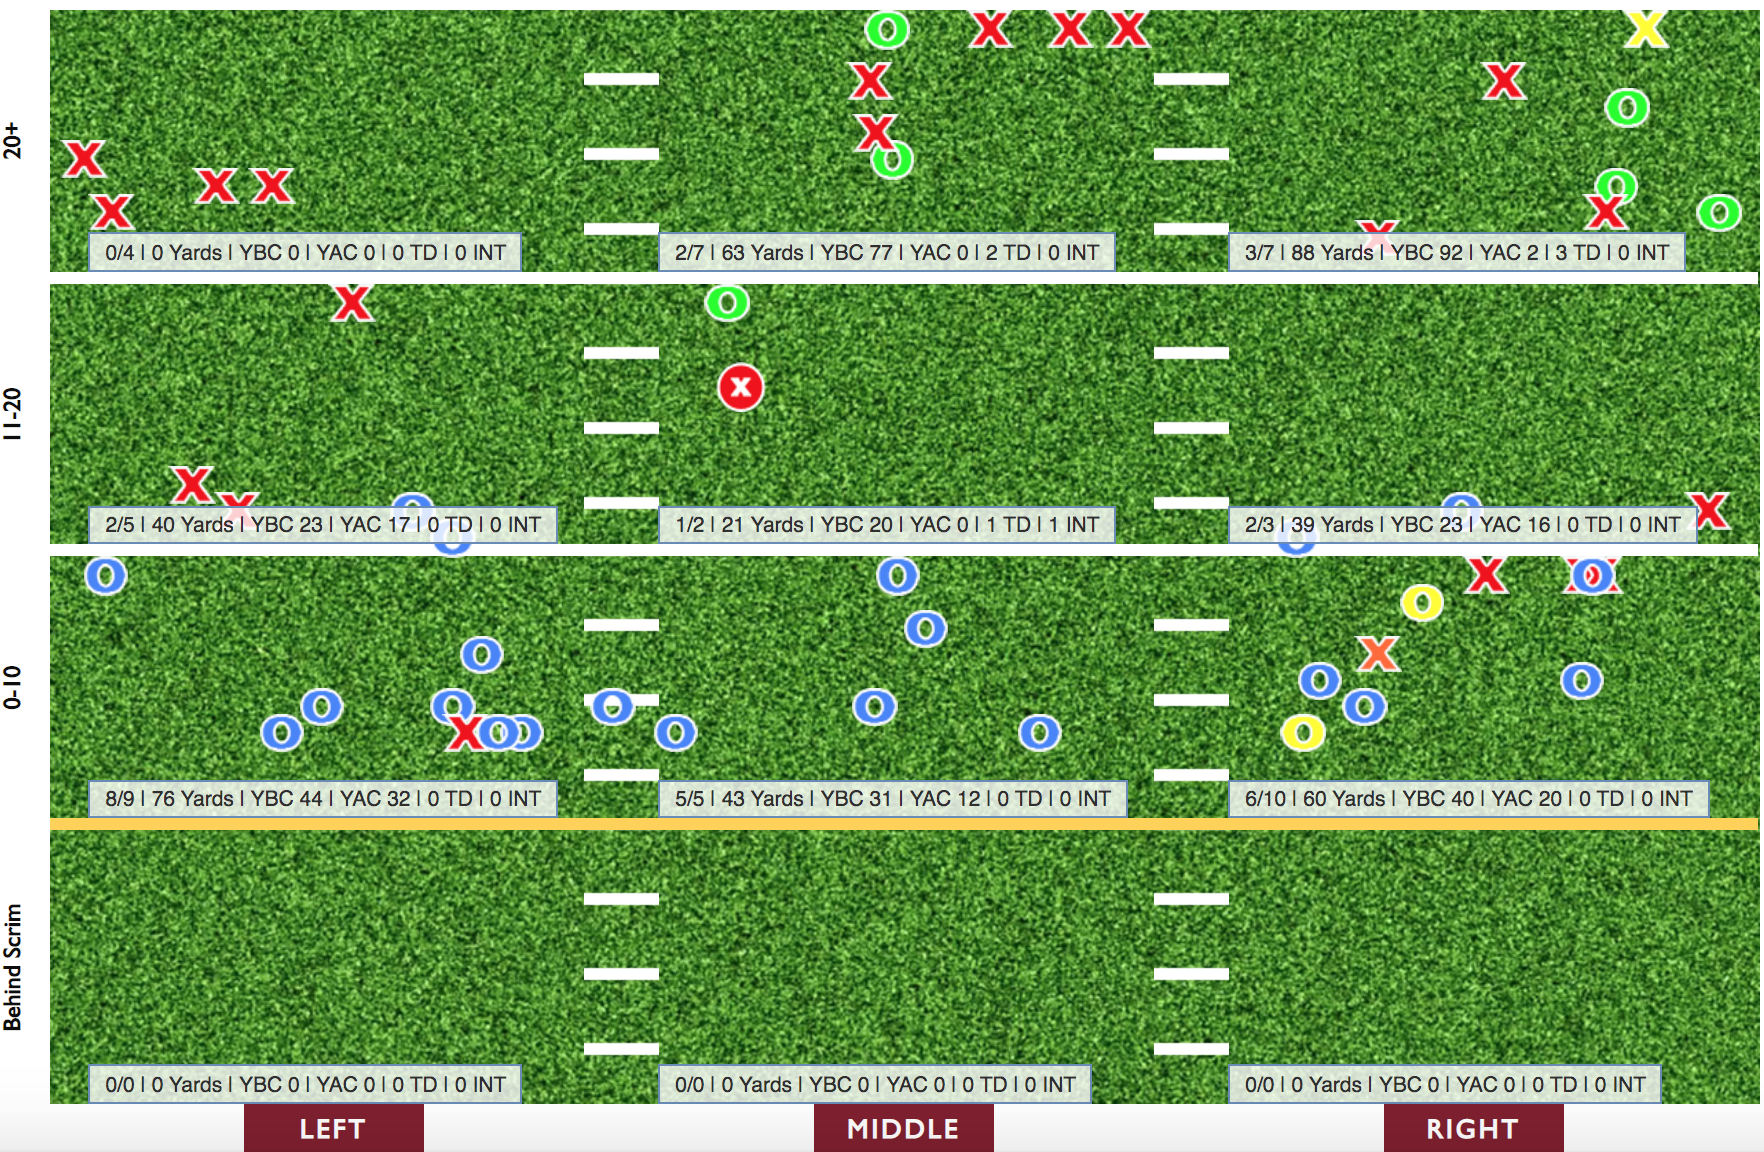
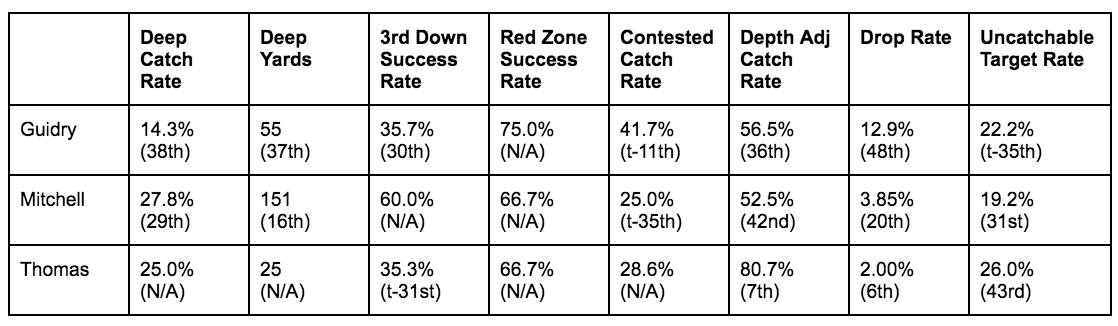
While Guidry and Mitchel were big bodies, their slot was a mighty mite. Despite being listed as 5’9, Thomas had the best hands on the team. He only dropped one pass on the year and his top10 Depth Adjusted Catch Rate of 80.7% was the best on the team by a mile. His degree of difficulty was often much lower than his counterparts in terms of contested targets and average depth of target. Of the three main options, he was the only one that failed to see more than eight tight window chances this season.
This might seem counterintuitive due to how most teams like to utilize their slots in their RPO game, but only 6% of his targets (and 10% of his catches) came off those plays, which was the lowest on the team. Though he only saw four deep targets, Thomas ended up as the SEC’s 16th most explosive pass catcher with 14% of this grabs going for at least 20 yards. MSU’s passers appeared to trust his hands the most in tough spots as he led the team in both targets (17) and yards (147) on the money down. Six of his eight catches in these spots resulted in conversions.
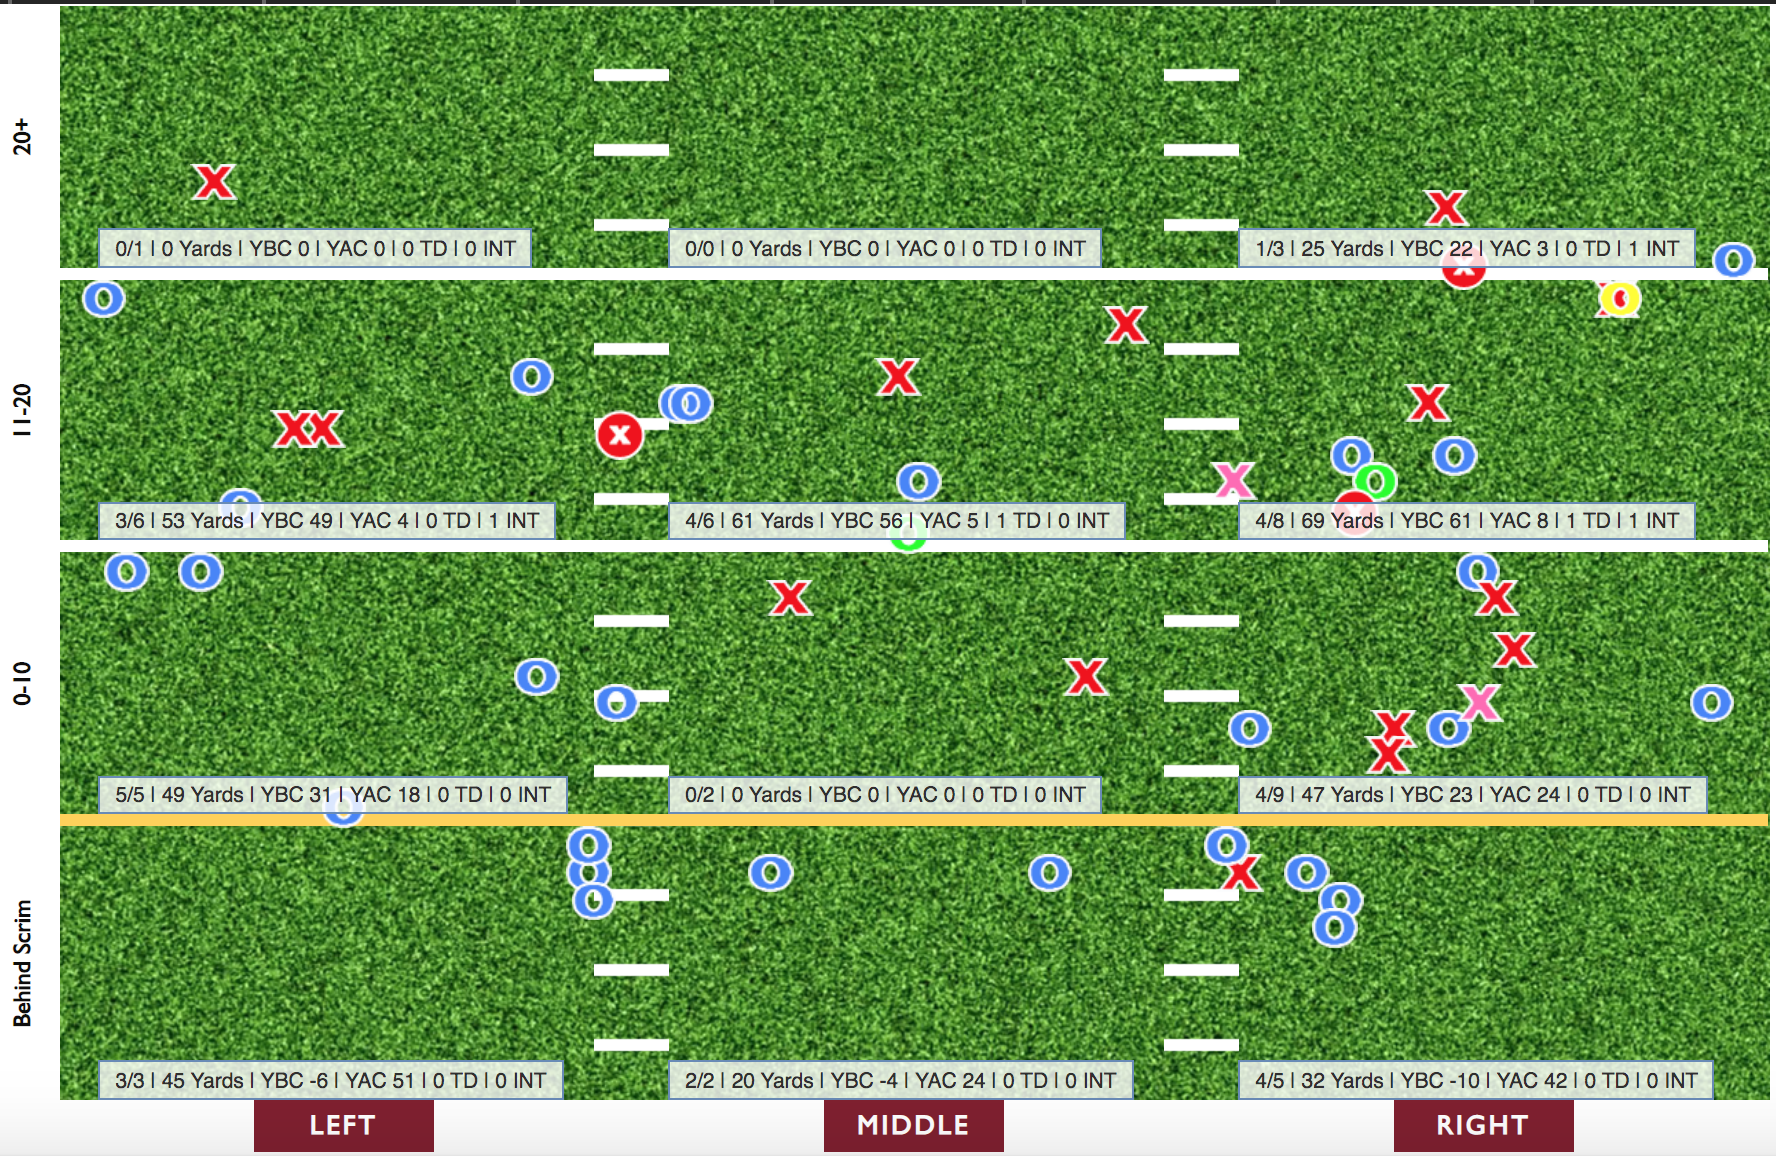
Mississippi State didn’t like to take to the skies when they entered the Red Zone. On the year, they only totaled 23 pass attempts in this area of the field with no Bulldog receiver seeing more than four targets. Ten SEC passers alone bested that by themselves. But while their sample sizes were small, all three of their main options were successful in the Red Zone.
With the way the roster was currently constructed, passing would never be Mississippi State’s strength. But their run game still had plenty of pieces to make it all work. By volume, the Bulldogs averaged the third most rush yards per game within the conference with the second best yards/attempt. Though analytics say they weren’t as lofty, MSU’s rushing attack still cracked the conference’s top5 in terms of Success Rate. But as that high yards/attempt implies, plenty of big gainers came from them slashing and gashing fronts on the ground.
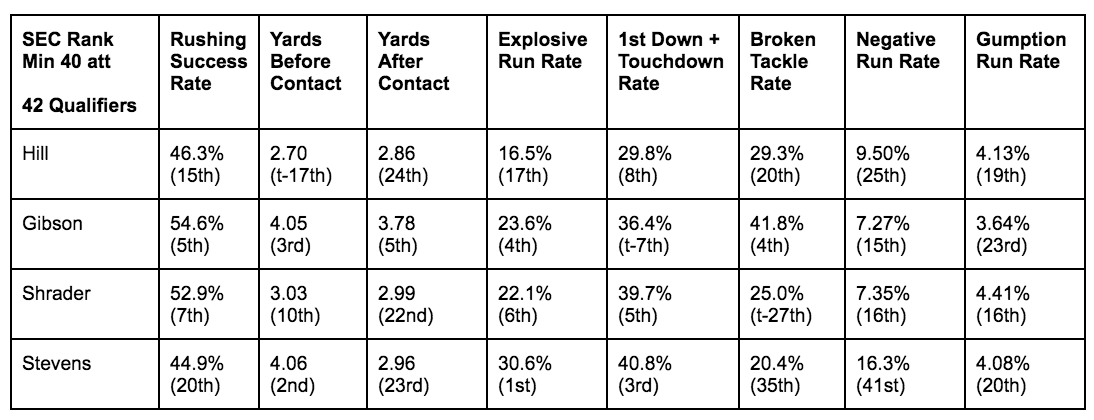
Kylin Hill was the undisputed lead back for the Bulldogs once again. He saw no shortage of carries as he led the conference with 242 designed rushes. With his acumen to find light and by his volume of tries, Hill ended the season as the conference’s third leading rusher. While he was one of the hardest ball carriers to bring down in 2018, Hill ran with less of an edge in 2019. His average yards after contact was nearly a full yard worse year over year. In fact of MSU’s four main rushers, he had the worst on the team. Last year, Hill was one of seven SEC rushers with a Success Rate over 50%, but he regressed there as well this season. Though his clip was still within the top15, he was barely above average.
Since he was the obvious focal point for this offense, defenses aimed to neutralize him. He averaged the lowest yards before contact among MSU’s four main rushers and almost a tenth of his attempts went for a loss. All three of their other main ball carriers benefited from top10 clips within the SEC. Because of this, they were more prone to make something with their chances. With more obstacles in his way than the others, Hill’s Explosive Run Rate finished 17thin within the conference with the other three placing inside the top6.
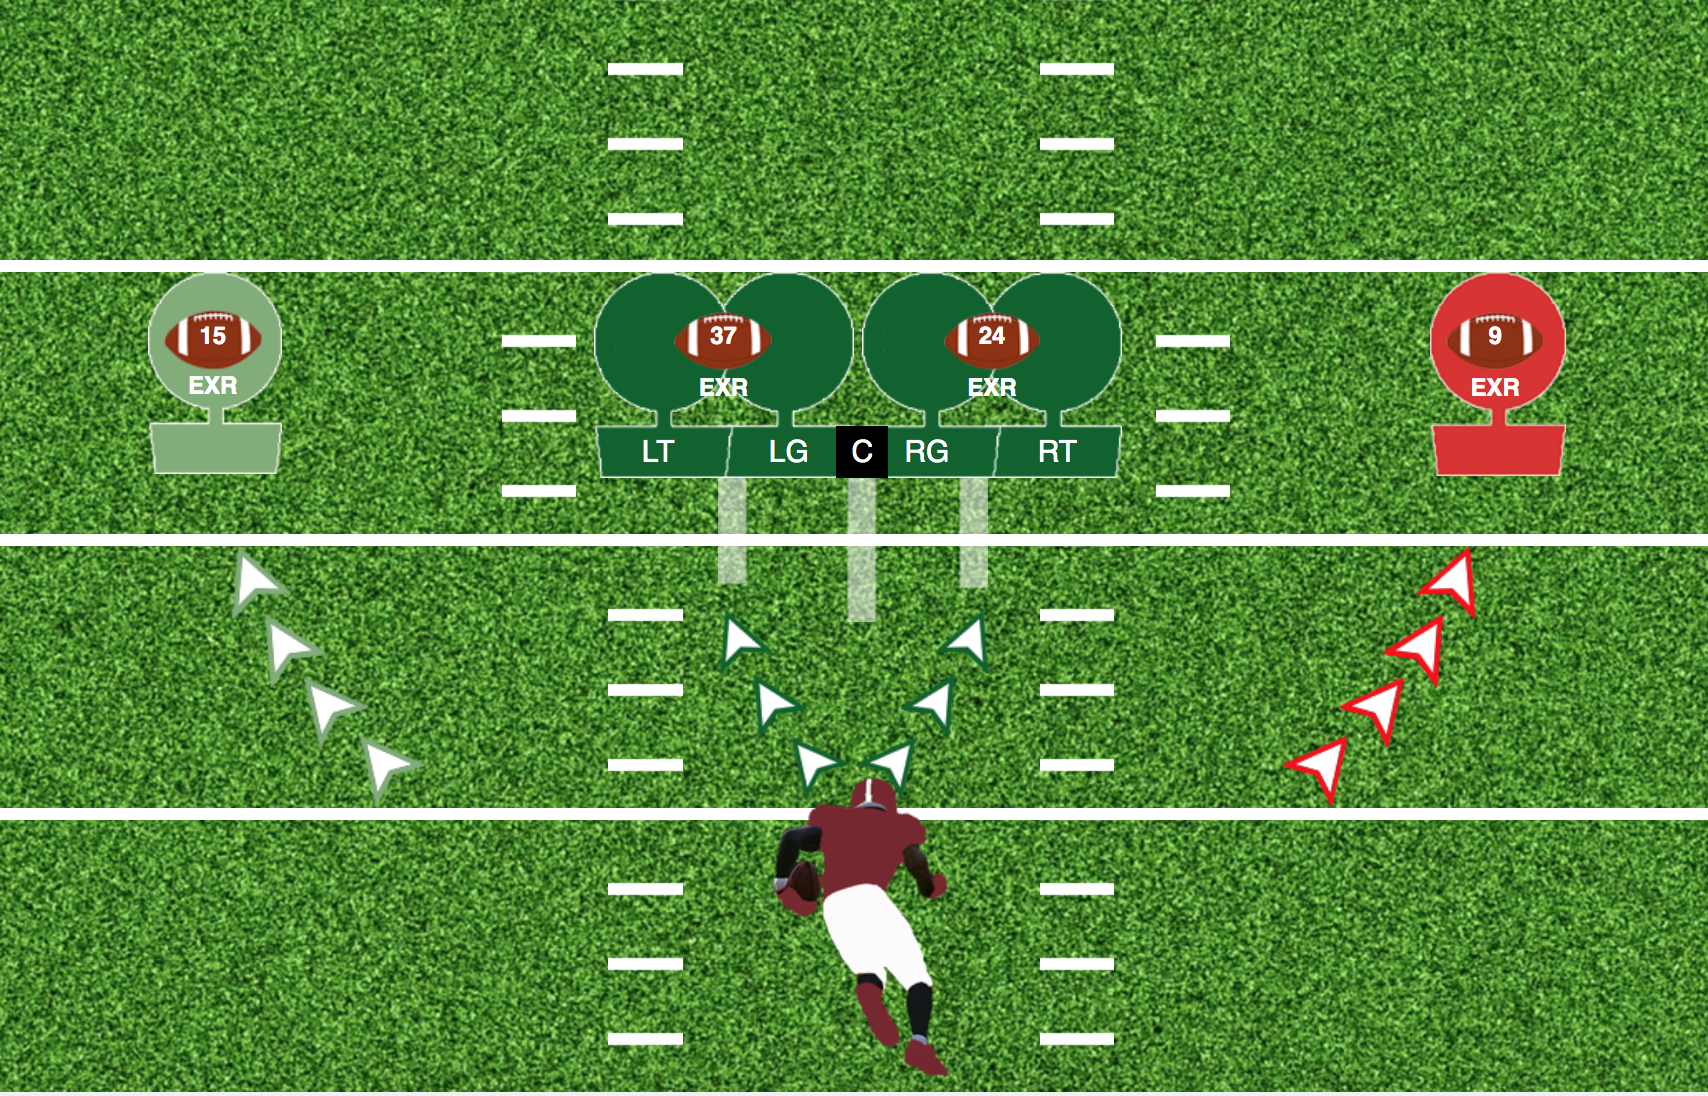
Though most rushing offenses find more success running rightward, Hill saw most of his success scampering toward the left of center. When he rushed right, his Success Rate was only 42.5% compared to a 48.9% clip on leftward runs. In general, this remained true for the rest of Mississippi’s ground game. Their Success Rate towards the right was 44.3% and their clip towards the left was 49.4%.
In a reserve role, Nick Gibson was unequivocally one of the most efficient rushers during his senior season in Starkville. Perhaps underestimated by defenses, Gibson certainly earned respect by the year’s end. He was the only SEC ball carrier with at least 40 designed runs to place among the conference’s top5 in both average yards before and after contact. For good measure, he also led the team in Rushing Success Rate, Broken Tackle Rate and Negative Run Rate. Plus, his Explosive Run Rate and 1st Down+Touchdown Rate both were among the SEC’s top7. Only UK’s Lynn Bowden averaged more yards per carry.
He did most of his damage running leftward. Of his 55 attempts, 37 went left of center where he boasted a 62.2% Success Rate. Like Hill, there was a noticeable dropoff in his efficiency when Gibson rushed towards the right. His Success Rate of 35.3% on these chances were the worst on the team.
Though there was a mixed bag with their passing, Mississippi State’s quarterbacks performed admirably on the ground. Thanks to their read-heavy scheme and the occasional QB-design run, both of their passers saw a healthy portion of the Bulldogs’ carries. Shrader, for instance, totaled 68 designed rushes, which were the second most on the team. Despite being injured for moderate stints throughout the year, Stevens chipped in an additional 49 run tries.
Shrader and Stevens both made good decisions in the read game more often than not. With prudent pulls on these designs, both posted top10 yards before contact averages. With the gobs of green grass commonly presented to them, each boasted top6 Explosive Run Rates and First Down+Touchdown Rates. Since both of Mississippi’s State’s backs were dynamic in their own right, the read game allowed Stevens and Shrader opportunities to scoot when defenses over pursued.
Stevens was worse down-to-down despite the fact his Explosive Run Rate led the conference. This was largely due to the fact he suffered from the second worst Negative Run Rate within the SEC. Basically a sixth of his designed carries went for a loss. This boom or bust really hindered their plans to manage down and distance and his 44.9% Success Rate was the worst among their four main ball carriers. Though neither were spectacular after contact, Shrader broke a tackle on a quarter of his carries and had the best Gumption Run Rate on the team. This measures the percentage of carries where initial defensive contact occurs behind the line of scrimmage but a positive gain is made.
2020 Vision
Mike Leach is cut from a different cloth. He does things differently. And that’s just what a middling program in terms of resources and trajectory need to win in the margins. Trying to line up and out-smash the Alabamas of the world usually ends poorly for the lesser talented team.
The Air Raid Offense had immediate gains when it was installed in Lexington in 1997 and in the Bayou this past season. Who isn’t to say the same can be true for the Bulldogs in 2020. Still, it will take this roster some time to adjust to Leach’s style of play. In 2019, Washington State had a Pass Rate of 84%. In case you forgot or skimmed that part above, MSU’s was 47.1%.
Leach values accuracy from his quarterbacks and consistent pass catching from his receivers. Garret Shrader had some nice numbers as a freshman but he probably lacks the minimum accuracy Leach craves long term. In the short term, Stanford grad transfer KJ Costelllo will get the first go of it next season. Though he has some injury concerns, Leach had proven he can make the most of his one and done QBs.
But it won’t matter much if the defense has another lackluster fall. While Leach’s offenses light up scoreboards and statsheets, his defenses can be rather porous.