Sideline to Sideline: Ole Miss 2019
Ole Miss at a Glance
I wonder if history will be kind to Matt Luke. Stabilizing a program under NCAA sanctions is a pretty hard gig for a first-time head coach. Plus, Ole Miss historically is a hard place to win. Still, 2019 was Matt Luke’s third season in charge. The school’s brass was thirsty for tangible on-field improvement after weathering the storm from said sanctions. Though it came through nefarious means, the crop dust of the Hugh Freeze era still lingered and teased. The idea that Ole Miss could be a stalwart in the SEC remained strong.
With the hard part seemingly being over, the Rebels were back to being bowl eligible this year. Though there was no guarantee going bowling would save his tenure in Oxford, Luke’s objective this season was clear. He had to get his upstart team to the postseason.
While Ole Miss’s youngsters provided plenty of highlights, discipline and lack of experience ultimately cost the Rebels their season. I’m sure you all are just itching for me to bring up how the Rebels pissed away the Egg Bowl. And yes, that was super embarrassing and singular. Ole Miss went 0-5 in one score games -- the Rebels were in position to tie or take the lead late in four of them. After three seasons of dwindling returns in the Win-Loss column paired with that humiliating downturn against their biggest rival, Luke was shown the door.
Ole Miss’s offense was always interesting under Luke. His first two seasons saw one of the most incendiary units in the entire country as both finished inside the top10 of Football Outsider’s S&P+ Overall Ranking and Explosive Play Ranking (Bill Connolly’s stat is now at the Worldwide Leader but is referred to as SP+). Last year with Jordan Ta’amu being one of the most prolific passers in the country, Ole Miss’s aerially-inclined attack only trailed Alabama and Georgia within the SEC in terms of Success Rate.
Longo jumped ship and Ole Miss was forced to recalibrate their attack with the departures of Ta’amu and his outstanding outlets: DK Metcalf, AJ Brown, DeMarkus Lodge, and Dawson Knox. Rich Rodriguez was chosen to guide this offense through this challenging roster turnover and instill a new identity. Due to his pedigree, I’m sure not many expected the Rebel’s to repeat as the SEC’s most pass-happy offense this season. Year over year, Ole Miss’s Pass Rate of 57.9% dropped to 42.8%, which was second lowest in the SEC this season. For much of the year, no one handed it off more than the Rebels. But because of a cavalier midseason offensive adjustment, Kentucky’s Lynnsanity offense finished the year as the SEC’s most run-heavy offense within the conference.
Longo was about aggressive balance. Perhaps not in the old ways of thinking about it in terms of Run-Pass ratio, but Longo did a great job of keeping defenses guessing. He called a fair amount of both zone and power read aspects and could send any of his options deep on any given play. Though his designs were not X’s and O’s masterpieces, they remained highly effective due to the talent within their offensive ranks. Hell, just under a third of Ole Miss’s targeted routes were either a streak or a curl in Longo’s last season. It was very up and down.
Though Phil Longo’s scheme was all about going deep, the Rebels unleashed the highest RPO Rate of any SEC offense in 2018. Over 41% of their offensive plays were RPOs two seasons ago; no other SEC offense had a clip over 35%. Thriving in these spots, Ole Miss consistently was ahead of the chains and marched downfield. Their issues were getting it done on 3rd Downs and in the Red Zone, but that’s old news.
Again, it never would make a lot of sense for Rodriguez to come out blazing in this manner. That’s not his roots nor was it the best way for Ole Miss to get the most out of its players. But his spread-run philosophy would still incorporate plenty of elements seen in Longo’s offenses in Oxford.
First, Ole Miss remained one of the most RPO-reliant offenses around. Granted, their 33.1% RPO Rate was far less year over year, but it still led the SEC. RPOs allowed the Rebels to play the numbers game, give their passers potentially easy completions, and create run lanes without having to always resort to winning in a phone booth. The majority of these badboys were Inside Zone Slam or Bluff Reads with a slot bubble outlet; the most common RPO in college football. While half of their total rush attempts were off RPOs, nearly two-thirds of their zone reads ultized route tags.
Though Ta’amu was mobile, he certainly was more inclined to get the ball to one of his YAC monsters in space. Over 30% of his pass attempts in 2018 were off RPOs, which is the highest rate the last two seasons by seven percentage points inside the SEC. Matt Corral and John Rhys Plumlee were far more comfortable winning with their legs. Both finished with RPO Throw Rates right near the conference median around 13%.
First and 10 is where the Rebels unleashed them the most; over 44% of their plays there were RPOs -- a conference high this season. With a ground-first approach and the aforementioned shyness of their passers, Ole Miss also sported the SEC’s highest Run Rate in these spots. Less than 27% of their 1st Down plays were passes.
Generally speaking, Ole Miss was the most straightforward offense to start a set of downs within the SEC. Their top6 most called concepts on firsts composed over 63% of their calls. No other SEC offense had a play share over 55% in that context. Again, this was heavily dictated by their love for Inside Zone Reads, which commanded an insane 40% of their calls in these spots. In general, over a third of Ole Miss’s play calls were off Inside Zone Reads -- the highest composition in the conference
We saw what “flipping the script” can do for a team like LSU. Ditching the old way of doing things of riding antiquated, run-first tactics in favor of a modern Air Raid scheme, they went from afterthought to one of the best offenses ever. The opposite happened for Ole Miss. The Rebels league-leading 144 rush yards per game on 1st Downs in 2019 was 50 yards more than the SEC average. But volume returns aren’t everything.
Though their hands were forced in many ways, running more made this once prolific unit rather ordinary. They went from being the SEC’s most successful 1st Down offense to the fifth worst. Since passes typically average more per runs on average, it shouldn’t be a surprise Ole Miss saw a yard and a half dip in their average yard/play on firsts with their increased inclination to turn to the ground to start a set of downs. Year over year, Ole Miss’s Rushing Success Rate declined by ten percentage points.
With running the ball being the focal point, Ole Miss’s passers saw their best numbers on firsts. There, the Rebel’s Passing Success Rate exceeded their Rushing Success Rate by nine percentage points. Though their 49.5% clip was still only good for 6th best in the SEC, it was average within the conference unlike its subpar Rushing Success Rate. And it wasn’t like their passers were doing much heavy lifting. Over 30% of their 1st Down attempts were RPO Outlet Screens or Slant Variations. These patterns don’t require much arm talent to be effective.
While the love for curls and hitches remained under Rodriguez, vertically-oriented routes like streak and fades were supplanted in favor of shorter, laterally-oriented routes like slants and outs. Roughly 30% of their total targets were directed towards these two routes. But that isn’t to say Ole Miss’s passers didn’t try their chances deep either. If Corral and Plumlee were one passer, their combined 52 deep attempts would rank fourth within the conference.
Passing returns dwindled on later downs. In these spots, the Rebels were often behind the chains and were needy of a big play from their passers. With the degree of difficulty upped compared to their low-risk modus operandi on firsts, Ole Miss QBs were blah. Their 33% 3rd Down Passing Success Rate was average within the conference.
Across all downs, Ole Miss’s Rushing Success Rate stayed in the low 40’s. This low rate of efficiency resulted in the Rebel’s run-heavy attack finishing with the fifth worst clip in the conference. That’s right. Even though Ole Miss broke off numerous long runs, the Rebels run game wasn’t good down-to-down despite sporting the SEC’s fourth best yards/rush average (5.96). Long scampers inflated this figure, which no doubt influenced this unit’s perception for the less-informed. “Well, we average a decent amount per carry so we are pretty good running the ball, Darnell.” Wrong. While there was potency, there was little consistency for this run game.
Even two-back sets failed to generate much of a bump down-to-down. You’d think a tricky run game with a three-headed option attack would yield higher gains, but it really didn’t. Though Ole Miss’s overall Success Rate increased to 45% when deploying 20 or 21 personnel, the Rebels only averaged 5.93 yards/play -- which was lower than their normal clip.
Only Florida went five-wide more often than Ole Miss. Though it was mostly a desperation move, Ole Miss constantly found themselves in holes in second halves where going empty presented their best course of action. Plays from empty accounted for over 16.5% of Ole Miss’s yardage, which was the SEC’s highest such composition. But again, these instances were mostly when Ole Miss had its back against the wall. The Rebels’ Success Rate was a mere 39% from empty sets, which was even lower than their overall figure despite averaging a whole yard more per play. Ironically despite leaving their passers with barebone protections, Ole Miss quarterbacks saw far less pressure per attempt from five-wide sets.
Thanks to occasional breakaways on the ground, Ole Miss finished with the SEC’s fifth best Explosive Play Rate. Their Explosive Pass Rate -- or percentage of passes that net 20 or more yards -- was almost cut in half year over year. Green passers and unproven receivers will do that to you. But, the Rebels’ Explosive Run Rate remained stout. Nearly 17% of their designed carries gained ten or more yards.
The big gainers helped Ole Miss stay on the field longer. The Rebels averaged the third most yards/drive and sixth most plays/drive within the SEC despite owning the worst starting field position on average. With extended drives, they suffered from less Three-and-Outs. Only about 20% of Ole Miss’s drives lasted three plays, which was the fifth best rate in the conference. The Rebels, however, still struggled to reach the Red Zone. Their 40 trips inside their opponent’s 20 yard line was the fifth least within the conference.
Ole Miss’s offense finished above the conference average in points/drive and yards/game. But failing to get those elements efficiently doomed them. No one in the SEC averaged more plays/game than Ole Miss, which certainly didn’t help their efficiency numbers. With a substandard Success Rate (40.8%) , Touchdown Rate (4.39%), and Turnover Rate (1.69%), it’s impressive the Rebels were actually able to don decent traditional stats all else considered.
The seesaw switches with their two signal callers interfere with the Rebels sticking to any one style. Corral was much more in the mold of a mini-Ta’amu -- but he still had miles to go in terms of slinging the pill. Though a promising passing prospect, he commanded copious amounts of stalled drives. Plumlee provided much more electricity thanks to his legs. Yet, he was much more reliant on RPOs and less strong in dropback situations. I’ll dive more into their dynamics later.
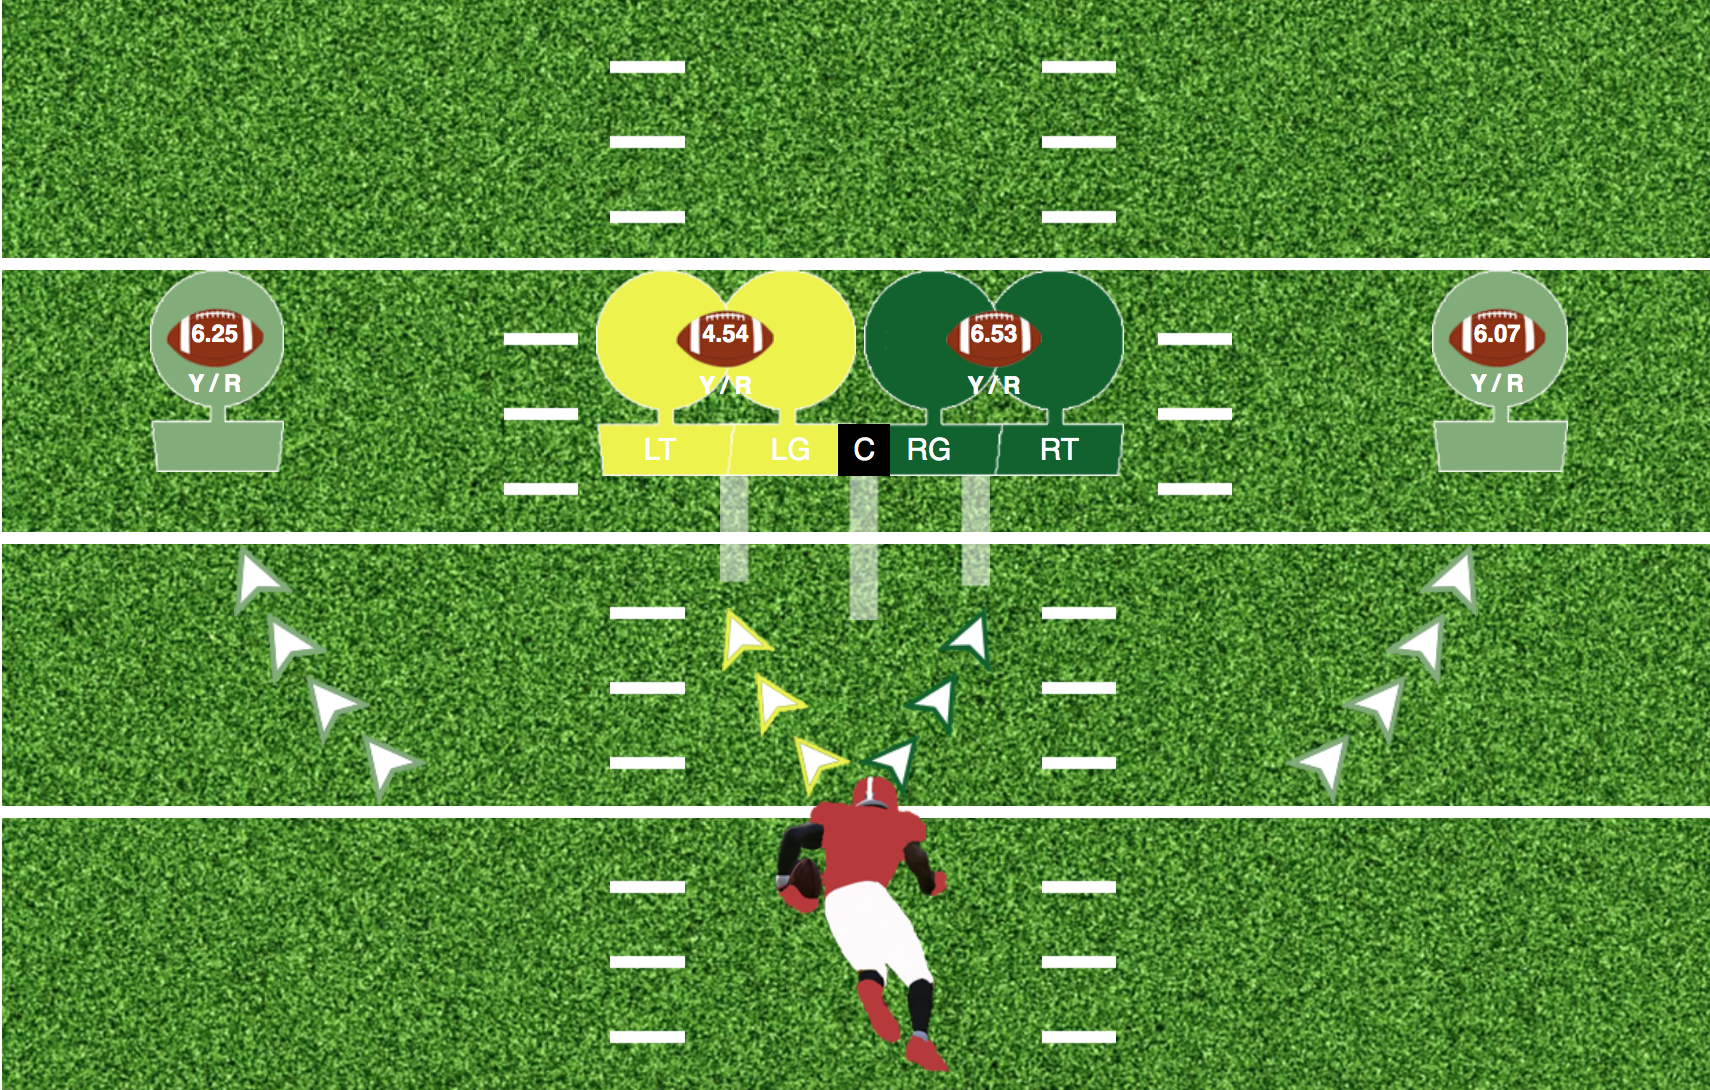
Mississippi’s overall line play was not strong. Though average in terms of Havoc Rate, Ole Miss ball carriers averaged 2.48 yards before contact -- the eight highest clip in the conference. This clip was heavily influenced by Plumlee’s speed on the edge. He was the only one of their main rushers to average more than that 2.48 clip before contact. Every other carrier with at least 30 touches finished with their figure below 2.4. But their line’s shortcomings didn’t end there. Ole Miss passers suffered from the fifth highest rate of pressure per dropback. Over 30% of their passes were under duress. But thanks to their quarterbacks’ ability to improvise and escape pockets, Ole Miss finished the year with the third best Sack Rate in the SEC at 1.91%.
The defense showed signs of improvement early on. ESPN’s SP+ metric even rated them among the top50 in the country by year’s end. Still, the unit still found great difficulty stopping conference foes. Ole Miss exhibited a negative statistical relationship essentially across the board; meaning what they allowed was greater than their own outputs when up against SEC opponents.
This isn’t the best way to structure a paragraph, but here are the low-lights in regards to their negative stat areas. Ole Miss had the third worst margin in terms of Overall Success Rate (-4.8%), fifth worst yards/play margin (-0.33), fourth worst turnover margin (-0.47%), third worst Pass Havoc Rate margin (-7.3%), and fifth worst yards/game margin (-10).
Though the defense rose to its best level nationally in Luke’s last year, his offense -- the one aspect that was keeping the Rebels viable -- took a big step back with the move towards a spread-run attack. Objectively, a regression was bound to happen. But going from a top10 unit to the definition of average is a hardsell for someone with experience on that side of the ball. While you can make a case Luke’s firing was premature -- and who knows he might be the next Ed Orgeron in ten years -- there’s no doubt his dismissal was the university’s attempt to put the last half decade behind them.
Ole Miss’s favorite run looks

1. Inside Zone Slam Read 20.1% Play Share 5.29 Y/A 43.3% Success Rate
Inside Zone Slam Reads are one of the most common concepts in modern football. With the rise of read options and RPOs, this foundational run look often hinges a good amount of an offense’s calls. Since Ole Miss’s spread-run scheme was really into those aspects to propel the Rebel’s offense, Slam Reads were a naturally major part of their plans down-to-down. No other SEC offense saw Slam Reads own such a high play share.
Across all downs, it was their favorite play. But despite being their most repped concept, Slam Reads’ returns were rather average. On early downs especially, it wasn’t a secret the Rebels wanted to keep it on the ground. Defenses were often well-positioned to stop this basic Inside Zone Read design. Though work after contact helped their backs break off a number of big gainers, their carries off this concept were largely a crapshoot. On firsts, Slam Reads met its overall yards/attempt average but only 36.2% of them resulted in success. Ole Miss executed these much better on 2nd and 3rd Downs where the concept sported 50% and 60% Success Rates, respectively. With the loads of opportunities Slam Reads received, they naturally accumulated a good amount of yardage. Its 942 yards were the most for the Rebels by over 200.

2. Inside Zone Bluff Read 12.6% Play Share 6.04 Y/A 47.3% Success Rate
Running Slam Reads over and over might work for some teams. But if you are a wise play caller, you want to offer up variety and complimentary designs to make a defense pay if they are keen on an oft-called concept. To help carry Ole Miss’s run-heavy script, the Rebels turned to Inside Zone Bluff Reads the second most of any concept. Like their brother concept, Ole Miss called more of them than any other offense within the conference. The Rebels were the only SEC offense to give Bluff Reads a double-digit play share in 2019.
Bluffs and Slams are exactly the same barring one key wrinkle involving the off-set tight end or fullback. Rather than abiding by the normal playside zone action like on Slams, these fellows fire against the grain and seal the backside. This creates a hard cutback lane should the playside zone get stuffed and potentially provides a personal protector for the QB should he choose to keep the ball in the read game. Bluff Reads were overall more successful than their Slam Read counterparts for this very reason. With more of a “threat” on the opposite side of the center, this often made backers more hesitant to come downhill. On 1st Downs, Bluffs met their overall average and only Slam Reads bested their Success Rate on thirds. They were at their worst on 2nd Downs where they finished with a 40% Success Rate on 3.6 yards/attempt. Still in the end, Bluff Reads accumulated the second most yards of any look with 676. Besides the two Inside Zone Reads, no other Ole Miss concept broke the 300 yard barrier.

3. TAG Q Counter Nakie Toss Read 3.72% Share 8.03 Y/A 45.5% Success Rate
Over a third of Ole Miss’s offensive plays and 57.1% of their designed runs were Inside Zone Reads in 2019. Very rarely could Ole Miss just line-em-up and expect to win by sure force or power of will. Rich Rod had to get creative to maximize his personnel. Unleashing this design certainly accomplished its intended purpose. The TAG Q Counter Nakie Toss Read on its face looks like it has a lot going on. And that’s kinda the point to fudge with an aggressive front. But functionally, this look is an inverted Tackle Counter Read. The usual path of a QB on read options is to attack away from where the primary run is directed and threaten the edge on the opposite side. On this play, the primary run lane is forged for the QB to run the counter action with the back hitting the edge. But instead of meshing with the QB when he’s reading the defense, the back runs a simple toss path. Normally on Counters, the typical design asks the backside guard along with the off-set tight end or fullback to act as lead blockers. On Tackle Counters, that off-set player’s role is taken on by the backside tackle.
Though the option to pitch it to his back on the edge existed, this was mostly a play for Ole Miss’s quarterbacks to get north and south in the run game. John Rhys Plumlee particularly was well-equipped to run this design due to his jitterbug burst. When Rebel QBs kept the ball on this design, half of their reps ended in success and averaged 10.1 yards/attempt. Left with minimal blocking on the perimeter, their backs didn’t do so hot on their chances. Collectively, they only averaged 4.85 per carry on a 38.5% Success Rate. Overall, only the two Inside Zone Read plays and All Verts outgained its 265 yards on the year.
Though an outlandish wrinkle, a number of SEC offenses started to adopt this design as the year went along. But the question remains: what exactly to call it? When Tennessee was preparing for UK’s Lynnsanity Offense that featured the look, Jeremy Pruitt referred to this as “peanut butter” when talking to ESPN’s Tom Hart during production meetings. I mean, TAG Q Counter Nakie Toss Read doesn’t really roll off the tongue. So, I might have to relabel this badboy moving forward.

4. Q Stretch 3.72% Play Share 8.46 Y/A 66.7% Success Rate
With loads of Tackle Counter actions, QB Outside Zones provided a natural counterpunch towards the edge for this offense. Unlike inside zones that often require more of a vertical push in order to be effective, Stretches are quick seals and are far more horizontal in nature. Q Stretches received the exact number of calls as TAG Q Counter Nakie Toss Reads. So Rich Rod really aimed to keep edge defenders uneasy. If he couldn’t bowl over fronts, he sure as hell could disorient them with loads of different schemes. Backside edge players can easily be picked on if they become complacent. Since a good amount of designs call for them to be the “read men”, they often can be lulled. In this relaxed state, reaching them is a far easier task then when they have hard gap integrity towards the outside.
With Plumlee in the backfield, Q Stretches were consistently one of Ole Miss’s best plays. Overall, the look boasted a Success Rate that was 12 percentage points higher than their next most successful concept. Of the Rebels’ five most called runs, Q Stretches were the only one with a Success Rate over the 50% threshold. These were especially great to start a set of downs. On firsts, Ole Miss averaged over 12 yards/attempt with a 75% Success Rate. Again the read-heavy scheme often toyed with backside defenders by taking it right to them on the edge.

5. Tackle Counter Reads 2.36% Play Share 9.67 Y/A 47.6% Success Rate
Tackle Counters Reads were Ole Miss’s favorite power plays. While I already talked about their TAG Q Counter Nakie Toss Read wrinkle, all other Tackle Counter Variations combined to account for the fifth largest play share among run looks. These include typical Tackle Counters, Inverted Tackle Counters, and Tackle Traps. They even used this blocking scheme on a Sprint Draw design. With all these pooled together, none of Ole Miss’s other go-to run plays averaged more per carry. As far as their five most favorite runs and pass concepts, only All Verts topped Tackle Counter Reads’ 9.67 clip.
Looking at all Tackle Counters under one umbrella, 36 of their 54 reps occured on 1st Downs. While the Success Rate was on par with its overall clip, Tackle Counters averaged about 2 yards less per carry to start a set of downs. Still, the variety within these looks was just enough to create an extra beat for the defense to decipher its design. Of run concepts with at least a 1.3% play share, only Q Stretches and Nakie Veers sported higher Success Rates than Tackle Counter Reads’ 47.6% clip. Omitted the plays of TAG Q Counter Nakie Toss Reads, Tackle Counters racked up 203 yards, which tied with Q Stretches for the fifth most of any look for the Rebels.
Ole Miss’s favorite pass looks

1. Fades 2.93% Play Share 5.35 Y/A 23.1% Success Rate
Painting with a wide brush, the vast majority of Ole Miss’s aerial assault in recent years called for streaks, curls, and fades. Under Phil Longo, Ole Miss’s passing game was a vertical-minded attack that took plenty of Shots. Despite the aggressive nature of his tactics, his designs were still largely rudimentary and basic. Though the aggressiveness to turn to the skies waned under Rich Rod, many deep concepts continued to see plenty of targets. Unfortunately, Fades yielded the lowest Success Rate of any of Ole Miss’s five favorite run or pass plays. Of those looks, only Inside Zone Slam Reads averaged less per attempt.
Completing Fades, already a design with a high degree of difficulty, was a hard-ask for Ole Miss’s green passers. No SEC offense was more run-heavy than the Rebels to start series across their entire schedule in 2019. That frequently pushed Fades, Shots, and other vertical pass concepts out of their early down play calling. Of the 26 Fades targeted by Ole Miss this season, 19 occured on 2nd or 3rd Downs mostly when they were behind the chains. Though outside receivers also saw opportunities, most of Ole Miss’s Fade designs were slot fades with complimentary hitches.

2. Sail 2.93% Play Share 6.69 Y/A 38.5% Success Rate
Sails are strongside floods that typically consist of an outside vertical, middle deep out or corner, and underneath route to the flat. The routes create a vertical stack outside the numbers that aim to overload certain zone coverages. Since a decent amount of basic zones will only see two defenders in that silo, the offense usually can find an open man due to the numbers advantage. Though Ole Miss called a few variations to this flood pattern, their favorite was off a play action waggle action. A backside off-set tight end would pretend to block a “bluff” path faking a split zone run before continuing his route into the flat. The playside receivers would run the deep out and vertical.
In an effort to get their mobile quarterbacks moving outside the pocket while also providing less muddled pass reads, Sails rarely got the job done. Only Fades finished with a lower Success Rate among their five favorite runs or pass concepts. For Ole Miss’s right-handed passers, Sails -- like other floods -- mostly avoided sinister targets. With all floods combined, all but three attempts were directed outside the hashes towards the right side of the field.

3. Tosser 2.93% Play Share 7.65 Y/A 53.9% Success Rate
In general, Slant Variations were some of Ole Miss’s favorite route tags on RPOs. The Tosser wrinkle, that calls for dual or all slants to one side of the formation, received a bulk of those targets. In the end, Tosser shared the Rebels top play share of their pass concepts along with Fades and Sails. But while the latter failed to put up worthy figures to justify their standings within their script, Tosser finished the season as one of Mississippi’s most successful concepts. Few looks allowed the Rebel’s to manage the chains better than Tosser. Of the concept’s 27 reps, 20 occured on either 1st or 2nd Downs. Despite being overly a down and distance manager, only All Verts averaged more yards/target among the Rebel’s five favorite pass plays.
A common tactic to help field a “winning” play is to call for one side of the formation to beat a certain zone with the backside offering a quick manbeating concept or hot route in case of pressure. Tosser was one of the Rebels’ top looks in this regard. Other than on RPOs, dual slant patterns were fairly common to see when the Rebels went five-wide. Since slants are designed to win quickly, Tosser provided a nice backside outlet to a number of plays. In an offense full of basic pass plays, at least this rudimentary design came through more often than not.

4. All Verts 2.48% Play Share 13.2 Y/A 40.9% Success Rate
While some offenses use All Vert patterns to spark explosive gains when the defense is on its heels, others turn to them when all hope
is lost and a play is needed behind the chains. Ole Miss’s offense in 2019 frequently resembled the latter. Of the 22 reps All Verts received, only three occurred on 1st Down. Despite the high degree of difficulty on these plays, both of Ole Miss’s main passers boasted Completion% above the SEC average targeting All Verts. In fact, Matt Corral’s 54.6% clip was the highest of any SEC passer with at least ten such attempts.
Since the design calls for its main options all to go straight downfield, there can be a lot of bang for buck. Add Corral’s and Plumlee’s running ability into the equation and the ante gets upped. Of SEC offenses with at least 8 targeted All Vert plays, none averaged more than Ole Miss’s 13.2 yards/attempt. While the Rebels’ 40.9% Success Rate on the surface might appear middling, only LSU was more successful on All Vert plays within the SEC this past season. Again, it can take a decent amount of variables for these passes to find their marks. All Verts were responsible for 290 total yards, which only trailed the totals the two Inside Zone Reads accumulated.

5. Ohio/Slice 2.48% Play Share 6.36 Y/A 54.6% Success Rate
While Sails were primarily off play fakes and generally took longer to develop, Ohio/Slice combos offered much of the same upsides as them while operating within Ole Miss’s quick game. This simple vertical+out combo can win versus numerous coverages and offers a straightforward read for the quarterback. Both Rebel passers found their man at high clips. Plumlee had a Completion% of 90% and Corral finished with a 73% clip targeting this look. With the overwhelming majority of these targets resulting as completions, their receivers were able to make plays after the catch, which birthed a favorable Success Rate. This concept’s 54.6% clip shared the top spot in this regard among the Rebels’ passing offense.
Slice was mainly an early down play to help manage down and distance as all but five of its reps occured on either 1st or 2nd Downs. But that’s also where their returns were rather bland. On firsts and seconds, Slice only met its situational goals on 40% of its targets. Thankfully, the concept came through on the do or die down where four of the five 3rd Down targets resulted in success. Like a good amount of their normal passing offense, it wasn’t out of the question to see this paired with RPOs or out of empty formations.
Ole Miss’s most successful looks
(min 1.3% Play Share, click on concept name for video link)
1. Q Stretch 2.70% Play Share 8.46 Y/A 66.7% Success Rate
Speed kills. John Rhys Plumlee was just the latest example to personify that maxim. This slashing outside zone play allowed the freshman passer to hit the edge and threaten flat footed edge defenders. In Ole Miss’s read heavy scheme, it wasn’t uncommon for these dudes to fall into a brief malaise. And that’s when the Rebels would run right at them. Stretches only set out to create quick seals rather than working to get to the second or third levels. Even a brief misstep can result in you being taken out of the play.
Plumlee was hard to bring down when he gained a step towards the perimeter. He averaged 4.25 yards after contact on this look. Though Plumlee was the main engine on this concept, both of Corral’s Stretches ended in success and he averaged 19 yards/carry. All in all, 42.9% of Q Stretches gained ten yards or more. Though there was basically equal distribution in terms of explosive carries looking at leftward versus rightward runs, 70% of Q Stretches went right. Occasionally, Ole Miss would flash a reverse or flair action to act as eye candy and help take the laser off their QB.
2. Play Action Boot 1.3% Play Share 6.82 Y/A 54.6% Success Rate
Since Ole Miss had a couple of mobile passers, they offered up a decent amount of their script on rollout or play action bootlegs that moved the pocket. Early on in the year, Play Action Boots were quick hit reads that gave their passers predefined reads and allowed their weapons to make plays after the catch. Boots are play action rollouts where the tight end or H-back towards the “backside” of the “run” chips before running a flat. Waggles see that player -- or sometimes a back of its a two-back set -- run a slide route across the formation. Both feature a curl or comeback on the same side where the quarterback is bootlegging along with a cross heading that direction.
Though successful, Boots’ usage faded as the year progressed for Waggle Sails. Rather than calling a weakside cross boot, they opted for a strongside sail boot. Sails, of course, ended up being one of the Rebels’ most targeted pass concepts despite subpar results. Boots and Waggles are far more basic. Yet, their simplicity yielded the best Success Rate of any pass concept.
3. Ohio/Slice 2.48% Play Share 6.36 Y/A 54.6% Success Rate
A lot of Ole Miss’s passing concepts share a common theme: a vertical route. While that was a constant, their variety manifested in other ways; largely what route was paired with that vert. All Verts (vert+vert), Fades (hitch+fade), Seal (vert+curl), Hitches (hitch+hitch), or Slice (vert+out) could be run out of any set on any snap. For certain, Ole Miss wanted to pick on people outside the number when they turned to the skies.
The Slice concept yielded the best results out of any of those rudimentary patterns. Still, this look had faults. On 1st and 2nd Downs, plays that targeted Slice only ended in success 40% of the time. If it wasn’t for a sound Success Rate on the money down, it would just be another letdown of a look. Though nothing special in terms of X’s and O’s, its a tried and true pattern that can beat a number of defensive looks. The snappy design is meant to hit the “turkey hole” versus Cover 2 or win in the flat versus single-high coverages.
4. Tosser 2.93% Play Share 7.65 Y/A 53.9% Success Rate
Slants were mostly factors when Corral was back in the gun rather than Plumlee. (JRP only connected on three of his nine passes targeted Slant Variations). Dual Slant combos -- or Tosser -- was their favorite. Ole Miss paired Tosser with Slice, Fades, Hitches, Spots, Rubs, and with plenty of run concepts to form RPOs. About a fourth of their targets were off RPO designs.
Going back to torching grandma in the backyard, slants are basic routes where the quickest player usually prevails. Against saggy zones or slow-footed DBs slants can consistently deliver adequate gains on low-risk throws. Despite a middling 7.65 yards/target, only All Verts flaunted a higher clip among their five favorite pass plays.
5. Nakie Veer 2.14% Play Share 6.68 Y/A 52.6% Success Rate
The Nakie Veer was another design that allowed the Rebels to play smart, complimentary football when they were overmatched in skill. Typical reads options only go so far to testing fronts. Though the core concept can be changed around on read options, the QB and back typically still attacked opposite sides of the center on their run paths. The Nakie Veer asks both to hit the same side and overwhelm one part of the defensive front. The power variety -- that calls for a backside guard puller towards the side of the Veer -- is a far more common version of this play. But, the Rebels proved these can work within the conference too.
This design is a mashup of a Speed Option and a Nakie Read. Like the former, it calls for an untouched read man playside to dictate who gets the ball. Most of the line will downblock against the grain and seal everyone inside. The playside tackle arcs towards a backer around the read man. The mesh point and read instructions are straight from the Nakie Read, which is an Outside Zone Read wrinkle with the QB and RB swapping paths. But again that abides by the typical run lane philosophy of one rusher per side of center unlike the Veers. Ole Miss didn’t have too many run concepts eclipse the 50% Success Rate barrier. But Nakie Veers consistently won its battles. The Rebels’ brass were prudent with this look. Still, there were games where it was heavily featured. For instance in the LSU game, Ole Miss called nine Nakie Veers while averaging 8.44 yards per pop; six of those nine tries ended in success.
Where Ole Miss’s weapons ranked
Fair or not, Ole Miss had a lot riding on its quarterbacks entering 2019. Transitioning from Phil Longo’s vertical scheme towards Rich Rod’s spread-run offense obviously was going to experience growing pains with numerous newcomers filling key roles. Figuring out their quarterback proved to be particularly tricky.
Matt Corral received spot minutes during his redshirt season and entered the year as the heir apparent for the role. The former four-star appeared poised to take the reigns of an offense known for taking the tops off of defenses. Things failed to get off the ground. No doubt his traditional numbers before his rib injury were adequate, but the potency of the Rebels’ offense was long gone.
John Rhys Plumlee instantly provided a shot of B-12 to Ole Miss. His energy is palpable and pops off the screen. Despite being a lesser passer operating in the dropback game, his athleticism and burst eventually won him the starting gig. But depending on the situation, the quarterback carousel was a common occurrence.
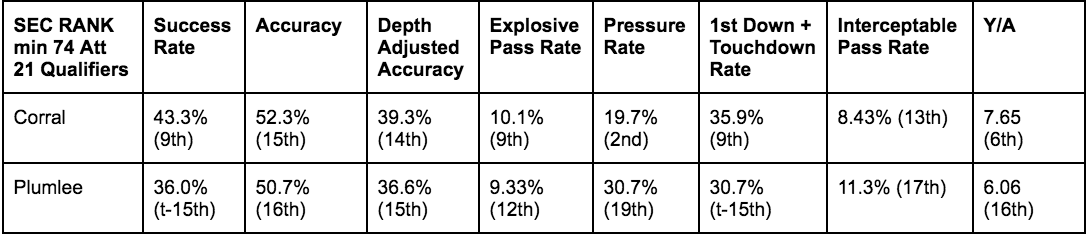
Ole Miss’s passers were undeniably cut from different cloths. Yet, both had similar outputs in a number of spots. Corral and Plumlee were adjacent in the rankings in terms of average depth of target, RPO Rate, Accuracy and Depth Adjusted Accuracy. The pair also had similar numbers facing pressure.
Corral had the quickest trigger in the conference. His average time to throw was 2.05 seconds. Naturally with less time holding the ball, it was harder for fronts to pressure him. Thus, Corral sported the SEC’s second lowest Pressure Rate. Corral cracked the conference’s top10 in terms of overall Passing Success Rate, Explosive Pass Rate. Thanks to being able to complete a decent amount of deep balls, Corral had the sixth best yards/attempt within the SEC. Still, it was apparent the young passer was still trying to find his sea legs. Sharing time with Plumlee also played a role with Corral failing to find his rhythm.
Despite the mostly pristine pockets, the Californian was overly inaccurate. Both his Accuracy and Depth Adjusted Accuracy fell within the bottom third of SEC starters. Like most inexperienced quarterbacks, Corral really struggled with his precision under duress. It’s a good thing the Rebels protected him as well as they did. No SEC passer was less accurate throwing downfield when pressured than Corral. His Depth Adjusted Accuracy was dead last and his Interceptable Pass Rate was third worst. At least most of his completions resulted in key plays. His Success Rate when pressured fell into the top half of SEC starters and his First Down+Touchdown Rate was the sixth best. But the high amount of scattershot and risky throws made Corral ride the pine more and more as the year progressed.
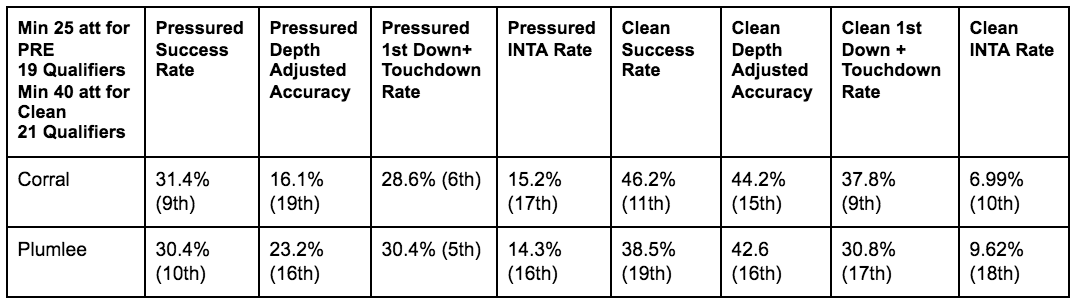
He certainly was a dynamo in the run game, but Plumlee rarely resembled a competent passer during his freshman campaign. His overall splits were worse across the board than his counterpart. Essentially every metric saw him place among the bottom half of conference quarterbacks. Even operating from clean pockets failed to generate favorable figures. Plumlee was bottom five in Clean Passing Success Rate, Depth Adjusted Accuracy, First Down+Touchdown Rate, and Interceptable Pass Rate. Those aren’t marks for which to be excited about moving forward when evaluating his sustainability at the position.
Even though he only took a beat longer on average in terms of time to throw, Plumlee faced far more pressure than Corral. While Corral had the second lowest Pressure Rate, Plumlee owned the SEC’s third highest. When bullseyed, Plumlee’s production barely edged out Corral’s. Still, I am not going to act like it was a major upgrade in the slightest. Despite a top10 Success Rate and 1st Down+Touchdown Rate, Plumlee consistently offered toss ups as he finished inside the SEC’s bottom five in terms of Depth Adjusted Accuracy and Interceptable Pass Rate when under pressure.
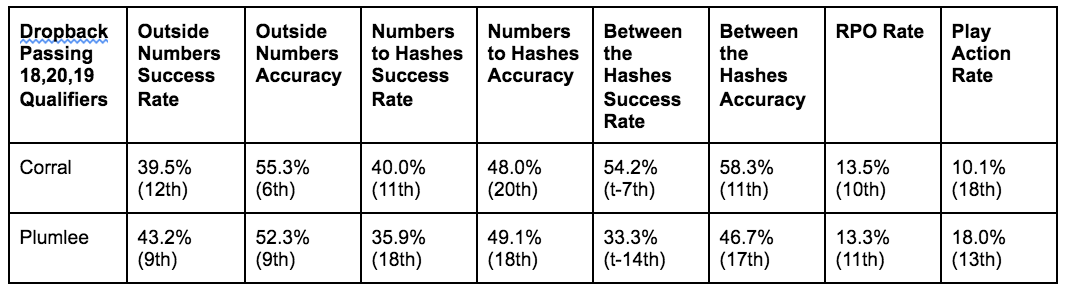
Stripping away screen and RPO attempts, we can get a more clear picture of how effective each passer was on their dropbacks. Newsflash: both still weren’t anything special.
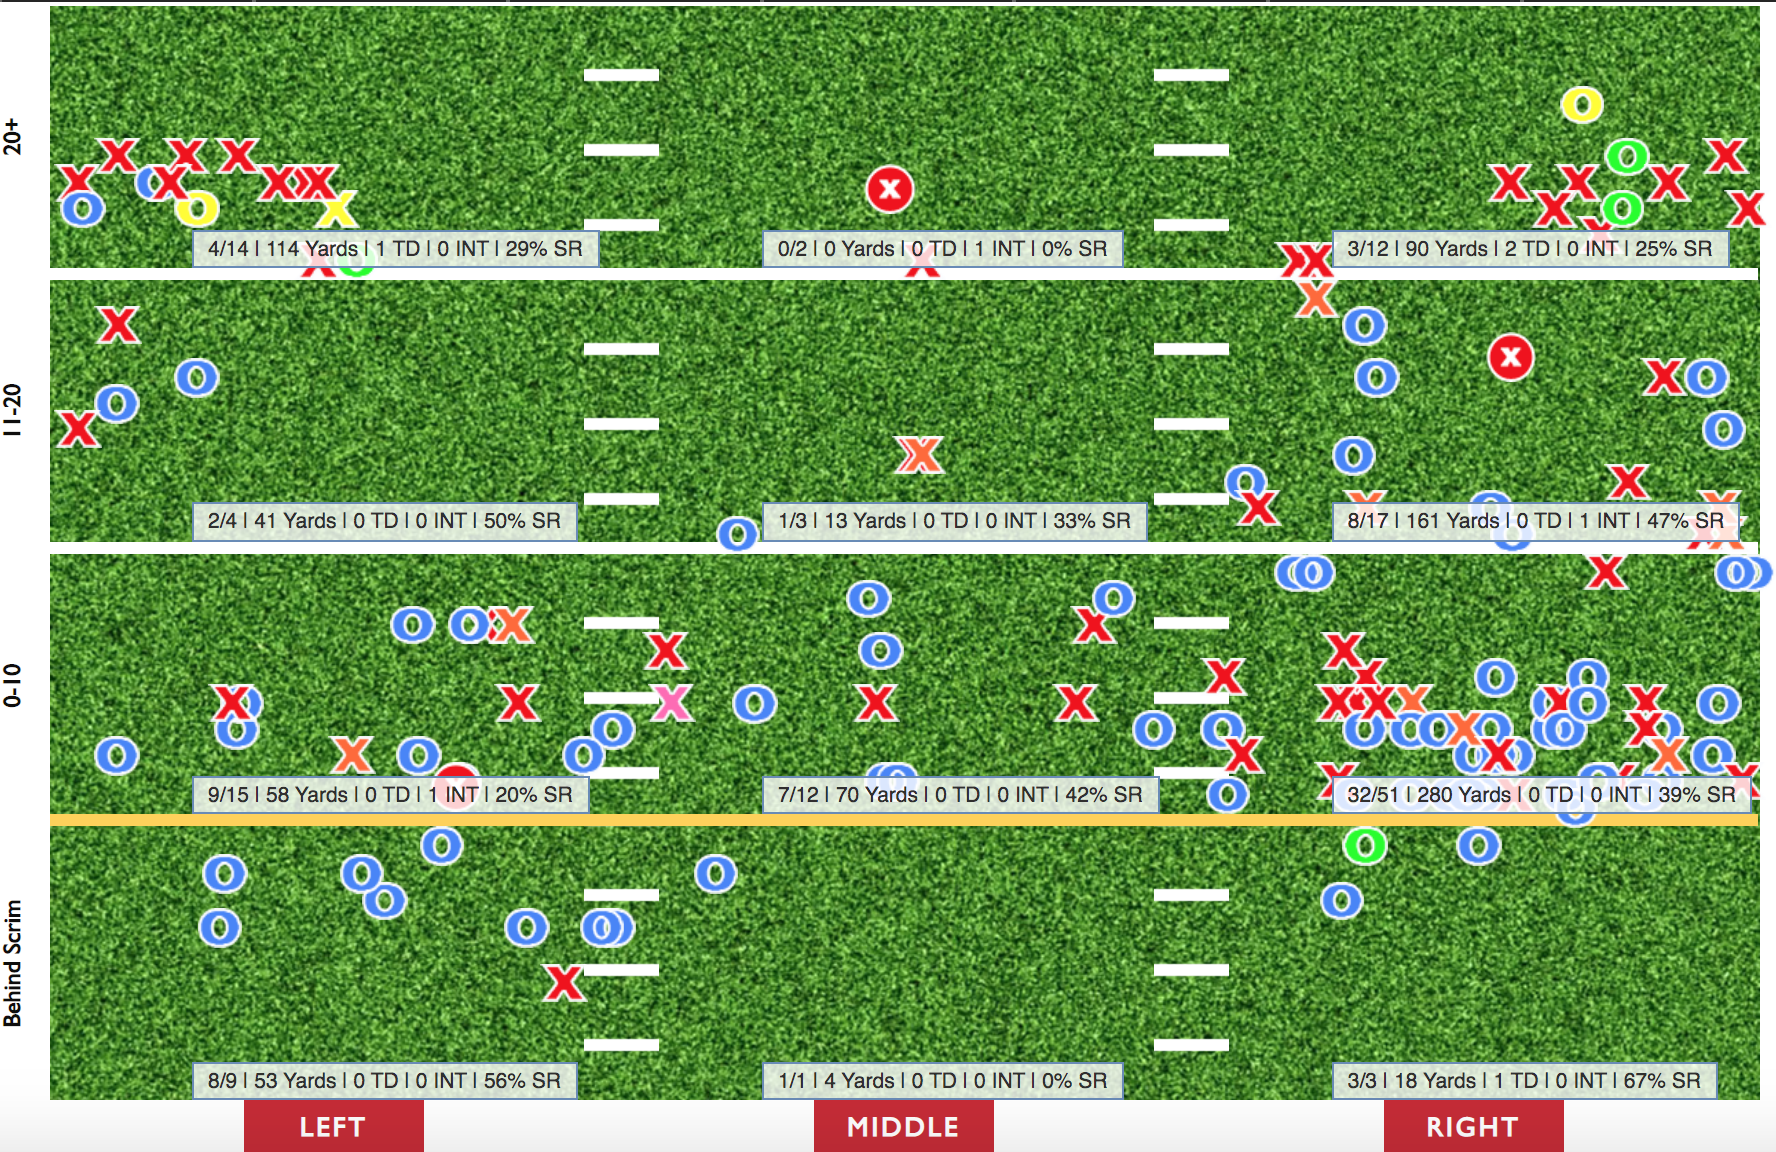
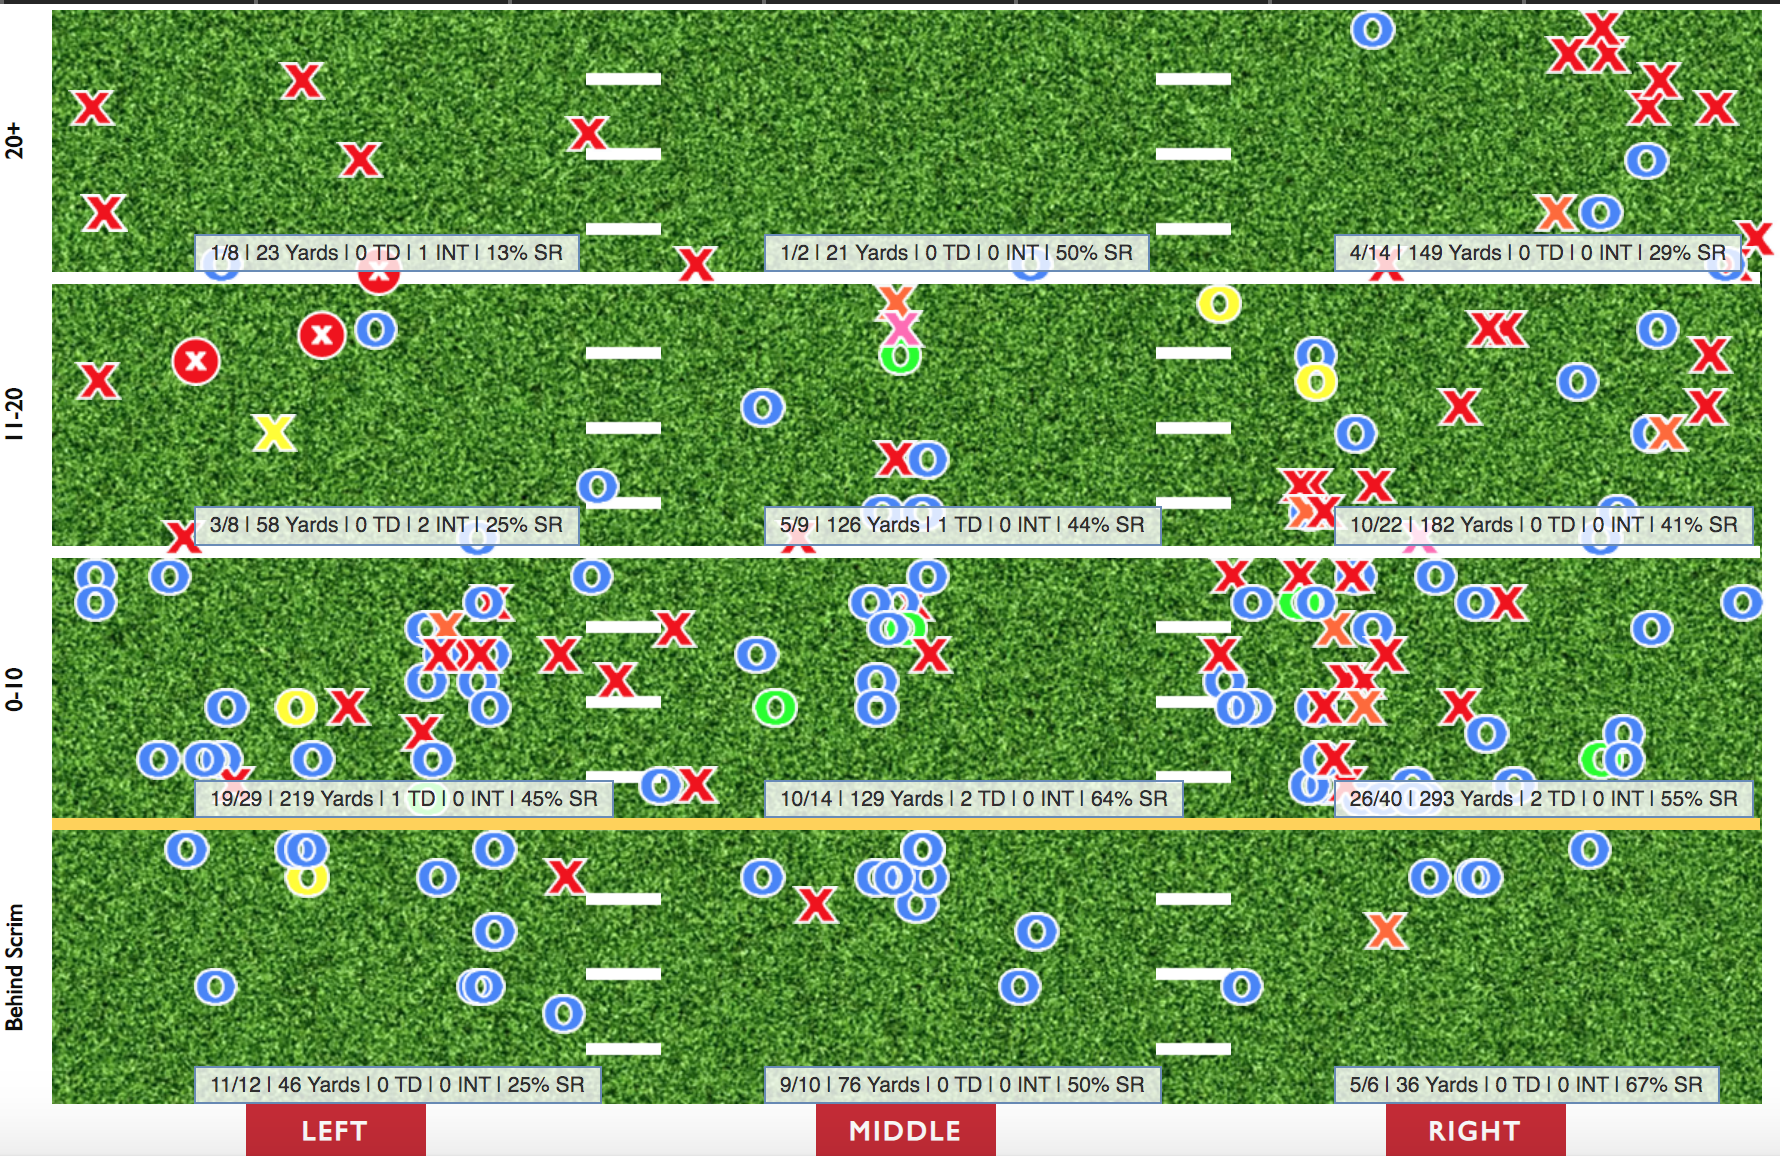
Inside the numbers, Plumlee was one of the worst throwers around. As you can see from his Pass Chart (below right), his dudes dropped a decent amount of balls. But there's no denying his dip in accuracy. With tighter windows and more defenders, it was difficult for the slight Plumlee to connect with his targets. Targeting his receivers outside the numbers where his vision was less obstructed yielded his best returns despite these throws often being “longer”. Plumlee was average in that area of the field by SEC standards. Still compared to being a bottom5 performing, that’s an upgrade.
Per his Pass Chart (bottom left), Corral’s best area was the middle of the field. In terms of ranking within the conference, his Accuracy outside the numbers was his strongest attribute. But his clip between the hashes was better overall. Since it was the place where he was his most accurate, Corral was able to see a good amount of success. His 54.2% Success Rate targeting receivers between the hashes shared the seven spot within the conference. Corral was below average in that regard in the other two sections with his attempts. His accuracy from the numbers to the hashes were particularly dreadful. No SEC passer this season was worse than him there.
With a new staff and scheme in place for 2020, this offense is set to take on its third form in just as many seasons. Knowing Lane Kiffen, the Rebels will probably get back to passing the ball more. Positives exist for both young passers, but expect more growing pains before substantial on-field improvement is seen.
Though Corral and Plumlee kept jockeying for playing time, there was no doubt who the Rebels’ number one receiver was. Elijah Moore was the only Ole Miss player to garner over 40 pass targets. In fact, only LSU’s Justin Jefferson and Ja’Marr Chase finished with more targets within the SEC than Moore. His 116 were 85 more than the next closest teammate. That translated to Moore’s skyhigh Target Share, which easily led the SEC. No other SEC player broke 29% and there he sat with a 36.5% clip. Quite simply, this massive unbalance favoring Moore came down to trust. With a bunch of inexperience within their ranks, Moore presented their most veteren presence and tested acumen...as a sophomore.
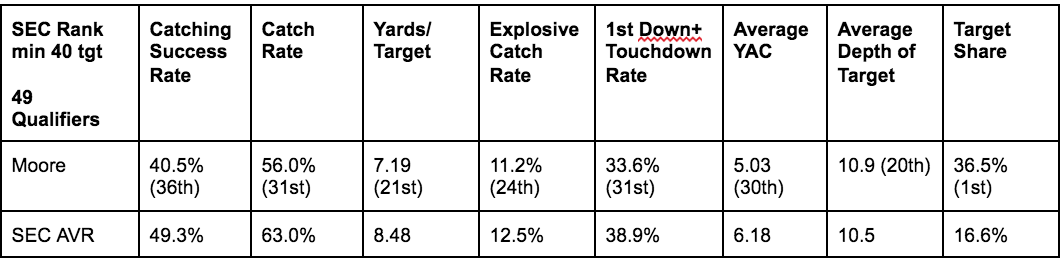
Moore mostly operated from the slot. But again since he was their do-it-all receiver, he was thrown passes all over the field. Thanks to Rich Rod’s desire to play to the handedness of Ole Miss’s passers, 60 of his 116 targets occurred on the right side of the field. Taking a step back and evaluating his numbers, he was clearly below average analytically. Despite being top8 within the conference in catches and receiving yards, his play left much to be desired.
As you might be able to surmise, Moore was also the Rebels’ favorite target on key downs. He was the only one of their outlets to see over five Red Zone tries. Plus, he led the conference in 3rd Down targets with 36. Like his overall Target Share, his figure on the money down also was tops across the SEC. While his overall Success Rate was decidedly subpar, his clip was even worse on thirds. Only a quarter of his targets resulted in success and he placed within the conference’s bottom10 in this regard. Octavious Cooley and Jonathon Mingo were the other Rebel receivers that saw at least 10 3rd Down Targets. While Mingo represented the conference’s floor, Cooley walked off with a top10 Success Rate on the do or die down with a 54.6% clip.
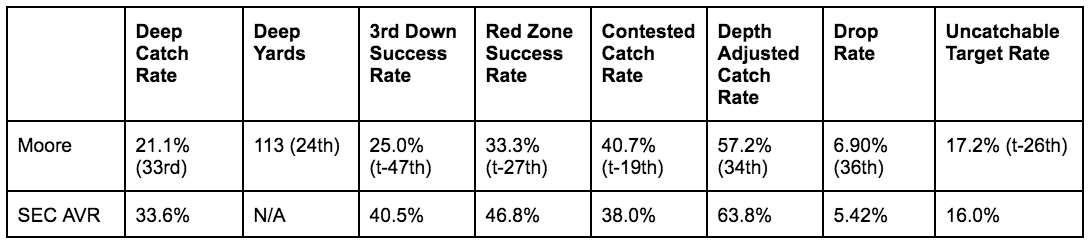
Only six SEC players saw more deep targets than Moore. But the ample chances didn’t result too much. His 113 yards off targets 20 or more yards downfield ranked 24th within the conference. Now you might be thinking: “Well, the quarterbacks probably sucked and threw too many balls out of his reach.” That’s partially true as about a third of his deep targets were “uncatchable” by our count. Still, that’s roughly around the conference average. Moore only hauled in four deep targets this season on a lousy 21.1% Catch Rate.
Winning on contested targets and in tight window chances upfront don’t sound strong suits for the 5’9 185 pounder. But the spry Moore scrapped his way to respectable numbers on these chances. His Contested Catch Rate of 40.7% fell into the top half of SEC players and his Contested Success Rate finished 13th. Every one of Moore’s contested catches resulted in success. Ironically, Moore’s 40.7% Success Rate in these spots trumps his overall clip. Less than a quarter of his targets were contested, which was one of the lower rates within the conference.
Tunnel offenses generally don’t birth efficient results. Ole Miss was no exception. Since no other Rebel players saw north of 32 targets, evaluating their play is a bit more dicey than someone with Moore’s sample size. That said of the ten players that saw at over ten targets, six had higher Catching Success Rates than Moore.
As hinted above, Cooley was largely their most successful option. Nearly 77% of his catches earned a conversion and his 60% Success Rate led the team. As an underneath outlet with the vast majority of his targets being on flats or hitches, Cooley was a nice safety valve. Jerrion Ealy was the only other Rebel player with at least ten targets to break the 50% Success Rate barrier through the air. His chances were screens and checkdowns, but they proved to be the right decision for Ole Miss’s passers all else considered. The team’s second leading receiver in terms of yards, Dontario Drummond struggled to make the most of his first season of extended snaps. He caught less than half of his targets. Despite his size, he failed to win downfield. Of the SEC players with at least six deep targets, he was the only one who was held without a catch (four of those six chances were uncatchable). Mingo, Tylan Knight, and Braylon Sanders failed to distinguish themselves. With the other receiving options offering little solace, Moore was force fed.
Moore still dropped an alarming amount of passes. Nearly 7% of his targets resulted in such, which easily placed him among the bottom15 within the SEC. Due to Moore’s overall shortcomings as a deep receiver and his frequent butterfingers, his Depth Adjusted Catch Rate fell into the conference’s bottom third.
While the Rebel passing offense had a clear cut favorite, their run game attempted to spread around the wealth. Four players received at least 80 designed carries with three breaking into the triple digits. But as the year progressed, Plumlee emerged as their bell cow. The undersized freshman passer was clearly bad throwing the football during his first campaign in Oxford. But in case you haven’t noticed, the kid can skoot.
Entering the year, Scottie Phillips was looked to anchor this offensive transition. In Longo’s scheme, Phillps ended 2018 as one of the conference's most efficient ball carriers. Thanks to AJ Brown, DK Metcalf, and Ole Miss’s passing game receiving the bulk of the attention, Phillips was able to consistently gain chunks of yardage. His 53.3% Success Rate and 36.8% First Down+Touchdown Rate were both top10 clips within the SEC last year. But with more attention as the lead back in 2019, Phillps failed to maintain his efficiency with his carries.
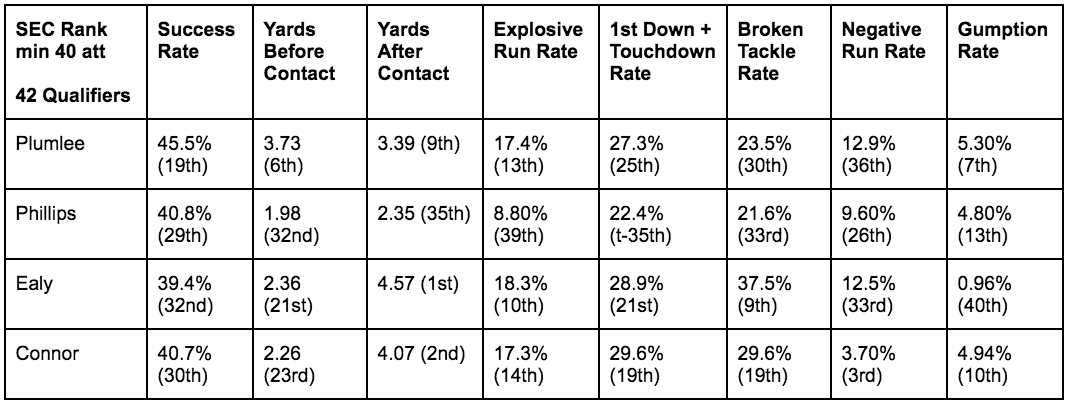
Phillips was largely neutralized. Though down-to-down he was the Rebels’ “most successful” rusher, his analytics failed to build off the foundation he set last season. As the engine for this offense coming in, teams knew Ole Miss’s already fledgling passing game would struggle even more if their run game was eliminated. With the bullseye on his back, Phillips easily had the worst yards before contact average of their main ball carriers. Year over year, his figure shrunk from 2.76 to 1.98 yards.
To make matters worse, Phillips remained as easy dude to bring down. While ranking 32nd in the SEC with a 19% Broken Tackle Rate last year, he followed that up with a 21.6% clip this year that also fell in the bottom third of conference ball carriers. Since his chances faced early adversity and he was never the back to excel squirting out of tackles, Phillips was largely Ole Miss’s least efficient rusher. Though his Success Rate edged out the two upstart freshman, his yards after contact average, Explosive Run Rate, First Down+Touchdown Rate, and Broken Tackle Rate all were bottom10 within the conference. Health was certainly a factor. A few lower body injuries kept lingering and flaring up as the season progressed. Though he ended the year second on the team in total designed rushes, his yards/attempt was basically 2 yards worse than the next Rebel runner with at least 40 touches.
After the first month of the season, Phillips only saw two games the rest of the year surpass a double digit carry load. The Texas A&M game was the last time he led the team in carries. That was because Jerrion Ealy and Snoop Connor smelled the blood in the water. Each started to seize more and more snaps after the first four games. With fresh legs and skill sets meant to win in space, both proved far better rushers through contact. By the time
Their rise also coincided with the emergence of Plumlee. Though I’m generalizing, Ole Miss basically ran a watered-down version of its stuff under Longo. It was a streamlined script consisting of only a handful of plays -- the vast majority were the Rebel’s bread and butter Inside Zone Reads. During the first month of the season, nearly 40% of the Rebels plays consisted of either a Slam or Bluff Read. Plumlee’s pluckiness and dynamic playmaking forced Rich Rod to get more creative in order to move the ball on the ground.
Plumlee’s one-dimensional playing style shoehorned Ole Miss for how it was going to play for the remainder of the year. The Rebel’s passing game remained basic in order to not overwhelm their green passer, but the run game started to see new life. In addition to Inside Zone Reads, Tackle Counters, Power Reads, and QB designed runs flooded their script down the stretch. Over the course of Ole Miss’s last four games, no one topped Plumlee’s 68 carries.
Thanks to his speed and ability to win in space, he ended the year as the team’s leader in Rushing Success Rate and yards before contact. Like most quarterbacks, he wasn’t the best at breaking tackles; but there was no questioning Plumlee’s grit. If a defender was slow filling a lane or lollygagging chasing him down, Plumlee never slowed up. After all, he was in rare company with both his before and after contact clips finishing within the SEC’s top10. Plus, his Gumption Run Rate -- or percentage of designed carries where initial contact with the defense is behind the line of scrimmage but a positive gain was ultimately made -- was tops for the Rebels and one of the best in the conference.
While Plumlee morphed into the de facto bellcow, Ealy soon led their backs in touches. The two were the only Rebels with double digit carries in each of Ole Miss’s last four games. Though he ended the year as their least successful rusher, Ealy was their best breakaway threat. A number of big gainers were the result of Ealy shedding a would be tackler in the box before he turned on the jets. Despite being a freshman, his Broken Tackle Rate and Explosive Run Rate cracked the conference’s top10 and no one averaged more yards after contact than him. Hell, he averaged a half yard more than the next closest man -- who just happened to be Connor. No doubt, Ealy was all or nothing.
Connor showed promise, but his freshman campaign was largely forgettable. Sure, he boasts the SEC’s second best yards after contact clip. Yet he only had three games with at least ten carries. Despite an overly middling year, Connor did a fantastic job of eliminating negative runs. His Negative Run Rate of 3.70% was bested by only two others within the SEC and his Gumption Run Rate finished inside the top10.
2020 Vision
For the third time in just as many seasons, Ole Miss will have a new offensive play caller. The general consensus appears to have the Rebels shifting back towards the skies to fuel their offensive tactics, which leaves plenty of uncertainty with its current roster construction. Plus, two of its magnetic freshman are currently taking cuts on the diamond. Plenty of events could arise this spring that could affect the Rebels’ depth chart.
Still, it fairly apparent Ole Miss played with the big boys in recent years thanks to its ability to dropback. Historically, the SEC was a running conference. But the offenses that keep making significant gains are the ones going pass happy -- for the most part (there’s always an Arkansas or South Carolina out there). Lane Kiffen offenses generally abide by this new age thinking.
Before being top10 in 2017 and 2018 in the S&P+ metric, Ole Miss’s offense plummeted to 68th this season. Offense is Kiffen’s “thing” but he never got the Owls to take the next step on that side of the ball. In his three seasons in Boca Raton, his units have finished 30th, 49th, and 46th, respectively. In that range, I’m not sure the Rebels will be equipped to make much noise in the SEC West unless it’s defense follows suit.
When Kiffen took the Florida Atlantic job, the Owl’s defense went from 89th in the S&P in 2017 to peaking at 38th this past season. Under Luke, the Rebel defense was a constant headache. Though it improved to its highest level in four seasons in 2019, donning the 42nd best unit nationally won’t win too many contested battles in the SEC West.