Sideline to Sideline: Auburn 2019
The last decade has seen the SEC West become the most challenging division in college football. A missed block here or a flubbed field goal there can be the difference between 7-5 and 10-2. You don't need me to tell you Auburn is a pretty tough gig. This year alone, half of the Tigers' schedule was against ranked foes.
Gus Malzahn, facing the building pressure on the Plains for better on-field results, got back to calling plays for his offense. Though his offense faced a fair amount of uncertainty, his defense provided him solace to coach his unit loose and natural. That side of the ball would dictate how the season would end one way or another despite Malzahn's presence tricking people the Tigers were an offensive-driven team.
With a freshman quarterback seemingly bred from birth to be the perfect fit for Malzahn's read option scheme, War Eagle could lean into what Gus wanted to do first and foremost: play fast and play physical. Sure, the results were rather middling. But there were plenty of positives for this program moving forward.
Auburn at a Glance
Gus Malzahn's offenses at Auburn have always been about space and pace. His no-huddle spread scheme riddled with Run-Pass Options helped reinvigorate Auburn's program and modernize offenses across the southeast. While most of his schemes are still effective, his competitive advantage isn't what it was a decade ago. Every one in the SEC now uses RPOs in their everyday offense. Tennessee was the only offense with a RPO Rate under 10% this past season within the conference. With the "modern day triple option" becoming more commonplace, defenses have become more keen on coming up with ways to meddle with reads or disrupt these designs meant to stress defenses sideline to sideline.
Entering 2019, Malzahn confirmed he would be calling plays once again for the Tigers. With a offense that was stalling and playing below expectations, he wanted a more hands-on approach to dictate his unit's operations. Seemingly incessantly on the hot seat due to the competitive nature of his job, Malzahn was prepared to go down swinging on the Plains playing his style. Malzahn didn't pump the breaks calling RPOs. Only Ole Miss ran more RPOs this year within the SEC than Auburn. Just under a third of all of the Tigers' plays were RPOs.
Not only did calling more RPOs help the Tigers get back to their roots of wanting to play 100 miles per hour, but they helped put their freshman quarterback in positions to win. Asking Bo Nix to dropback and pass 35 times a game never would have ended well. Eighteen year olds are rarely ready to hit the ground running in college football; especially in the SEC. Malzhan had to undertake a balancing act. He needed production and a threat of a even attack, but he couldn't overexpose Nix to the elements. The result? The legacy passer finished the season by throwing more on RPOs than anyone else in the SEC.
By volume, no one else topped his 91 attempts. By rate, no one surpassed his 24.1% clip. Think of it this way, Nix averaged 29 passes a game in 2019. About seven of them a game were RPO throws on average. As far as playing successfully goes, RPOs drastically aided Nix's output. While his yards/attempt decreased due to the conservative nature of those predefined route tags, Nix had a Passing Success Rate of 54.9% on RPOs, which was the sixth best clip in the conference. Even in games against SEC competition, over half of these attempts were successful.
That volume would not have come if defenses didn't greatly aim to stifle Auburn's ground game. He was just executing the offense by attacking the most vulnerable part of his opponent's alignment or coverage. While his throws were not really impressive, he made the right decision more times than not, which resulted in a favorable Success Rate.
While RPOs saw Auburn's run game get slightly worse in terms of Success Rate (RPO runs sported a 44.3% clip versus a 45.9% clip from carries not off RPOs), Auburn averaged over half a yard more on these ground chances with a quarter of a yard more before contact. Even as conference foes made these carries less successful down-to-down, Auburn managed to keep its yards/attempt off RPOs the same before and after contact. Yinging to that yang, RPO throws also yielded a 5.6 clip. But distributing to an outlet in space resulted in a substantial uptick in terms of success. While Auburn's Passing Success Rate on "dropback" passes -- or all passes that weren't either a screen or an RPO attempt -- was a meager 36.7%, RPO throws produced a 57.3% clip.
Early on, Malzahn seemed okay to let Nix rip it. During the first six weeks of the season, no SEC passer had more than his 32 attempts that traveled 20 or more yards downfield. Sure, Nix still was fed one of the highest rates of RPOs in the conference, but he relished taking shots. During that span, Nix had the 3rd highest Explosive Pass Rate in the SEC with a 13.8% clip completing 40.6% of his deep attempts. Despite hitting on his shots, Nix was a bottom five SEC passer in terms of Depth Adjusted Accuracy and Success Rate after the first six weeks of 2019.
From Week 7 on, the offense constricted a bit mainly because Nix failed to hit on these passes as much. Over the course of Auburn's last eight games, Nix had 28 attempts over 20 yard downfield, but he completed only nine of them. Defenses were prepared to leave Auburn's wideout's on islands outside the numbers preferring to take away run lanes instead. Auburn's offense noticeably became less explosive. As far as Nix goes, his 13.8% Explosive Pass Rate from Weeks 1-6 shrank to 6.67% from Week 7 on. Even Kentucky's wide receiver turned quarterback Lynn Bowden had a better clip than that down the stretch.
While the deep ball mostly faded after the season's midway point, Nix kept improving in other ways. With a steady dose of RPOs and being given an otherwise manageable play sheet, Nix's Depth Adjusted Accuracy, Success Rate, and Interceptable Pass Rate all improved despite his Explosive Pass Rate essentially being cut in half.
RPO gains can be consistent but they can also be minimal at times. While pairing them with a rapid pace can quickly wear out fronts that could lead to more mistakes on their part, explosive gains didn't come at a desirable rate for this offense. This resulted in more plodding, ball control drives from the Tigers. The yards came but not efficiently. Auburn's offense averaged over 400 yards. Yet, the Tigers' 5.66 yards/play average ranked fifth worst in the conference. While the passing game manufactured a number of big gainers, the run game provided few breakaways on a per play basis. Despite averaging one of the best clips before contact and boasting the second best Run Havoc Rate in the conference, War Eagle had the SEC's third worst Explosive Run Rate - or percentage of runs that gained ten or more yards - at 14.4% . While their Explosive Pass Rate was in the SEC's top5, overall Auburn was below average. Their 11.8% clip finished 9th inside the conference.
In terms of overall down-to-down success, Auburn was ordinary. All three clips of their Overall, Pass, and Rush Success Rate placed 7th within the SEC. Of course, this offense played better against its lesser foes; most do. And yes, Auburn's Success Rate versus conference foes was considerably lower than their clip against non-cons. In terms of where they ranked relative to the rest of the conference and their schedules, Auburn's Success Rate in-conference this year was 40.2% compared to 47.4% in the games against non-SECers. Both placed smack dab in the middle. Auburn's drop wasn't a prominent as other SEC offenses. In fact, their 7.2 margin between the two clips was the conference's sixth highest. Georgia's 12.5 margin took the cake in that department this season in case you neglected to noticed that offense's slide after Week 7.
Auburn was one of the most run heavy attacks in the SEC this season. War Eagle fans should be quite aware of how his offenses like to pound the rock. Only Ole Miss and Kentucky's Lynnsanity offense ran the more on average than the Tigers. Still, their overall Run-Pass ratio was closer to 50% than what you would expect.
Naturally, they preferred to start series running the ball. On 1st Downs, Auburn turned to the ground on over 60% of their plays. The returns were mediocre both in terms of yards/carry and Success Rate relative to the rest of the conference. As aforementioned, RPOs were a big part of this offense. They were their most frequent on firsts for the Tigers. There, RPOs composed over 45% of Auburn's plays. Furthermore, over 40% of Nix's 1st Down attempts were off RPOs -- the highest clip in the conference by five percentage points.
Due to this style of play, 1st Downs were when Auburn's offense was its most muted. Sure other looks saw an occasional rep every now and again, but Malzahn streamlined six plays to make up his offense to start a set of downs. Inside Zone Slam and Bluff Reads along with their RPO outlets, Tackle Counter Reads, TE-Iso Reads, and the Slice concept composed about 55% of Auburn's 1st Down plays. No other SEC offenses' six most called plays in those spots had such a high play share.
While RPO usage to start series helped Auburn's Passing Success Rate post its best clip of any down, it also lowered Nix's average depth of target and Air Yard Composition. Both fell into the bottom five within the SEC on firsts. Auburn's Explosive Run and Pass Rates also fell into that range on firsts. From a far, the mentality of Malzahn's play calling seemed to be content to set up third downs. Nearly 68% of their early downs resulted for a conversion, which was below the conference average and ranked as the seventh highest.
Its a risky game living and dying on the money down. But, War Eagle sported the SEC's fourth best Success Rate on 3rd Downs. Like virtually all offenses, Auburn did turn to the skies more in these spots but still possessed a bottom five pass rate. Auburn sported the SEC's third best Rushing Success Rate on the money down with a 59% clip. Coincidentally, War Eagle averaged the 3rd lowest distance to gain (3.1) on their 3rd Down carries within the SEC. All three of the conference's most successful rushing teams on thirds all averaged the three shortest distances to gain.
Auburn's passing game, however, was rather ordinary on thirds. Exactly a third of their aerial attempts resulted in a conversion, which was right at the conference average. In those spots, Nix essentially met expectations as his average distance to gain was precisely the conference average at 7.81 yards.
A typical trait of Malzahn's offenses is ample use of motions. Acting as eye candy or threatening the perimeter, jet motions in particular were utilized at the highest rate in the SEC. While an average SEC offense only incorporated jets on 6.2% of snaps, Auburn used them on 17.3% of their offensive plays. Another 15.7% of their plays used ordinary pre-snap motion to alter to formation. Plus, Auburn's 22 shifts this season were far and away the most in the conference.
Despite the bland output down-to-down, Auburn was one of the conference's best at scoring plays. On a drive-by-drive basis they were -- again -- very average in terms of Scoring Rate, but their Touchdown Rate of 5.45% was fourth best in the SEC even though Auburn averaged the second most plays/game. Yards don't mean squat if they do not lead to points. Any any given snap, Auburn could go the distance, which helped ease the pain of the other glaring mediocre analytics.
You know what else helps ease the pain of a middling offense? An top-level defense. While the Steele Curtain faded a little bit down the stretch as far as the archaic Total Defense and Scoring Defense metrics are concerned, Auburn still finished Top30 nationally in both. When up against conference foes, Auburn was essentially top5 across the board. They owned the second best Defensive Success Rate (36.5%), Run Havoc Rate (28.9%), and Takeaway Rate (3.02%). They owned the third best yards/play (5.16), Explosive Play Rate (10.7%), and Pass Havoc Rate (15.5%). No one topped their Three-and-Out Rate forced. A remarkable 47.5% of Auburn's defenses drives against conference opponents resulted in a forced punt after three plays.
Even though both Auburn's average rush yards allowed before and after contact were outside of the SEC's top 4 against conference opponents, Auburn claimed the best Success Rate defending the run. The margin from Auburn's own Rushing Success Rate and what their defense allowed to conference opponents is the third highest in the SEC only behind LSU's and Alabama's. The only areas where Auburn had a negative margin was in average rush yards after contact and Pass Havoc Rate, which was greatly influenced by their Pressure Rate.
Winning on first and third downs fueled this success versus SEC foes as both were top3. You want to win 1st Downs because they're the most common. You want to win 3rd Downs because they can get you off the field. It's not overly complicated. LSU was the only other SEC defense against to sport top3 Success Rates on those downs when facing SEC opponents.
Auburn's favorite run looks
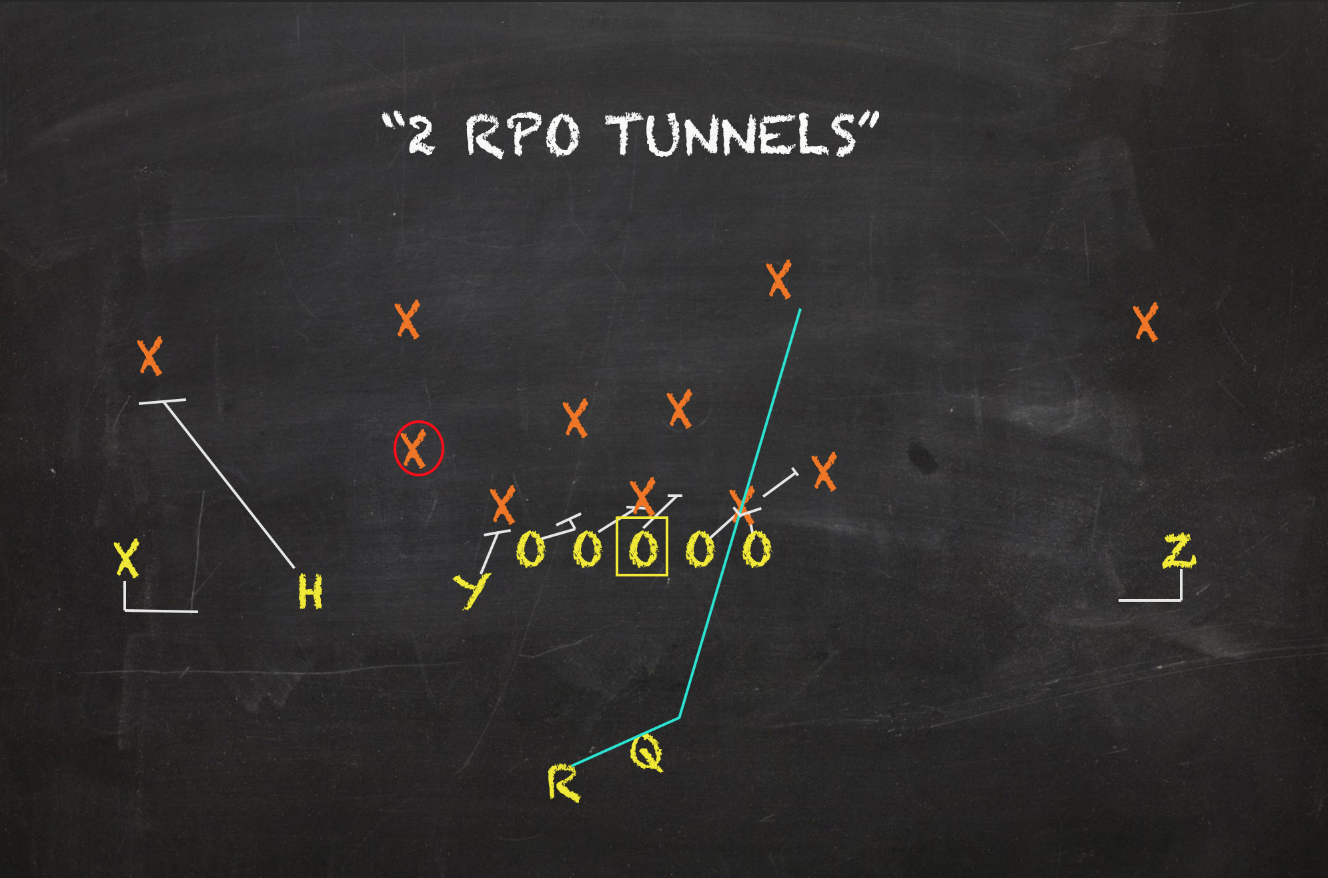
1. Inside Zone Slam Read 17.8% Play Share 4.87 Y/A 45.5% Success Rate
Inside Zone Reads are often the base run concepts in Run-Pass Option. While you can still run your read stuff from power looks, key defender's and the order of operations are more cut and dry with zones than gap schemes. We label our ordinary inside zones as "Slams". Zones call for a coordinated flow towards the playside hole looking to create creases or alleys. So for a team that called RPOs on essentially a third of their plays, seeing Slam Reads dominate their script shouldn't come as a surprise. Far and away Auburn's favorite concept, no other look owned at least a 7% play share this season for War Eagle.
Like I mentioned in the Glance section, 1st Downs were where RPOs and other read options were called the most. Over the course of the season, 97 Slam Reads saw reps on firsts (the next closest concept were outlet screens with 38). Despite the love Auburn's space and pace offense gave this look to start series, they put up their best numbers on those downs. On 1st Downs, Slam Reads posted a 40.2% Success Rate with its yards/attempt dipping to 4.77. But while they may have stumbled or stalled on early downs, Slam Reads were Auburn's second most successful play on the money down. Over 71% of the look's 3rd Down tries ended in a conversion.
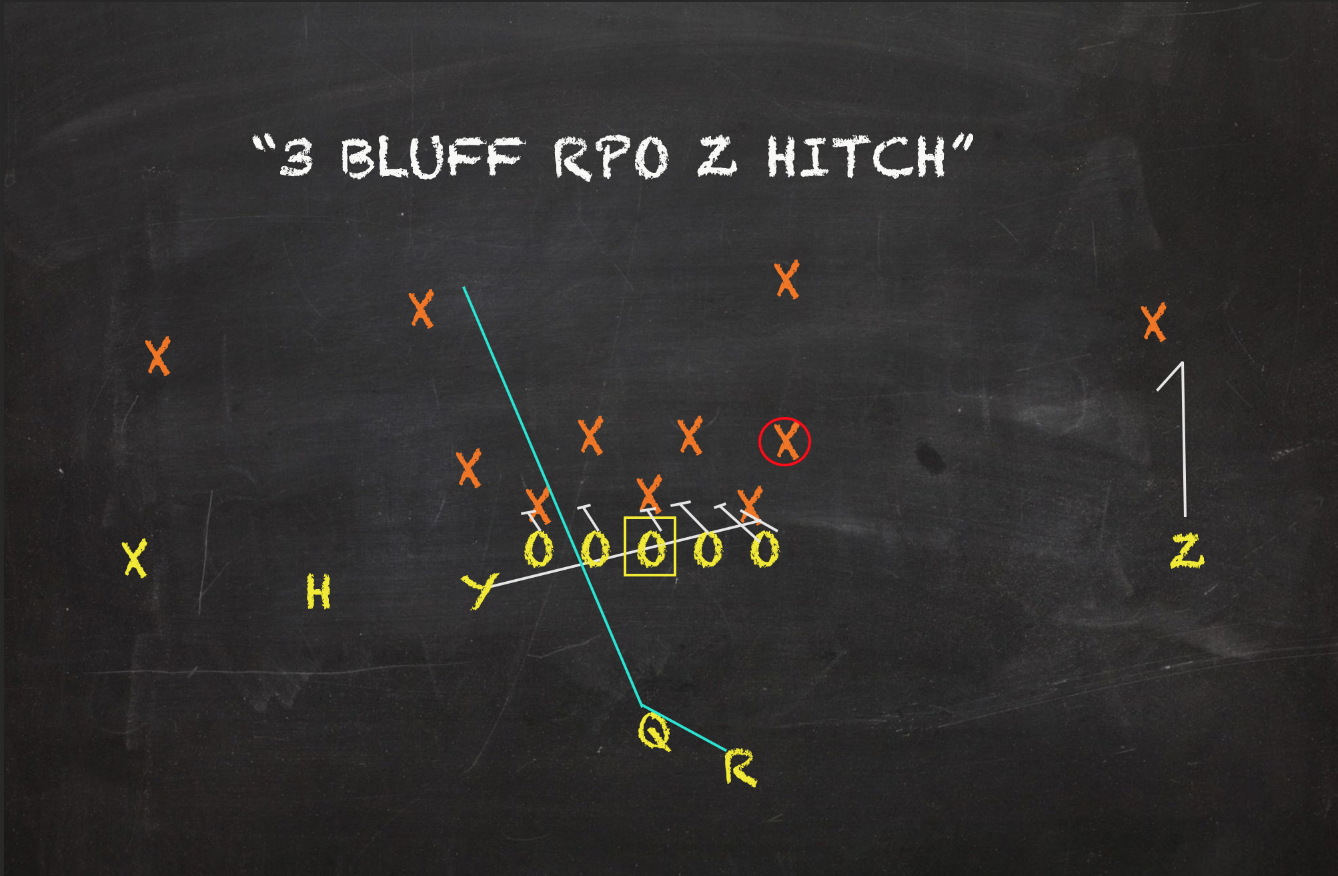
2. Inside Zone Bluff Read 6.84% Play Share 5.72 Y/A 59.4% Success Rate
Inside Zone Bluff Reads are next in the pecking order. Bluff -- or split zone -- Reads were one of Auburn's best concepts this past season. While owning the second highest play share at 6.84%, Bluff Reads posted the third best Success Rate of any concept that received regular reps. Though basically blocked the same way as Slam Reads, Bluffs call for one key difference. The offset tight end or fullback will fire against the grain of the zone flow and seal the backside end man. This accomplished two things. First, it creates a hard cutback alley should the the playside zone get stuffed. And second, should the quarterback choose to pull the read and keep it, he doesn't have to hit the edge exposed and without a blocker. It's very common for this edge setter to become a personal protector in the open field. Since Nix was giving more protection, he felt more inclined to keep chances on this concept than on Slam Reads, which greatly influenced the look's 59.4% Success Rate.
When both Slam and Bluff Reads were combined, no Auburn ball carrier with at least ten tries on those looks had a higher Success Rate (63.6%) or yards/attempt (5.88) than Nix. All three Auburn's main backs had Success Rates in the mid-40's. Defenses honed in on War Eagle's run game between the tackles; particularly their bread and butter Inside Zone Reads. When these carries went inside, Auburn averaged only 4.13 yards/attempt on a 44.6% Success Rate. But if the backs were able to get outside or if their QBs kept it, the Tigers averaged just under 9 yards per pop and a 68.1% Success Rate.
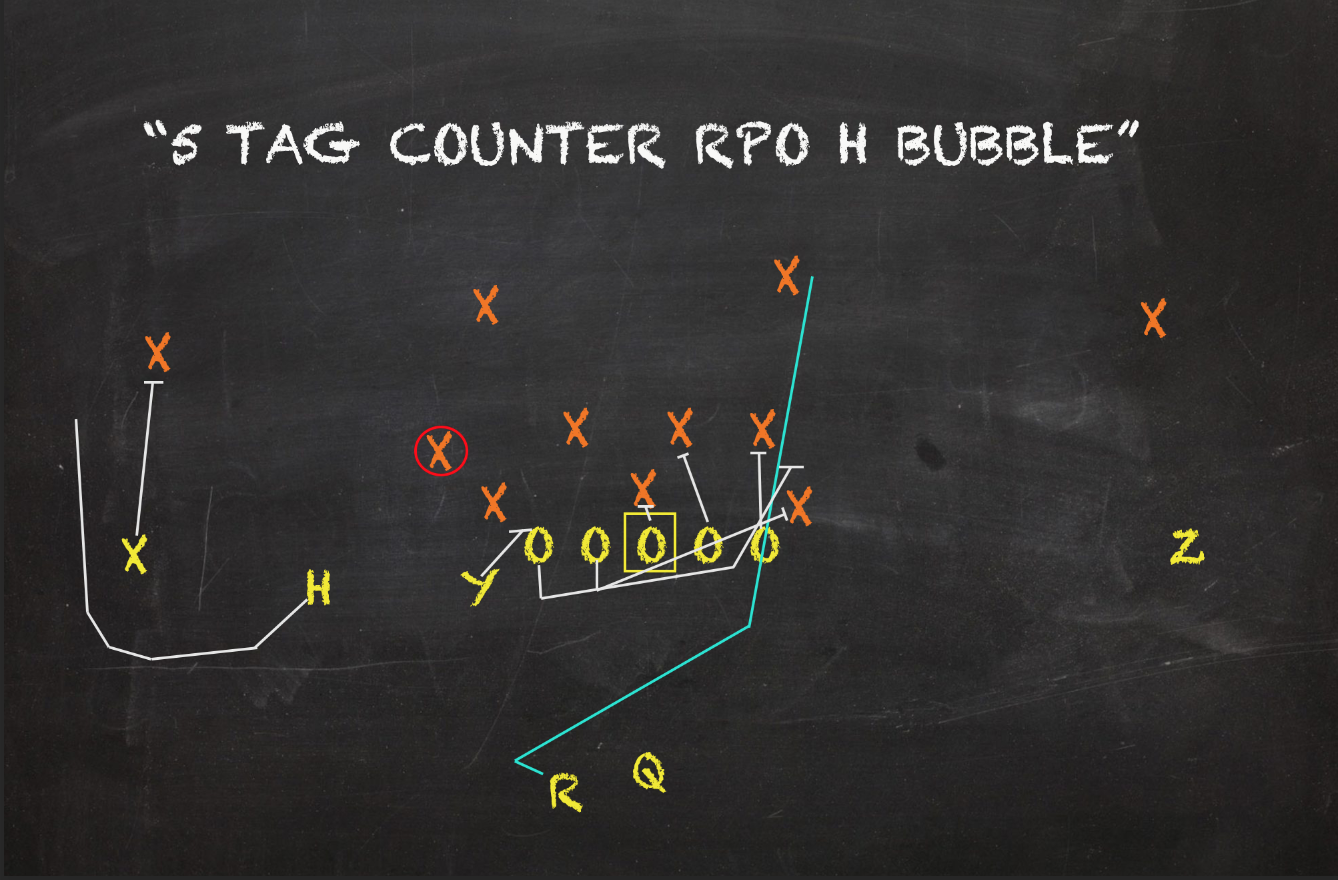
3. Tackle Counter Reads 5.02% Play Share 6.38 Y/A 42.6% Success Rate
While clearly Inside Zone Reads were their go-tos on the ground, Auburn featured a number of Power Reads into their script. The one that was featured the most was the Tackle Counter Read. Like on normal Counters, Tackle Counters call for two lead blockers after the line initially sells some misdirection. They still ask the backside guard to be the "trapper" -- or edge setter. But, Tackle Counters call for the backside tackle to act as the "wrapper" or lead blocker through the hole instead of a tight end or fullback like on normal Counters. Since zones are relatively simpler from a design standpoint, they are easier for opponents to recognize and defend. Counters are natural answers to turn linebackers' aggressiveness against themselves.
A change-of-pace play in their call sheet, it was rather average in terms of Success Rate. While Tackle Counter Reads lacked the best consistency, they sported the second best yards/attempt of either Auburn's five favorite run or pass concepts. A number of big gainers came off of this design. But while Inside Zone Reads were common across all downs, Tackle Counter Reads were mostly called on 1st or 2nd Downs. Of the plays 47 reps, 42 occurred on those two downs. This look was at its most successful to start series as its Success Rate on firsts was 48%.
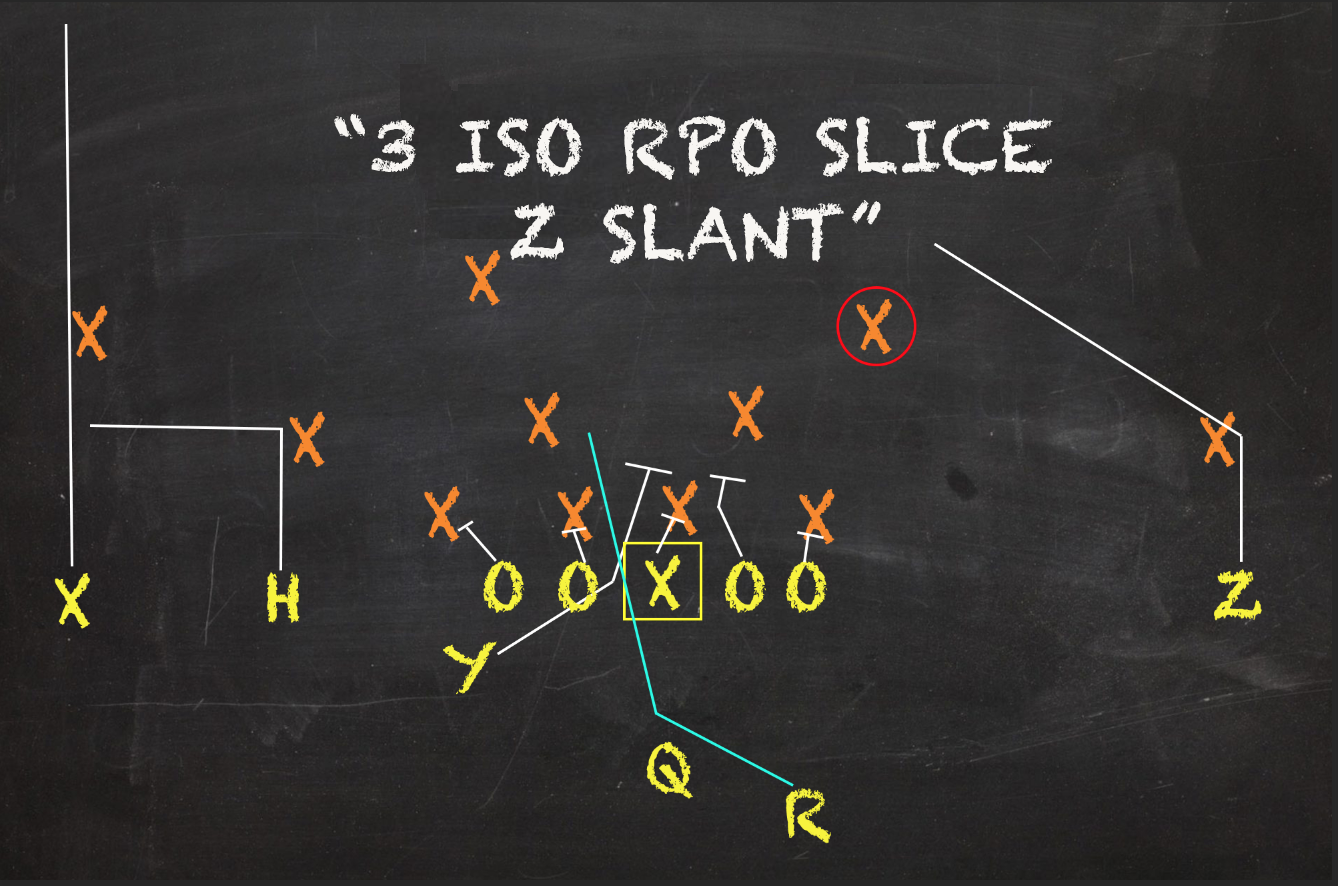
4. Iso Inserts 2.67% Play Share 7.00 Y/A 36.0% Success Rate
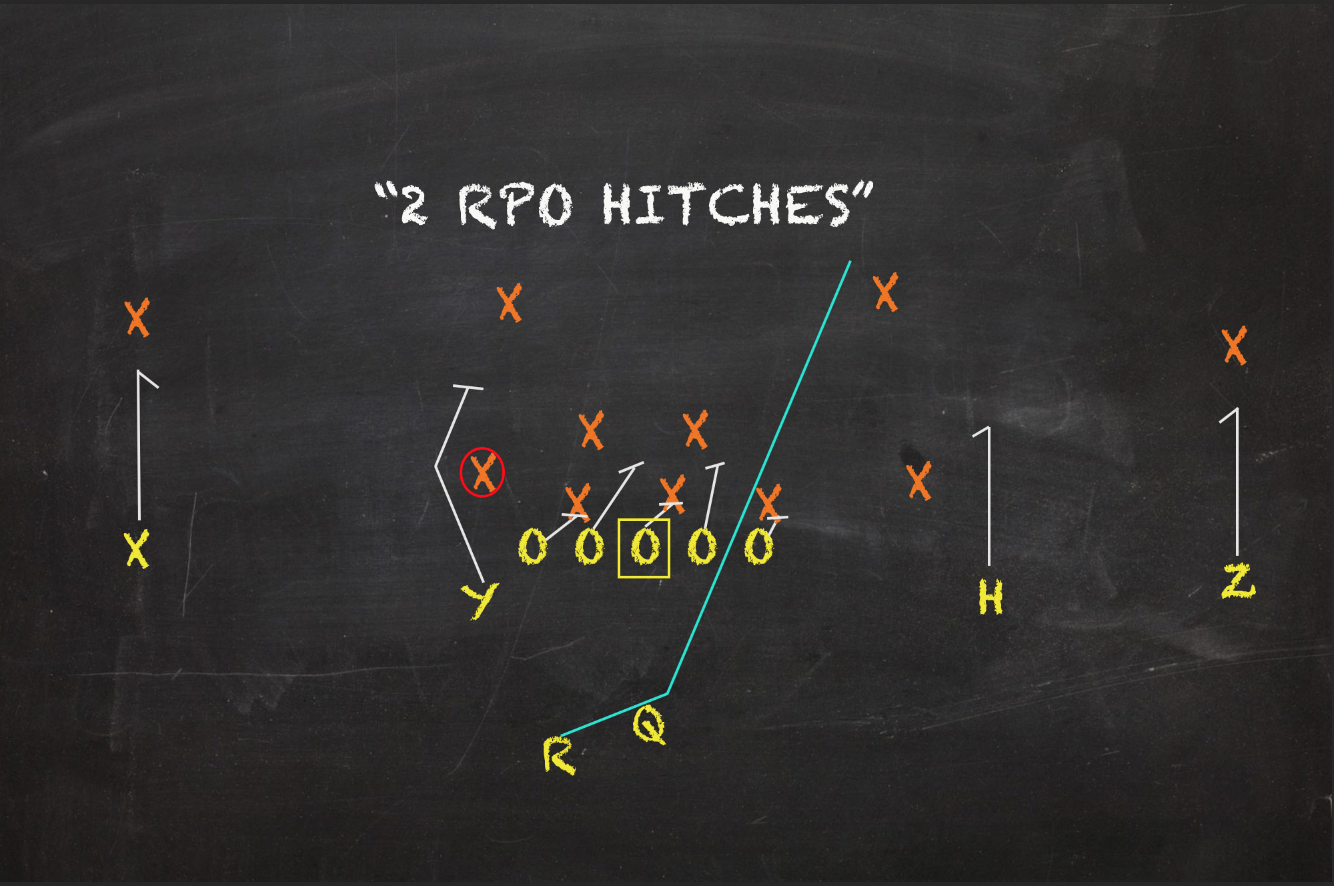
Some jabronies want to call this play a "split zone insert". I have news for you: no zone blocking scheme calls for dual backside highwalls. With hard edges set and a lead blocker, this design is of the gap variety. At its heart, it's an Isolation play. But though that old-school concept is primarily called from I-Formation sets, spread offenses have found creative ways to involve this hard-nosed concept. There's no denying Iso Inserts can resemble a zone play. In fact, they are intended to. This unorthodox design is meant to fool with linebackers keys. To add more chaos into the equation, the tight end can potentially curl his path and lead block on either side of the formation, which isn't the case on split zones. Pair them with read and RPO tags and we really get cooking.
The Tiger game where Iso Inserts first started showing up with regularity this season was in the Florida game. Nothing was working on the ground for War Eagle in the Swamp. So Malzahn dug deep and leaned on Iso Inserts to forge hard run lanes inside Florida's front. The play helped manufacture some quality gains but it was too little, too late. Another notable instance was during the LSU game. DJ Williams' big gainer to start the 3rd quarter was off this design. That run heavily inflated the play's yards/attempt to 7.0. No other play among Auburn's five most called run or pass concepts has a higher one. Despite that, Iso Inserts' 36% Success Rate was the second lowest among those ten looks.
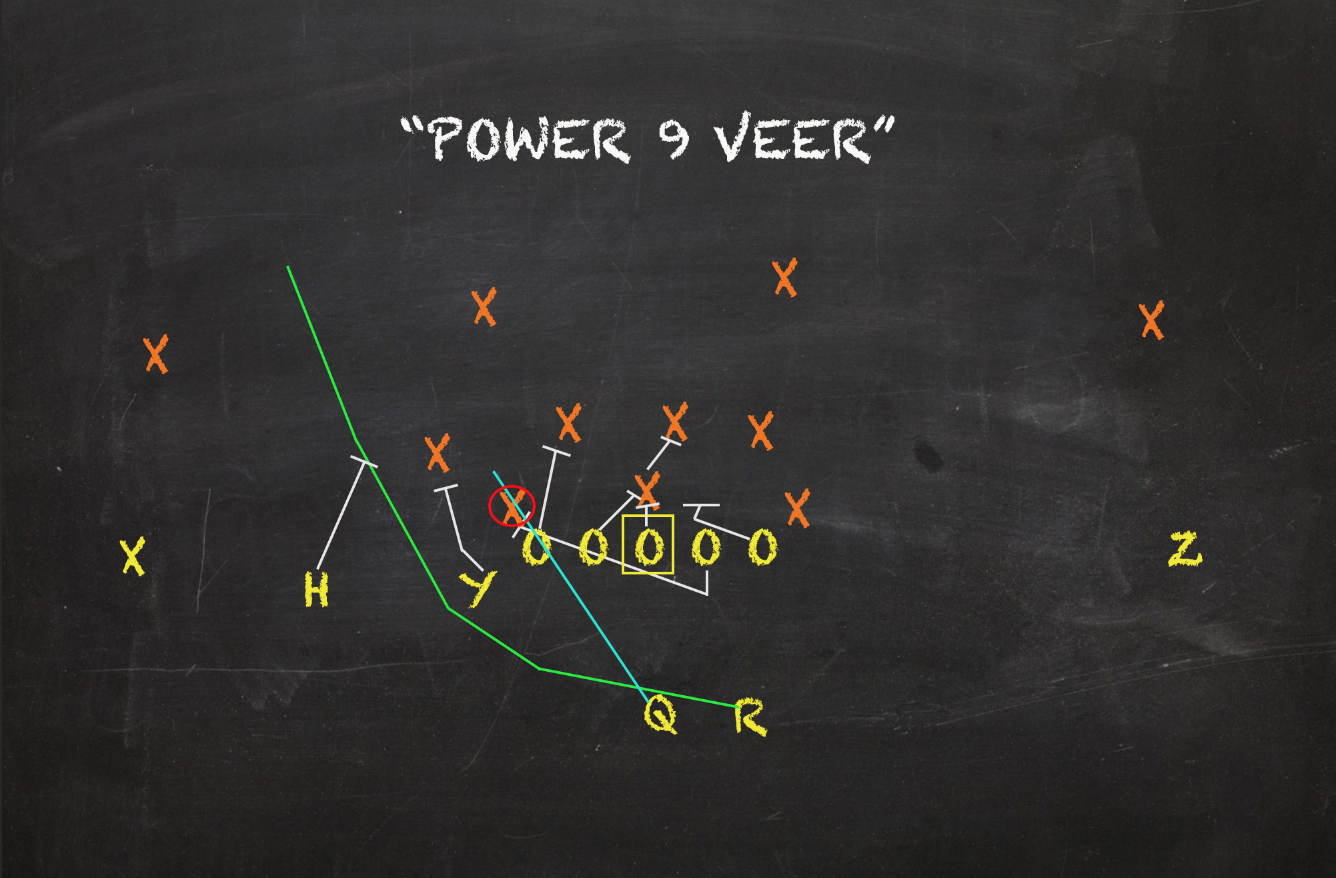
5a. Inverted Power Veer 2.35% Play Share 6.09 Y/A 59.1% Success Rate
Another wrinkle that read option teams can sprinkle around their script is the Inverted Power Veer. This design does the exact opposite of a lot of zone read norms. On those, the QB and back will head towards different sides of the formation. The back is the "dive" player and the QB hits the edge while the line blocks its typical zone rules. Inverted Power Veers mishmash all those properties by asking the QB to be the dive player, back attack the edge, both hit the same side of center and use a gap blocking scheme. Overloading one side can really fudge with defenders who are responsible for multiple gaps in the run game.
Inverted Power Veers -- along with their cousin Power Toss Reads -- were one of Auburn's most successful designs. With Nix's size and courage getting north and south, their dive option on this play simply had more mass. Furthermore, Auburn's backs are far better athletes outside the numbers than their freshman quarterback is. Like their other power plays, Malzahn mostly called them on early downs. Of the concept's 22 reps this season, 20 occurred on 1st or 2nd Down. The concept produced its best numbers on firsts. There, Power Veers owned the top yards/attempt (7.60) and Success Rate (63.6%) of any of Auburn's six favorite concepts. Again since they aim to counteract normal zone reads, War Eagle found success running them when the defense was expecting a Slam or Bluff Read.
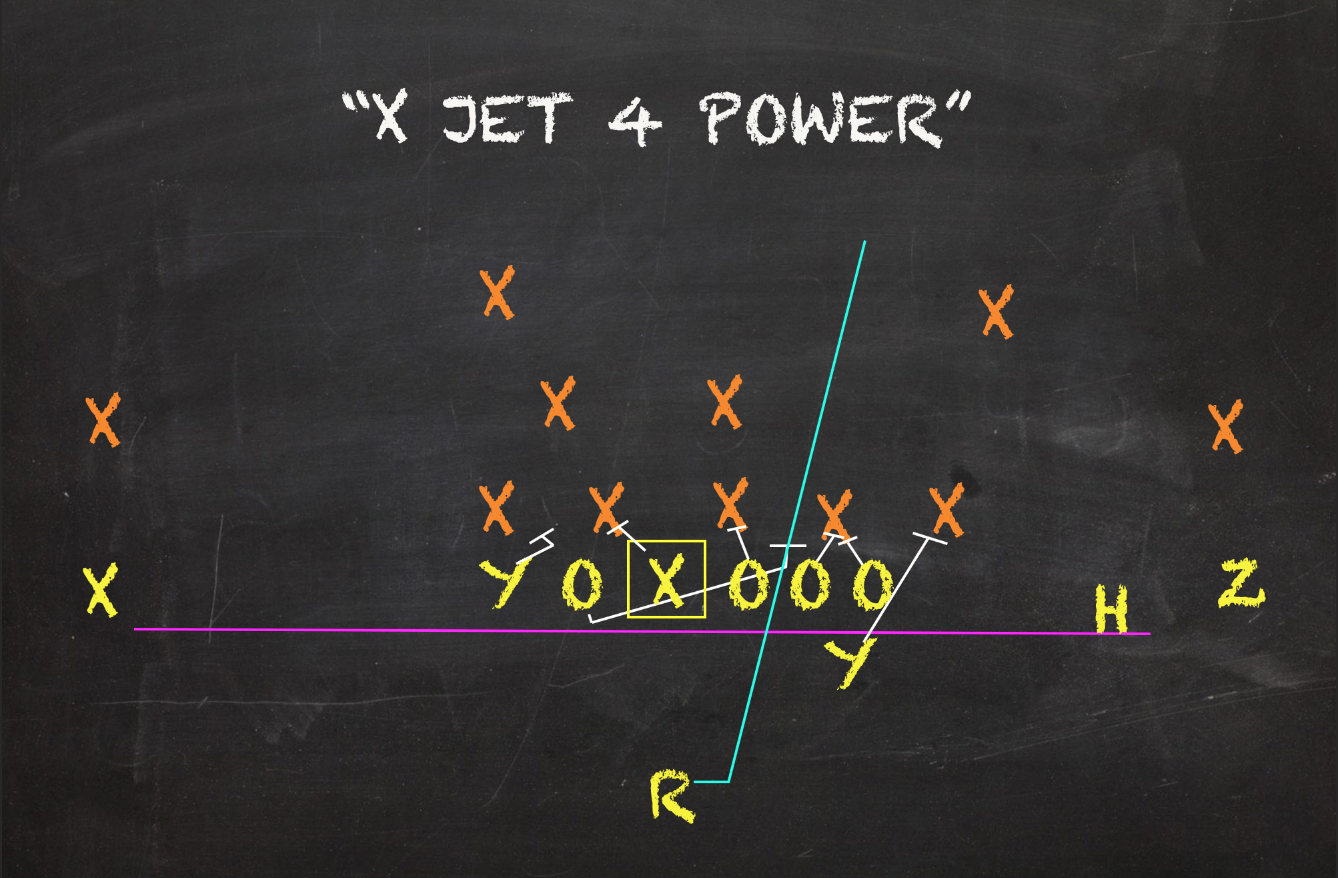
5b. Wildcat Power/Counter 2.35% Play Share 2.41 Y/A 45.5% Success Rate
Though I am slightly cheating by combining all Auburn's inside power plays out of the Wildcat into one concept, I wanted to give this some attention. The Wildcat's usage is waning as more and more teams spread out. Sure, there are instances of it showing up and being rather effective -- cough Benny Snell at Kentucky. Still the set is overly outdated and thought to be obsolete. I charted over 12,000 SEC snaps this season. Only 152 plays were out of Wildcat sets. Auburn was the only team in the conference with a concept from the set owning over a 2% play share. Unlike other straightforward runs, the Wildcat is designed to play 11 on 11.
It was very common for Auburn to present jet motion as a threat towards the edge. The functional eye candy potentially widened backers if they respected the fly, which created more cushion inside the tackles for the gap schemes to do their work. While there are some exceptions, Auburn generally ran Wildcat Powers with the orientation of the jet and Wildcat Counters against the direction of the motion. But these looks only produced a 2.41 yards/attempt, which was the lowest of any of Auburn's most called looks. While the concepts won situationally at a decent rate, they were not big play factories.
Auburn's favorite pass looks
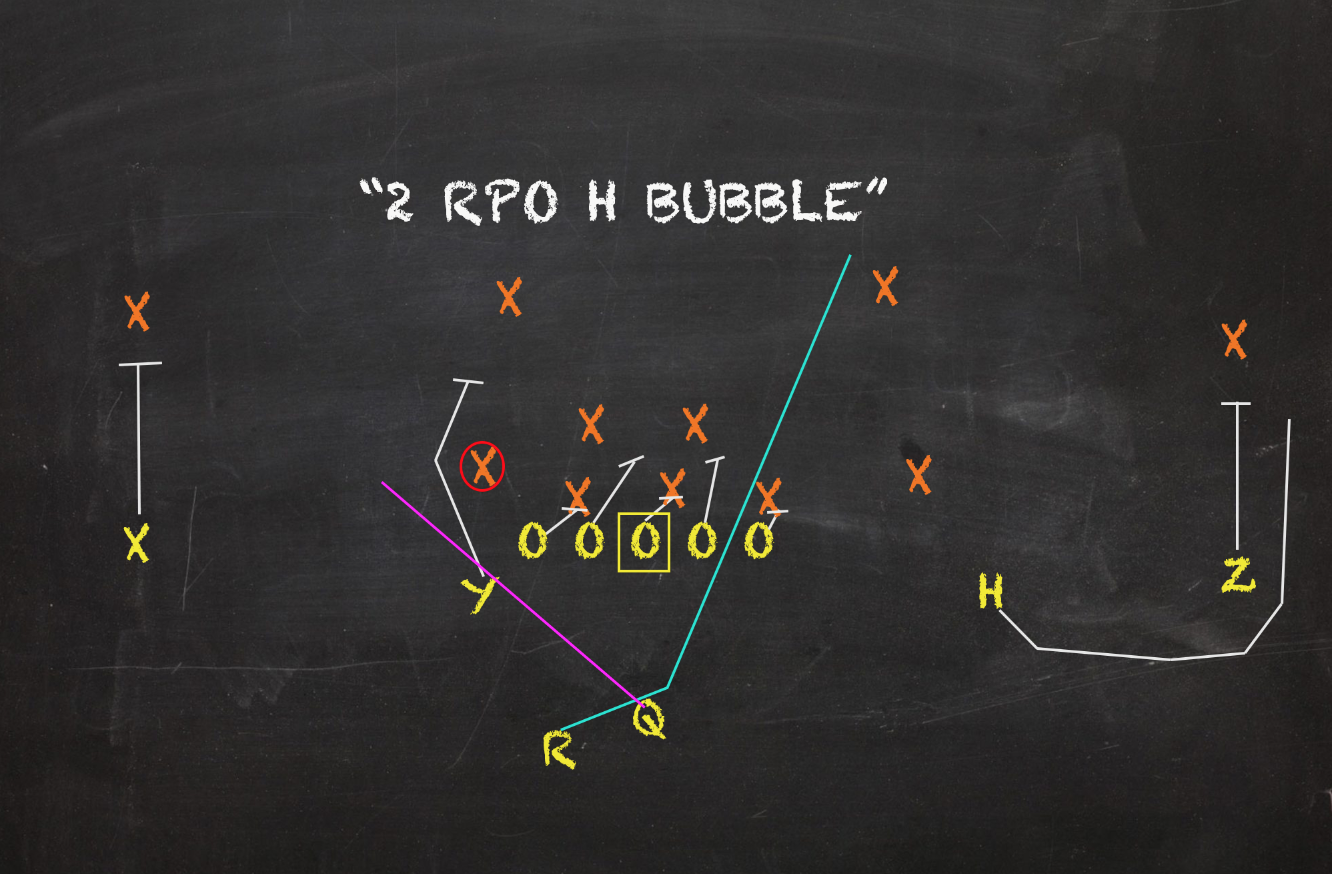
1. Outlet Screens 6.09% Play Share 5.68 Y/A 50.9% Success Rate
No SEC passer had a higher percentage of his throws come off RPOs than Bo Nix. The vast majority of those attempts were directed towards Outlet Screens. Bubble, Tunnel, and Swing screens received more reps combined than any other pass concept for the Tigers. Within the design of the reads options, Outlet Screens exist to ensure the offense always has a number advantage somewhere. If the defense loads the box, they can't match man-for-man outside and visa versa. Auburn were one of the best in the SEC at maximizing these outlets.
Only Swing screens delivered unfavorable returns. Their 21.4% Success Rate were more than doubled by the clips Bubbles and Tunnels put up this season. When targeted, Bubble Screens had a Success Rate of 64.3% with Tunnel Screens sporting a 53.3% clip. Auburn's line didn't win as much as their wideouts when they had numbers in these spots. Of the main run concepts to which these were mostly attached, only Inside Zone Bluff Reads posted a better Success Rate.
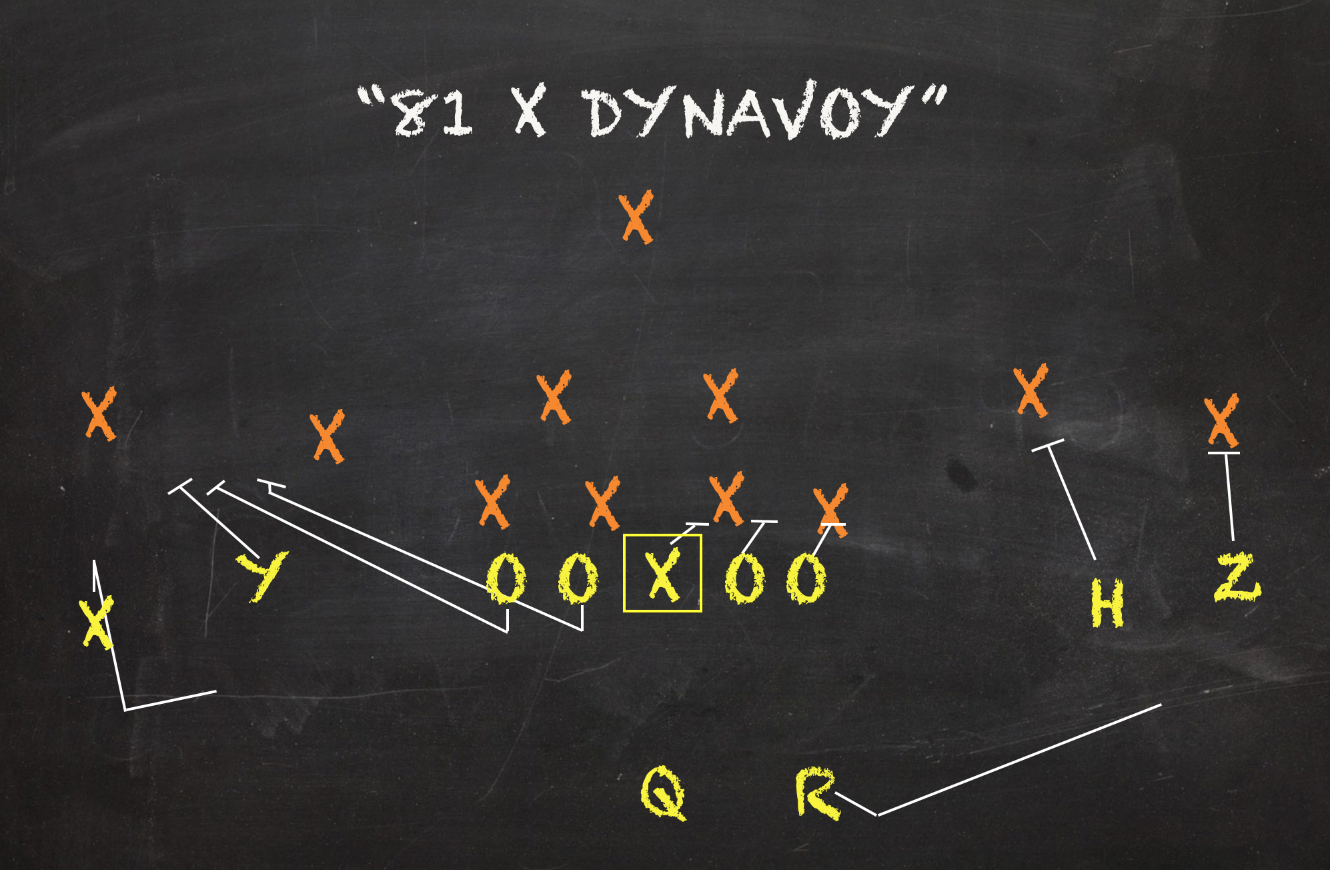
2. True Screens 3.21% Play Share 4.68 Y/A 36.5% Success Rate
Much to the chagrin of War Eagle fans that wanted more substance from Auburn's passing game, True Screens remained one of this offense's favorite concepts. Philosophically, Malzahn wants to win with numbers in space. That's basic football. But how he chooses to do that defines his offense. Historically, he likes to let his playmakers do the heavy lifting. Screens of all kinds a littered throughout Auburn's play sheet. They truly want to play sideline to sideline. While RPO Outlet Screens rely on wide receivers to be the primary blockers on the edge, True Screens let lineman get involved.
Auburn's two main True Screens are Slip and Convoy screens. Slip Screens are sneaky underneath drop offs to a back after the line initially sells a normal dropback pass. Convoy -- or Jailbreak -- Screens send numerous lineman towards the sideline to set up a cavalcade of blockers for a wideout to get north and south. Though they received plenty of chances, Auburn didn't execute these screens well. All Auburn's five most called pass concepts, True Screens owned the second lowest yards/attempt and Success Rate. They were a favorite look when behind the chains on 3rd Downs. Ironically in those spots, the Tigers had their best numbers off the looks. True Screens averaged 6.92 yards/attempt on a 41.7% Success Rate. Their 12 reps on the money down were tied with Inside Zone Bluff Reads for the second most.
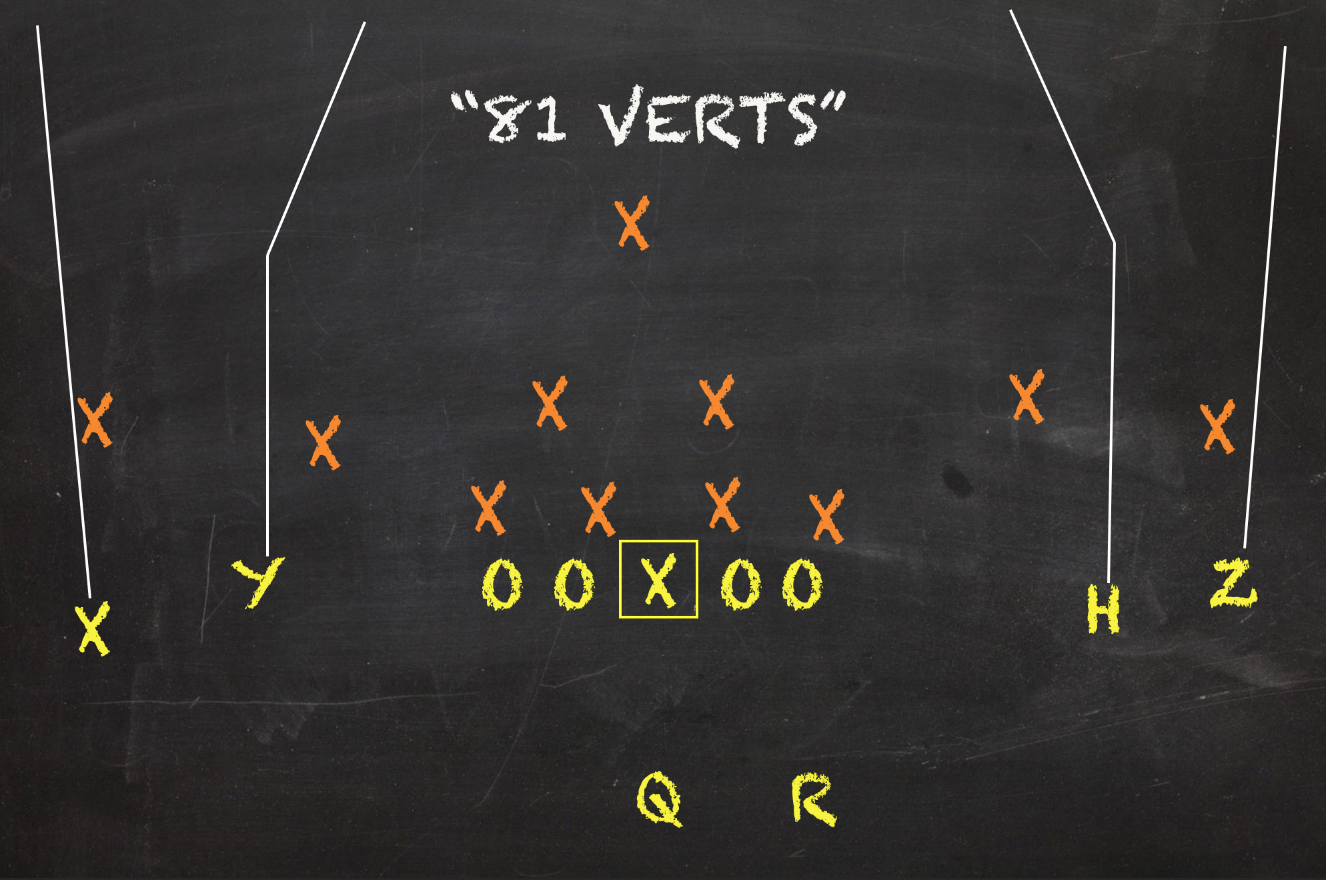
3. All Verts 2.78% Play Share 5.85 Y/A 26.9% Success Rate
Sending a few dudes deep on a go route and chucking it far doesn't require a lot of football IQ. Yet, there are times where those are the most effective plays. For Auburn, All Vert patterns mostly resulted in long incompletions. Though their 26.9% Success Rate targeted his look was right at the SEC average, that is not a favorable clip no matter what the degree of difficulty is. No other play among the Tigers' most called looks exhibited a lower Success Rate. Still, the Tigers defaulted to this look often when behind the chains. Of the 26 total reps All Verts received, 20 occurred on 2nd or 3rd Down. Though a third of the look's targets resulted in success on firsts and seconds, only one of its ten 3rd Down attempts ended in a conversion.
Nix's 20 pass attempts on this look are tied for the third most in the SEC. Yet, the freshman only connected with his guy four times. Cord Samburg went 1/1 for 27 yards. The other attempts were sacks or scrambles. Seth Williams and Jay Jay Wilson were Nix's two favorite targets commanding 59% of the team's All Vert targets.
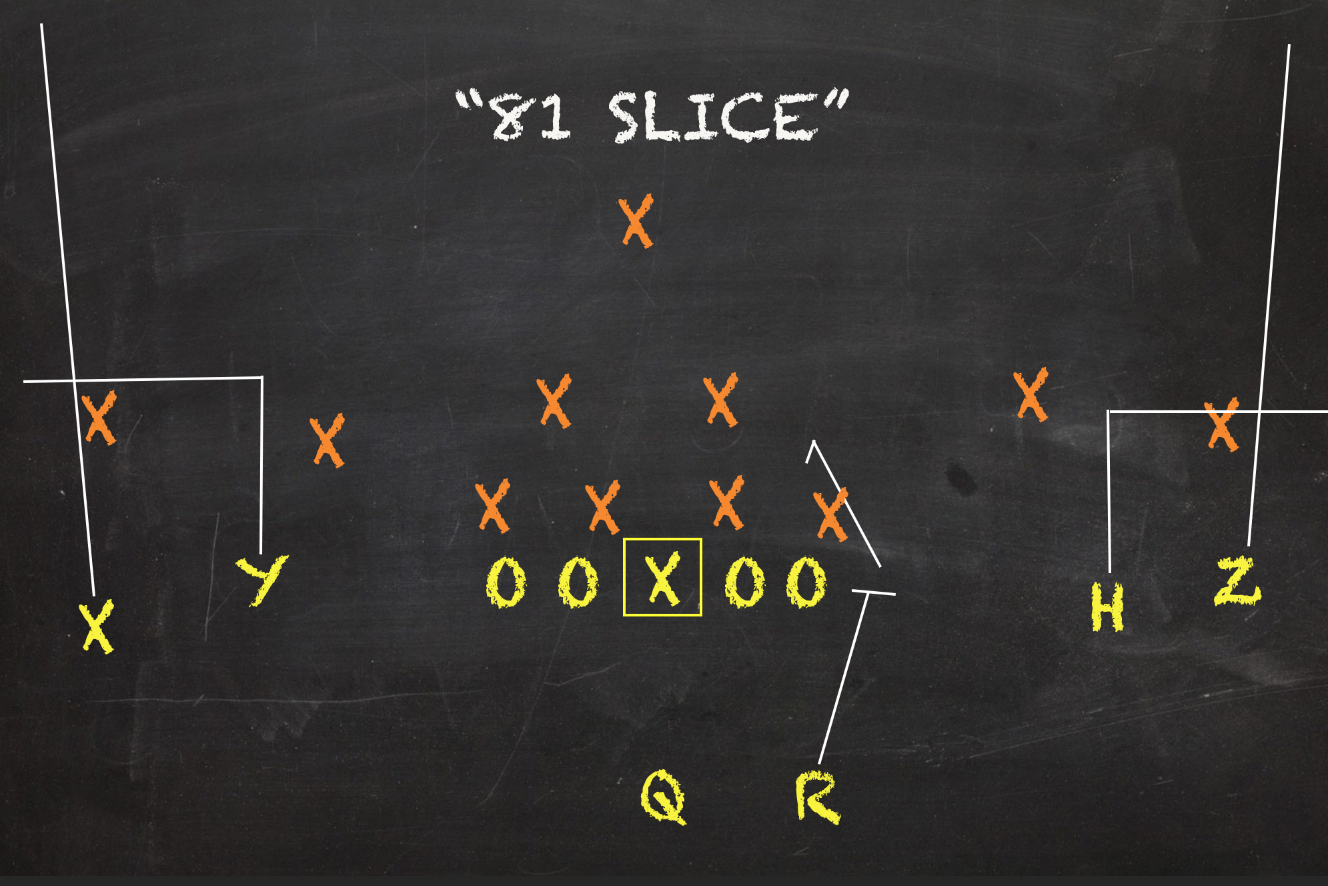
4. Ohio/Slice 2.56% Play Share 6.46 Y/A 54.2% Success Rate
When the Tigers drops back to pass under normal circumstances, Auburn really like giving their QBs high-low reads along the sideline through a number of concepts. The one they dialed up the most this season was the "Slice" concept, which is what I label an inside out and outside vertical combo. Like most of War Eagles staple pass patterns, it's rather basic. But there is beauty in that.
The out and the vertical eventually stack upon the other in a vertical row. From there, the quarterback can make his read. Cover 2 can present a "turkey hole" for a vertical to find space. Cover 3 can allow a soft cushion outside the numbers for the out. Slices can act as manbeaters or winners versus multiple zone coverages. Slices consistently provided solid production for the Tigers. No other dropback pass pattern with at least a 1.3% play share posted a higher Success Rate than Slices' 54.2% clip. As the year went along, Slices were paired with Draws in the RPO game. With the outside nature of the routes, a natural run alley would open up inside should the backers follow them outward. Of Auburn's favorite run and pass concepts, Slice's 6.46 yards/attempt only trailed Iso Inserts.
5. All Curls 1.92% Play Share 4.61 Y/A 50.0% Success Rate
Though screens are rather mundane passes, the All Curls concept is the most conservative design a play caller can go to in the dropback game.The majority of War Eagle's passing offense rudimentary with basic combos or routes like these that don't get to test a QB's arm strength. Still, that doesn't mean the pattern can't be effective. Either on true dropback or off read options, All Curl targets met their situational goals half of the time.
Auburn loved streamlining its run plays to just a handful of looks but very few passes accumulated a lot of calls across their schedule. So even though All Curls only averaged 1.4 reps a game, All Curls finished as one of Auburn's five most called look through the air. Of the play's 18 reps, nine occurred on 1st Downs. There, there were at their best. Often with the defense on their heals or providing outside cushion, All Curls were successful on 66.7% of their 1st Down targets. Their returns worsened with each passing down.
Chalking up Auburn's most successful looks
1. Power Toss Read 1.50% Play Share 8.86 Y/A 71.4% Success Rate
Simply put, Auburn should have called more of this concept this season. With a superb yards/attempt and the team's highest Success Rate, Power Toss Reads gave Auburn a great design to attack the edge while complimenting their basic inside zone stuff. So skim back up above if you want some words on how. Similar to Inverted Power Veers, this look overloads one side of the center with both ball carriers and power principles. The lone difference is the mesh point. Rather than crossing the quarterback's face, the back performs a toss path.
Jet Sweeps and Draws got more reps than this power play within the Tigers' script. Of their 14 reps, seven occurred on 1st Downs. There, the play delivered its least successful results despite averaging over 12 yards/carry. The other seven carries, however, boasted a perfect Success Rate its remaining chances. I think War Eagle peeps are with me that Power Toss Reads need more calls in 2020.
2. Bubble Screen 2.99% Play Share 6.14 Y/A 64.3% Success Rate
Not all of Auburn's targeted Bubble Screens were RPO outlets. But obviously, the vast majority were. Bubbles are Malzhan's favorite RPO route tag. They have appeared basically alongside all Auburn's read option plays with traditional mesh points - i.e. not Power Veers or Toss Reads. I mean, Bubble Screens were so popular in this offense that no single pass concept was targeted more by the Tigers this past season. While Outlet Screens collectively owned the highest play share in their passing game, Bubble Screens are responsible for exactly have of those reps.
Quite frankly, this look should sport favorable returns. In theory, these should only have been targeted if Auburn's wideouts on the edge outnumbered their defensive counterparts. Having an extra body to block defenders in space usually works out well for offenses on the perimeter. Still, Auburn executed Bubble Screens with the best of them this past fall. It's one thing to make the right decision based on the layout of the defense. It's another to go out and get those yards and move the ball downfield efficiently. Since Auburn far and away preferred their RPOs on early downs, all but one of their Bubble Screens were targeted on either 1st or 2nd Down.
3. Inside Zone Bluff Read 6.84% Play Share 5.72 Y/A 59.4% Success Rate
Inside Zone Slam Reads were Auburn's favorite concept. But, Bluff Reads were the Tigers best zone run play. While a few efficient power concepts never fully received the reps they deserved, this Split Zone look was the Tigers' second favorite play and accumulated the second most yardage. Though similar to Slam Reads, Bluff Reads differentiate themselves by the hard edge that is set by an offset tight end or fullback opposite the playside zone action. This seal can create a backside cutback alley or morph into an arcing path that can act as a lead block for the quarterback on the edge should he pull his read.
Because of that element, Nix felt slightly more compelled to keep on Bluff Reads compared to Slam Reads. Nix kept 15.6% of the former versus 13.8% of the latter. Plus, Bluff Reads also birthed better numbers on Nix's keep. While Nix was no slouch sporting a 5.43 yards/attempt on a 60.9% Success Rate on his Slam Read keeps, his ones on Bluff Reads averaged 6.90 yards per pop with a 70% clip.
4. Inverted Power Veer 2.35% Play Share 6.09 Y/A 59.1% Success Rate
One of Auburn's favorite power looks was also one of their most successful. Like its brother concept, the Inverted Power Veer provided an excellent change-of-pace design for Auburn's zone-heavy scheme. With fronts expecting a dive path from the back and the quarterback to head towards the opposite side of the center, this look purposefully meddles with those assumptions. A backside guard puller paired with both potential ball carries attacking the same side of the formation can easily defeat outnumber fronts.
In general, Auburn's rushers were pretty good when they got outside the tackles. I mean just look at Nix's Success Rates on his zone read keeps, which overwhelmingly were on the perimeter. This design allowed Auburn's backs to reap those run alleys. Every one of Auburn's four main backs finished the season with at least a 50% Success Rate on Outside Power Reads.
5. Ohio/Slice 2.56% Play Share 6.46 Y/A 54.2% Success Rate
Auburn's main passing offense was full of concepts that attacked the sidelines. While the throws might be "longer", there are potentially less obstacles outside the numbers. The perimeter-oriented concept that received the most reps that also happened to deliver a solid Success Rate was the "Slice" concept. This basic two-man combo calls for an outside vertical and an inside out route. Since it's a simple design, the read is simple for the QB. Keeping it uncomplicated helped Nix just go out and play.
Nix mostly targeted the underneath out route. But when he targeted the vertical, he posted great returns. Though a few were backshoulder fades, he completed 66% of these attempts with three scores.
Where Auburn's weapons ranked
Coming into 2019, Gus Malzahn made a bold choice donning Bo Nix with the starting quarterback job. There would be no wavering; he would be the guy moving forward. Joey Gatewood was relegated towards a Wildcat role. He would eventually transfer to Kentucky. There were plenty of growing pains during Nix's freshman campaign. Still even as a greenhorn on the gridiron, he ended with a solid foundation upon which to improve his skills. All else considered for an 18 year old, Nix handled himself well versus one of the hardest schedules in the country.
While Nix was able to pad his completion and accuracy numbers with short, simple dinks and dunks in the read game, he struggled when asked to perform normal dropbacks. While his Success Rate was comfortably in the mid-50's on RPOs, Nix only sported a 38.2% clip when not targeting screens or RPO route tags. Only five SEC passers with at least 60 of such attempts were worse this season. Though they presented low-risk completions, RPOs lowered the potency of Auburn's aerial assault. Let's be honest, it's a helluva lot easier to net 20 yards if you are throwing downfield rather than a bubble screen behind the line of scrimmage. Either way, Explosive Pass Rate is another category where Nix fell below the SEC mean. Nix's volume numbers reflected the conference's sixth best quarterback - as both his total passing yards and touchdowns placed there. But if we dig a little further, we discover Nix sported "Jeff Fisher mediocre" -- or slightly below average advanced passing numbers. It's easy to dismiss his shortcomings because of his age, but Nix finished below the conference average in dropback yards/attempt, Passing TD Rate, and Depth Adjusted Accuracy while having a bottom five Completion%, Accuracy%, and Adjusted Completion%. The only spot where he beat the conference average was in Interceptable Pass Rate; at least his subpar accuracy didn't lead to turnovers -- amirite? But he wasn't always so careful with his ball placement. During the first six weeks of the season, his clip was 7.24%.

Nix used an average amount of play action on his attempts relative to the rest of the conference. Still play fakes improved his output. As far as his Success Rate and Depth Adjusted Accuracy is concerned, his numbers improved by about 5 and 4 percentage points with play action, respectfully. Despite the pedestrian Play Action Rate, his used quite a bit of other actions thanks to his ample RPO usage. Only four SEC passers had a higher percentage of their attempts use total actions more than Nix.
His pedestrian numbers from clean pockets won't wow anyone. While it's nice to measure poise and how a passer handers pressure, seeing what a guy can do out of clean pockets is a better litmus test for his output. After all, quarterbacks only face pressure on about a quarter of their snaps on average. Nix just was okay when kept clean. Even though his Depth Adjusted Accuracy in these instances was 12 percentage points higher than his clip under pressure, the later was relatively better within the SEC. Strangely enough, Nix felt more inclined to press when he operated from a clean pocket. His Interceptable Pass Rate increased nearly 50% than when Nix was under duress. Even with RPOs giving him more predefined reads to get the ball out of his hand more quickly, Nix saw a typical Pressure Rate during his freshman campaign. And like most young passers, he didn't do so hot when defenders barreling towards him. Only about a quarter of his pressured attempts were situationally successful and only a fifth resulted in either a conversion or a touchdown. But as aforementioned, he did a great job limiting turnover-worthy throws; especially when under duress. His 4.26% Interceptable Pass Rate in these spots was basically half of the conference average. Only two other passers within the SEC were better in that regard.

Nearly 30% of Nix's dropback attempts went outside the numbers. Yet despite this proclivity to "protect" his passer from pesky linebackers and underneath defenders, Nix was one of the worst passers targeting this area of the field. His Accuracy and Success Rate ranked third and second worst among qualifying SEC quarterbacks, respectfully. Both clips were over 12 percentage points below the SEC average. No bueno. Sure this was also his favorite place to get vertical with his throws. Nix's average depth of target of 15.6 outside the numbers on dropback attempts were over five yards more than his overall figure. A good portion of Auburn passing game attacked the sidelines. Screens and dropback concepts like Slice, Comebacks, and Smash Variations frequently appeared in War Eagle's script. Because of this, Nix owned the third highest rate of throws that targeted receivers outside the numbers. Unless a defense wants to leave a gaping void between the tackles, it simply cannot spare extra men on the perimeter. Since defenses have to be prepared to clog run lanes, outward oriented patterns deal with less obstacles. With less obstacles, the odds a pass reaches its intended target are far better off. Plus, it helps when a QB can see his intended targets with a clear line of sight.

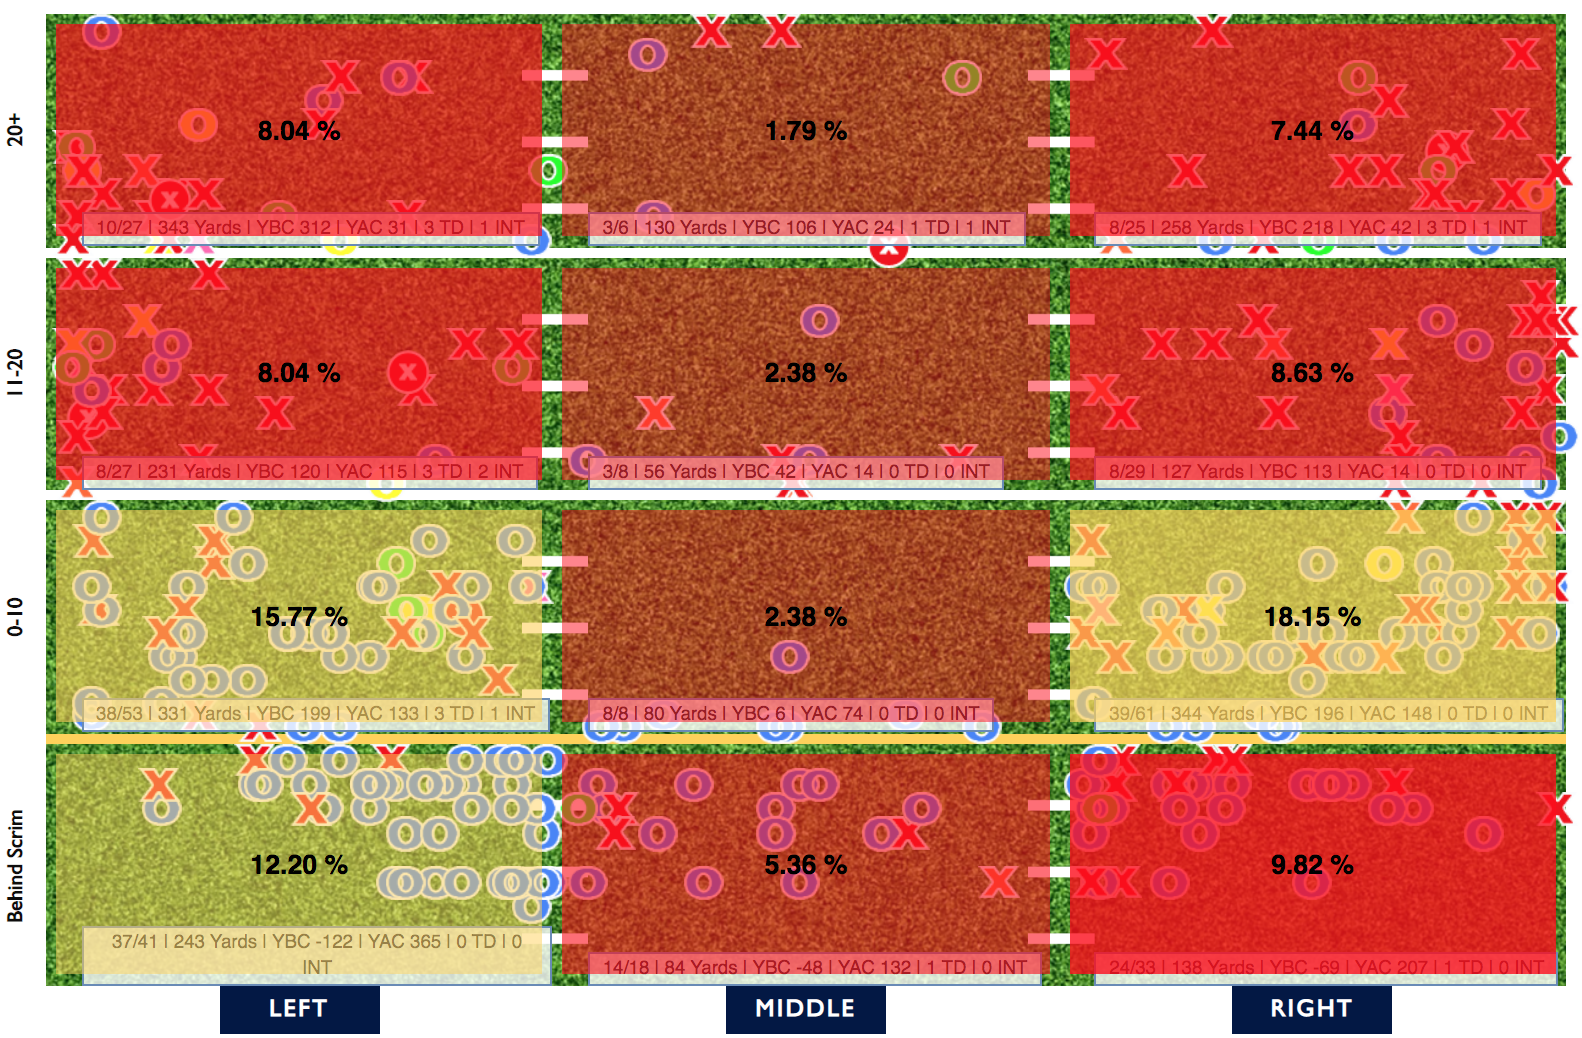
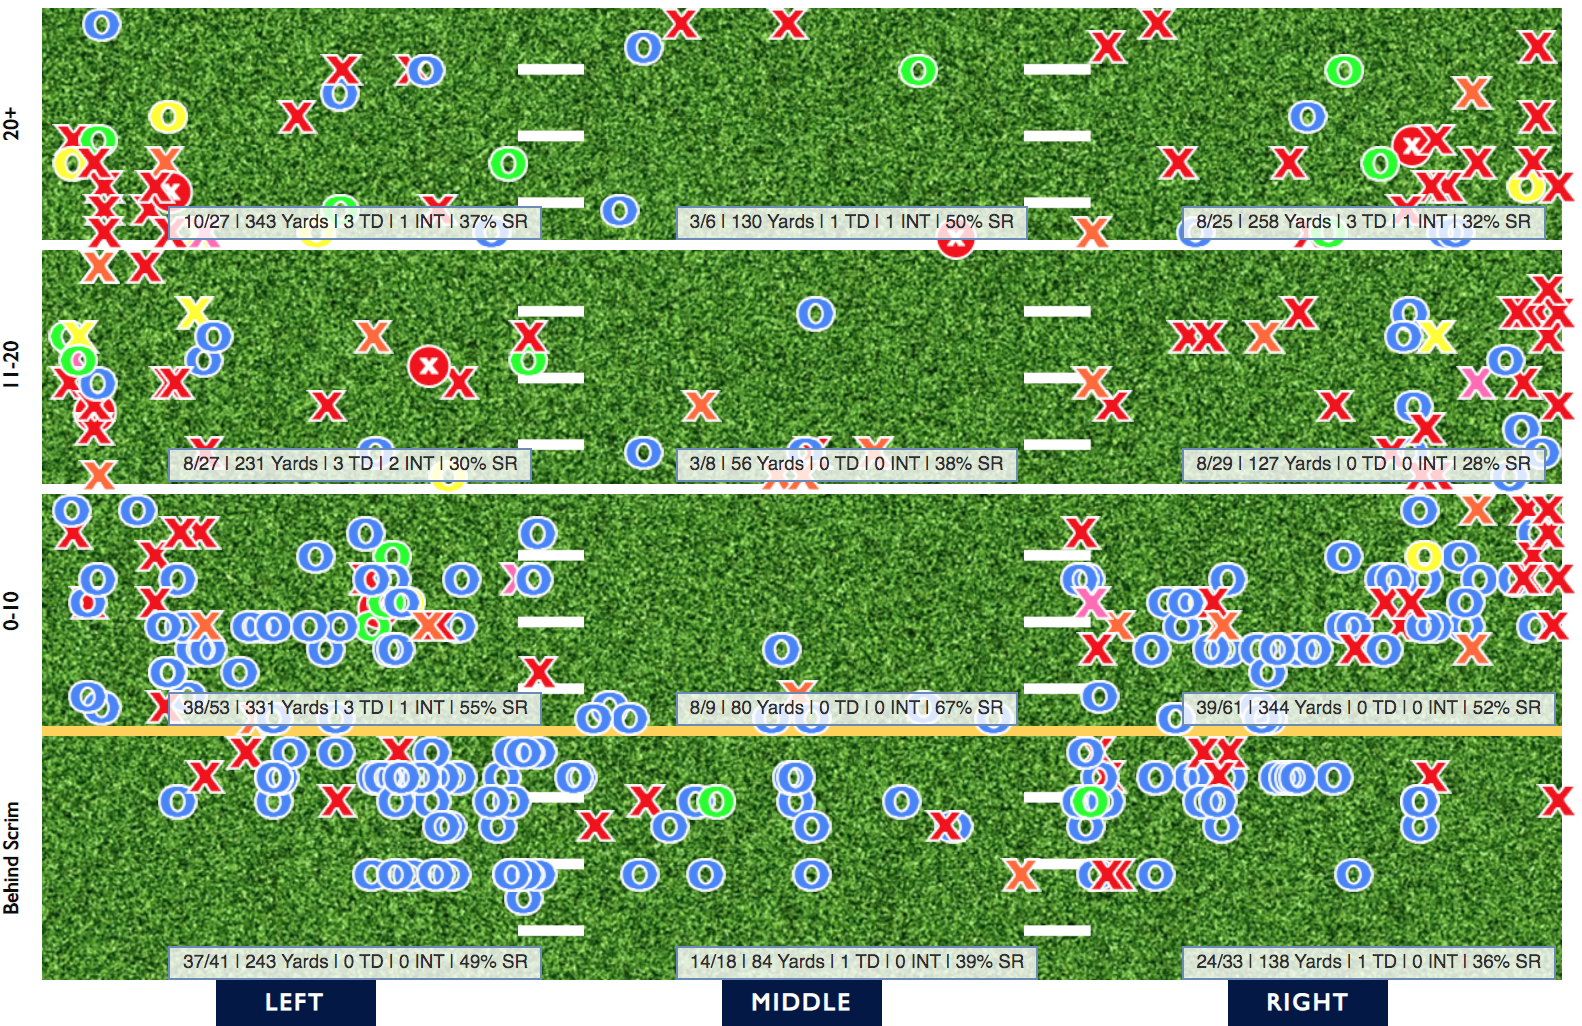
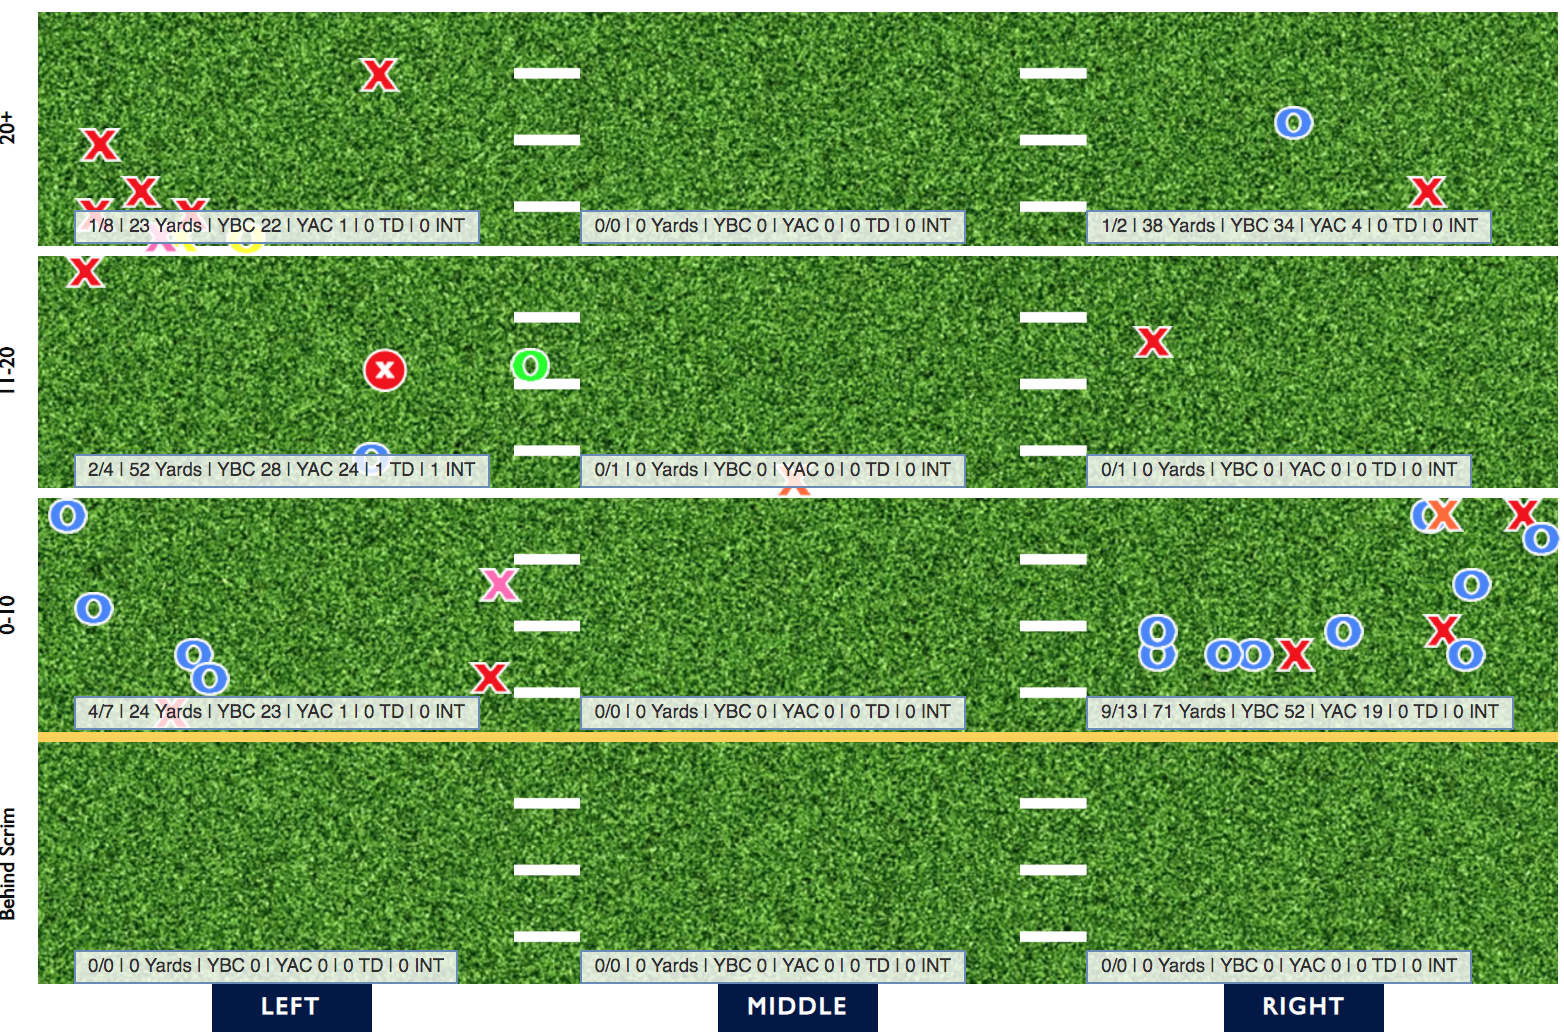
On shorter throws towards the middle of the field, Nix was more successful and accurate. On throws between the numbers and the hashes, Nix posted above average results. Though they barely beat the conference mean, a win is a win. But in the end, he once again posted "Jeff Fisher mediocre" figures. Less than 12% of Nix's attempts when inside the hashes. Again, there is no doubt Malzahn had trepidation calling concepts towards the middle opting to simplify things with perimeter oriented looks. With the majority of this right-handed offense's runs going that way, it's only natural for the RPO outlets to be opposite side. Giving those route tags plenty of loved paired with the fact Seth Williams primarily lined up at the X-spot (outside receiver on the far left) is the reason Nix favored his left. This is really broken out well on his Target Heat Map (bottom right). Both charts omit throws from Auburn's bowl loss to Minnesota.
In Auburn's run-first, RPO-laden scheme, their receivers had clearly defined roles within their attack. Seth Williams was the go-to vertical threat outside the numbers who also happened to be Nix's favorite his preferred destination when in a pinch. Anthony Schwartz's speed made sure he'd get plenty of chances at YAC designs, Utah Passes, and Jet Sweeps along with the occasional deep shot. Eli Stove in the slot was their favorite RPO outlet as 56% of his targets were at or behind the line of scrimmage. Another slot option, Will Hastings had a rocky season. Though he was a nice option in the flat, his numbers beyond ten yards downfield were one of the worst around. Overall, Auburn's main receivers ended the year no where close to the conversation of being one of the best groups in the SEC with essentially mediocre to poor returns.

Williams was the Tigers number one option. There's no denying that. His 106 targets this year were the sixth most in the conference and 47 more than the next closest Tiger. Furthermore as far as Target Share is concerned only one other player owned a higher percentage of his team's pass attempts within the SEC. A big, physical receiver, Williams mostly operated on the outside, but he was moved around the formation much more this season. Often because of his alignment and attributes, Williams was entrusted to haul in a lot of 50:50 balls. He had no shortage of chances in that department. Williams was one of two SEC players with at least 40 contested attempts. Despite the trust of his passer to win those battles, Williams had one of the worst Contested Catch Rates within the SEC of players with at least 15 such targets. He was, however, able to win deep with the best of them. Williams boasted a top10 Deep Catch Rate and accumulated the 3rd most yards of targets 20 or more yards downfield. This also allowed him to sport a top15 Explosive Catch Rate. Still his average degree of difficulty was much higher than the rest of Auburn's wideouts, which resulted in unexceptional figures in a number of spots. Even though he was given the lowest rate of uncatchable targets on the team, Williams fell into the back half of SEC qualifiers in Catching Success Rate, Catch Rate, Yards/Target, and First Down+Touchdown Rate.
Schwartz was much more a jack of all trades. While Williams was Auburn's favorite to target on dropbacks, Schwartz was more versatile. With his top-end speed, it wasn't a secret Malzahn wanted to put Schwartz in positions to torch defenses. Due the the balance of how he was utilized, Schwartz finished the season as the Tigers' most successful receiver. He was the only one of their main aerial options to command a clip over 46%. With the threat of bursting downfield, flying across for a sweep or hanging out in the flat for an outlet pass, Schwartz put a lot of strain on opponents. Along with his team-leading 54.6% Catching Success Rate, Schwartz also led the Tigers in Catch Rate, Yards/Target, and First Down+Touchdown Rate while also being Auburn's most successful 3rd Down target. He was one of the Tigers' most targeted players inside the numbers. But despite his perception as a big play wide receiver, Schwartz was one of the SEC's least explosive pass catchers this past season and only hauled in three of his ten deep attempts per his Catch Chart (bottom left). Williams was the Tigers number one option. There's no denying that. His 106 targets this year were the sixth most in the conference and 47 more than the next closest Tiger. Furthermore as far as Target Share is concerned only one other player owned a higher percentage of his team's pass attempts within the SEC. A big, physical receiver, Williams mostly operated on the outside, but he was moved around the formation much more this season. Often because of his alignment and attributes, Williams was entrusted to haul in a lot of 50:50 balls. He had no shortage of chances in that department. Williams was one of two SEC players with at least 40 contested attempts. Despite the trust of his passer to win those battles, Williams had one of the worst Contested Catch Rates within the SEC of players with at least 15 such targets. He was, however, able to win deep with the best of them. Williams boasted a top10 Deep Catch Rate and accumulated the 3rd most yards of targets 20 or more yards downfield. This also allowed him to sport a top15 Explosive Catch Rate. Still his average degree of difficulty was much higher than the rest of Auburn's wideouts, which resulted in unexceptional figures in a number of spots. Even though he was given the lowest rate of uncatchable targets on the team, Williams fell into the back half of SEC qualifiers in Catching Success Rate, Catch Rate, Yards/Target, and First Down+Touchdown Rate.
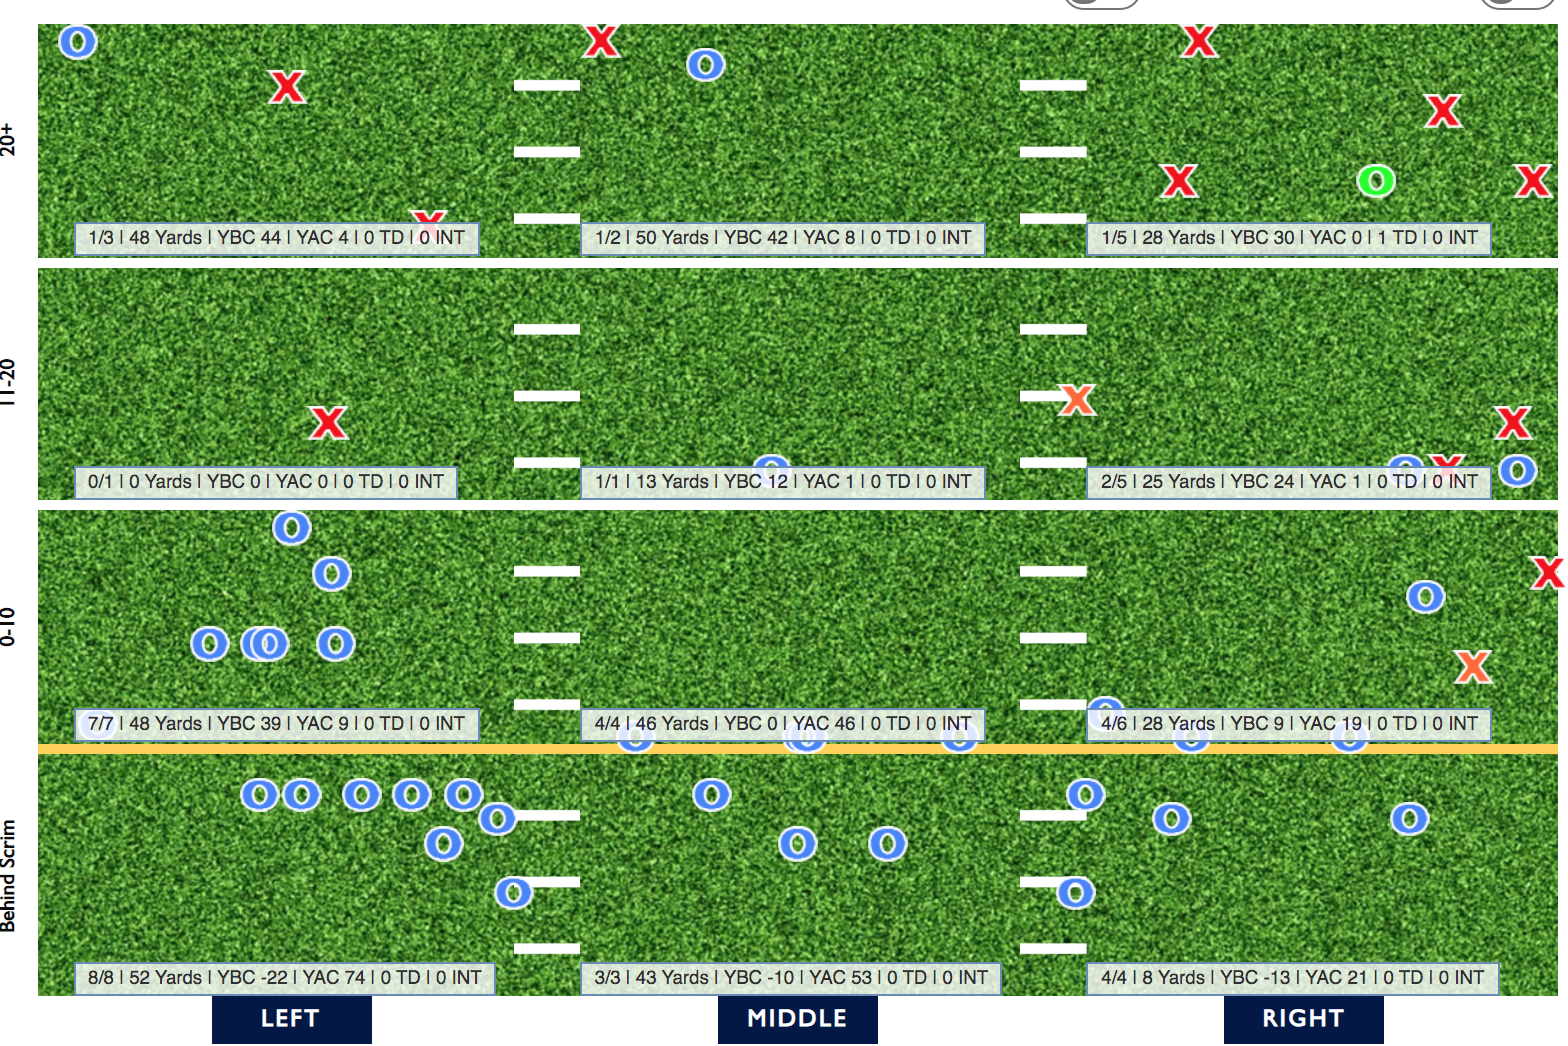
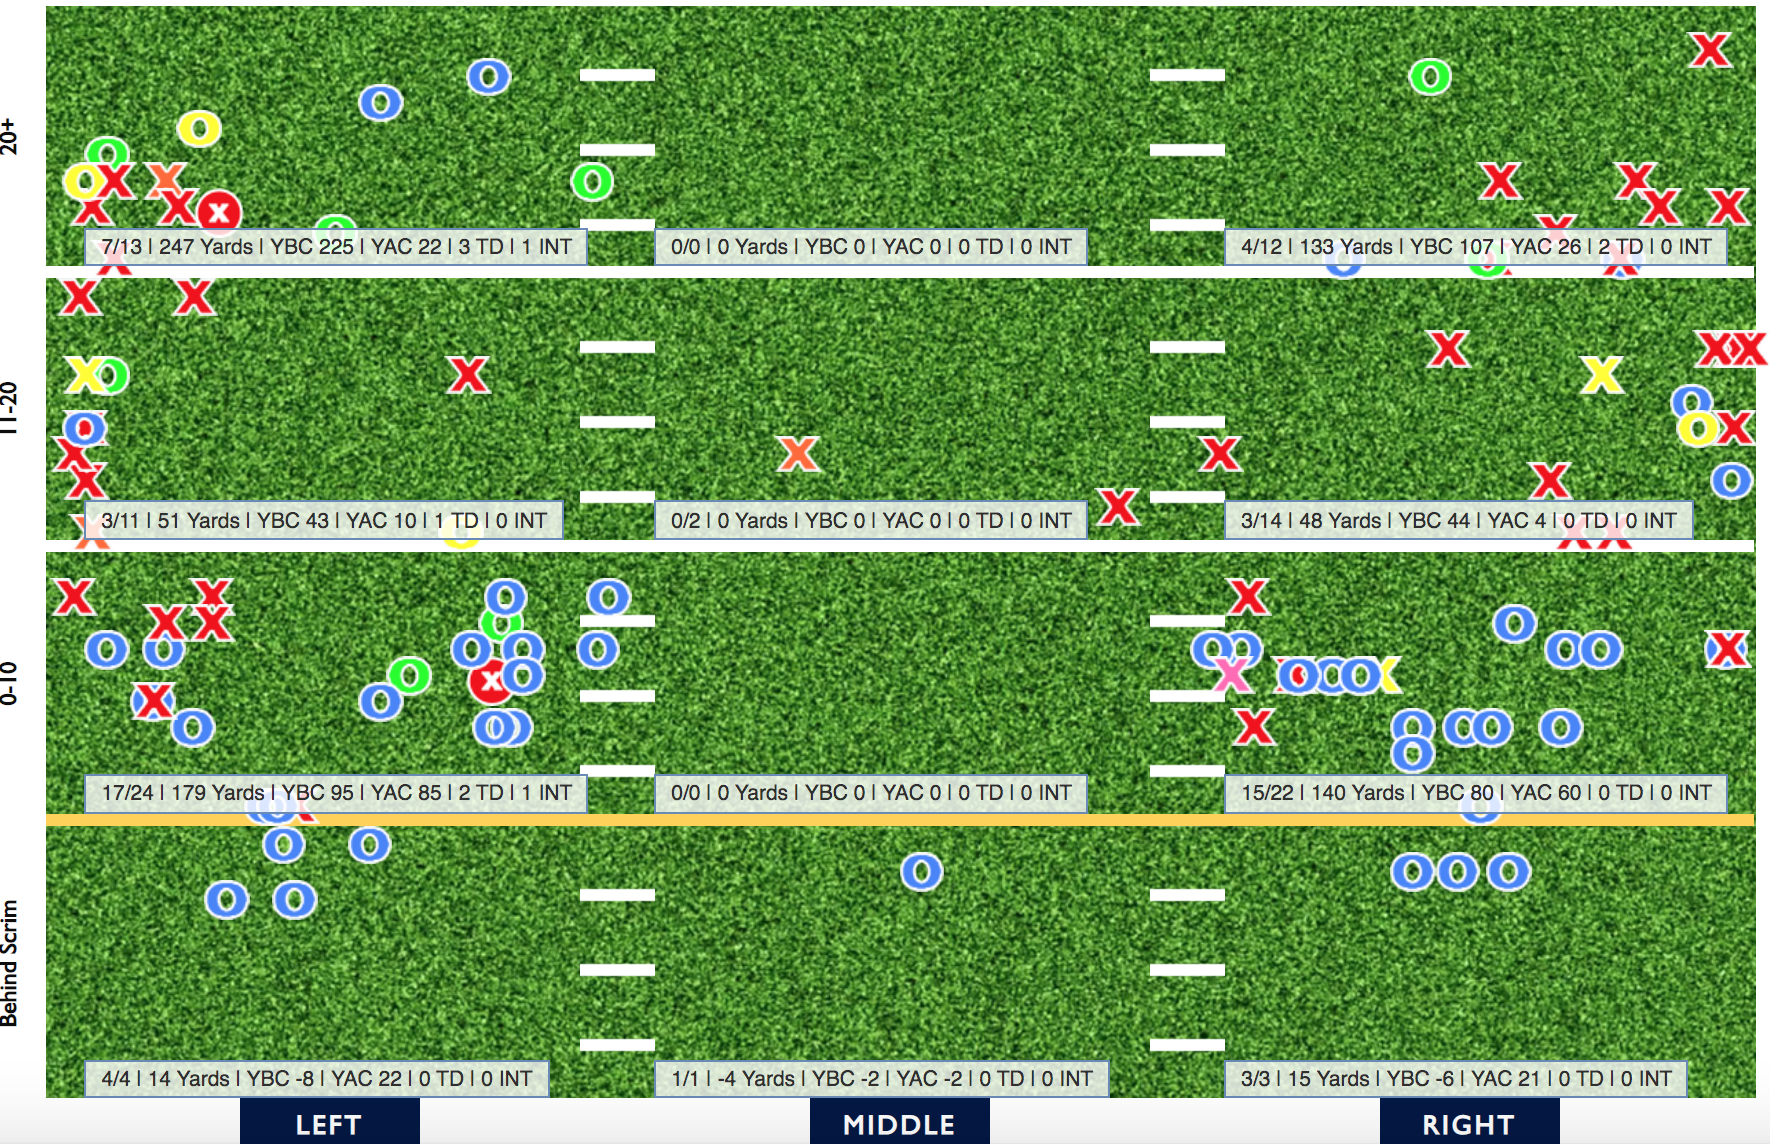
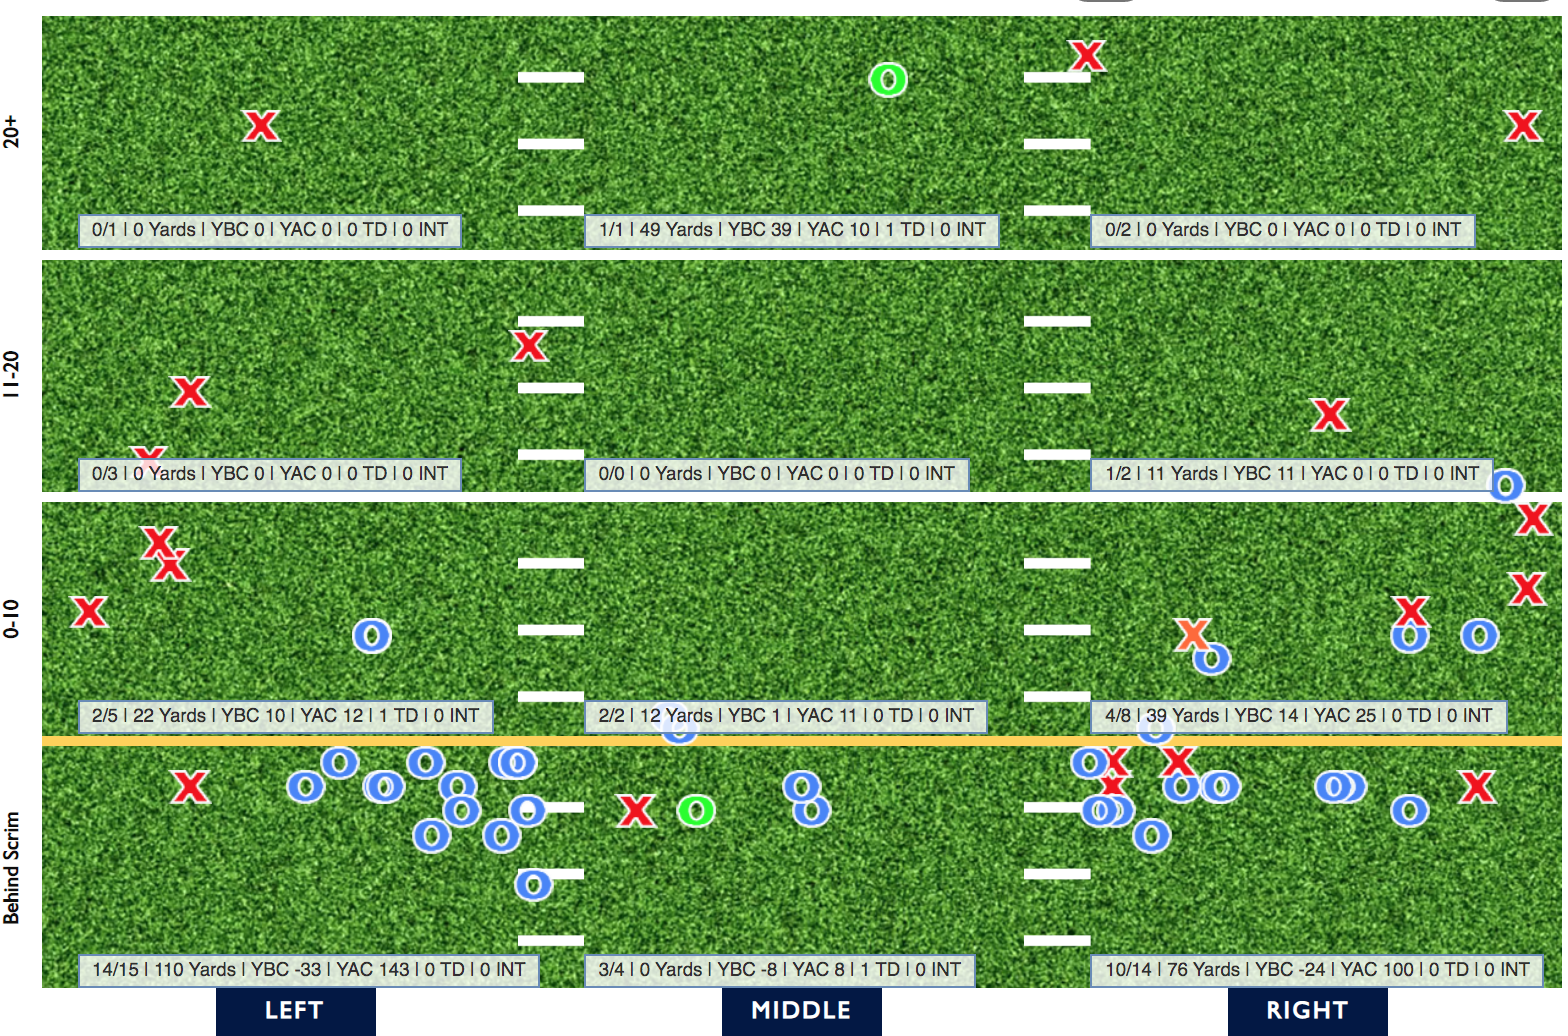
Hastings offered up little substance upon his return to Auburn's lineup. Hasting basically struggled across the board. As an undersized slot receiver, he and Nix rarely were able to get on the same page downfield. Only UK's Josh Ali saw a higher percentage of his targets get labeled as uncatchable than Hastings. When one out of three throws on average has no chance of being caught, it's bound to destroy you efficiency numbers. Hastings fell inside the conference's bottom10 in Catching Success Rate, Catch Rate, Yards/Target, First Down+Touchdown Rate, average yards after the catch, Drop Rate, and Deep Catch Rate. But since so many of his opportunities had no chance of being caught, Hastings' Depth Adjusted Catch Rate fell inside the top half of SEC qualifiers. In case you are unaware, this metic omits uncatchable targets from its equation. Stove fell into the role he always seems to: Auburn's main RPO option in the flat. Though he was targeted some downfield, the vast majority of his damage came on throws behind the line of scrimmage vis short stuff. Because most of his targets were low-risk and towards open space, Stove ended the year with Auburn's best Drop Rate, Depth Adjusted Catch Rate, and average yards after the catch. No SEC receiver had a lower average depth of target than Stove. I mean, just look at his Catch Chart (bottom left). Though he was one of the best after the catch, he finished with only 2 explosive catches. He was not suited to win in crunch situations. He failed to haul in a single 3rd Down target and only managed to catch one pass when contested. Only two of his ten targets beyond ten yards downfield resulted in a completion. But those were mostly on Nix. Overall, nearly a quarter of his chances weren't catchable. Wayward intermediate and deep attempts are to blame.

While the Tigers ran the ball at the third highest clip in the SEC, their overall run game was average. While somewhat consistent down-to-down, they were not explosive whatsoever when they turned to the ground. Auburn's line and running towards advantageous spots allowed the Tigers to sport the conference's fourth best yards before contact average. Plus, they greatly curbed tackles for a loss on carries. Yet, their ball carriers collectively weren't the best at making guys miss or rack up yards once defenders got their mitts on them. Losing their bell cow back in the middle of the season forced Malzahn to operate with a committee approach, which often tipped his calls.
Kam Martin and Shawn Shivers had more defined roles as plug-and-play rushers. Both Shivers and Martin mostly came in to run power concepts. Over two thirds of each back's carries and over half of their rush yards came off power schemes. Both finished the year with comparable yards/attempt averages, First Down+Touchdown Rates, and Negative Run Rates. Martin, though more successful, was slightly more soft. His Broken Tackle Rate was the second worst in the SEC. Plus, he was the only SEC back with at least 40 carries that didn't end with a single "Gumption" attempt -- or an instance where a gain occurred after getting hit behind the line of scrimmage. Boobie Whitlow entered 2019 as Auburn's bell cow back. Even after missing more than a month of action, he ended the season leading the team in carries, yards, first down runs, and broken tackles. While other backs were shoehorned into either zone or gap schemes, Whitlow did it all. And after Joey Gatewood departed the Plains, he became the Tigers de facto Wildcat back. Thanks to being granted copious short yardage situations from that set along in their normal offense, Whitlow had the best First Down+Touchdown Rate of the Tigers' four main backs. He was also Auburn's hardest rusher as far has his Broken Tackle Rate is concerned.
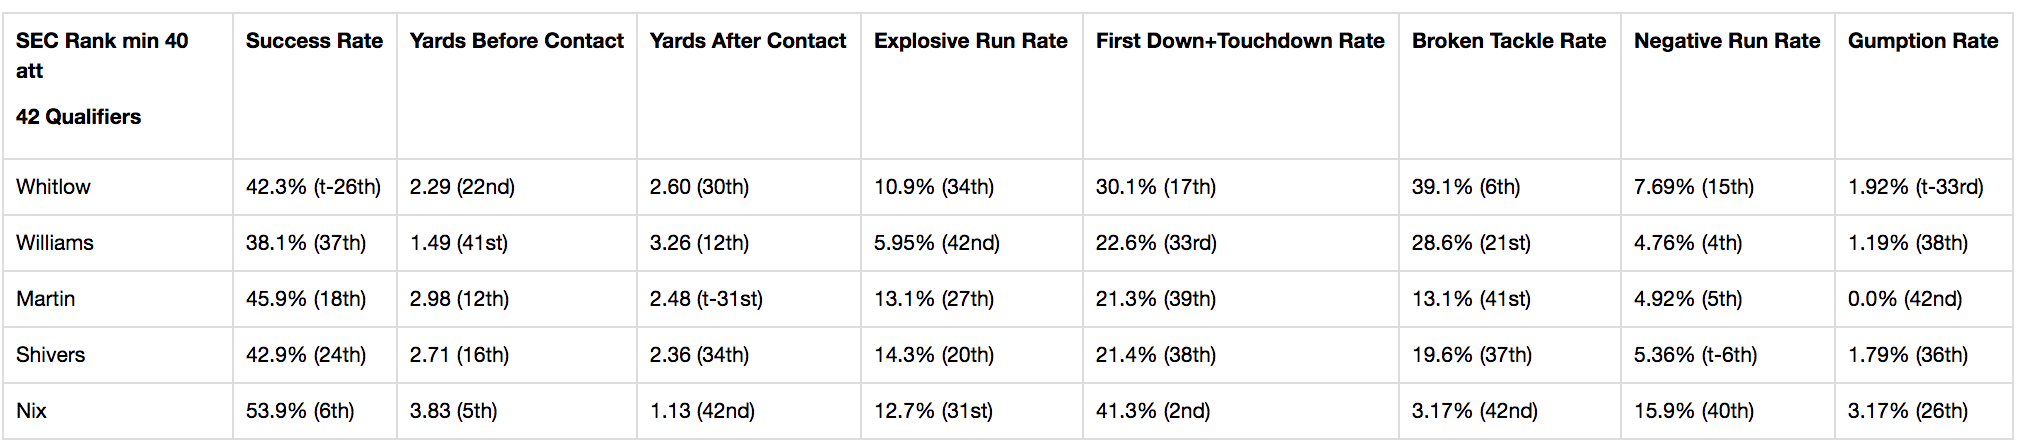
Rather than repeating myself on Nix, I'll just quickly gloss over what he gave to the run game. His mobility truly allowed Auburn to play 11 on 11 in their read game. He ended the year with the 5th most designed carries of any SEC quarterback and as the 6th most successful ball carrier overall. Maybe you'll notice glancing at that table above, he was the only Tiger Rusher with a Success Rate over 50%. Though he avoided contact and didn't put up much of a fight when wrapped up, he saw plenty of green grass on his carries. His 3.83 yards before contact clip was fifth best in the conference. Only Texas A&M's Kellen Mond had a higher percentage of designed carries result in either a conversion or a score.
Freshman DJ Williams emerged during the stint Auburn was without Whitlow. While Martin and Shivers were given more power concepts to do their damage, over 61% of Williams' tries were off zones. Williams had a few splash runs in his debut season, but he was overly the Tigers least efficient back. His Rushing Success Rate and Explosive Run Rate fell inside the bottom 6 of SEC ball carriers. Though Auburn's backs were mostly granted cushion to operate, Williams' average yards before contact was the SEC's second worst. It's a damn good thing he was able to fall inside the top12 after contact or else he might have been the worst performing back in the conference. Despite the early contact on average, Williams rarely went down for a loss. His 4.76% Negative Run Rate was the fourth best in the conference.