Sideline to Sideline: Arkansas 2019
When Chad Morris accepted the task of resurrecting the Arkansas football program, most assumed he'd have a long leash and time to turn it all around. Transforming a roster riddled with big bodies built for multi-TE sets and power football towards and an exotic spread offense wasn't going to happen overnight. No one expected as much. But, few expected them to lose ground. Hog Nation still wanted their team to play competitively and show signs of growth even if the W's failed to pile up. They never got their wish.
Losses to Colorado State, North Texas, San Jose State, and Western Kentucky were indefensible from a team that hadn't had a recruiting class ranked lower than 49th in eight years per 247 Sports. Six of those eight classes were ranked within the Top30 with four being inside the Top25. Those black eyes paired with zero SEC wins in his tenure resulted in a unceremonious exit before Morris' first two seasons in Fayetteville even concluded.
Losing soundly to a Sun Belt team as an SEC school is one thing. But to lose to a former castoff who just a season prior started games at quarterback for you is another. Though perceived talent appeared to be in its ranks, the on-field product was at its lowest levels in decades. Atrocious on both sides of the ball, the Razorbacks rarely looked prepared and never looked equipped to make strides within the standings. Get a nose-pinch ready. Some of the stats Arkansas mustered this season straight up stink to high heavens. Whew...Pig Suey.
Arkansas at a Glance
To use a tired analogy, Morris' stint at Arkansas was two years of trying to squeeze a square peg through a round hole. Brought in to reinvigorate a program that became stale and lumbering, Morris' spread scheme from a far resembled Bobby Petrino's offensive philosophy. Since Petrino was the last man to help the Hogs reach a conference title, that tidbit perhaps carried more weight than is should have when the school looked to replace Brett Bielma's Big10 style of play.
While the techniques changed, results got worse. For years, the line was built to impose its will on fronts. Under Morris, Arkansas' hog mollies were asked to operate with more finesse and nuance that a spread scheme rampant with RPOs would call for. The growing pains were obvious and incessant.
In 2017, essentially 6% of Arkansas play calls used read elements or targeted Run-Pass Option outlets. This year, over 22% of their plays were RPOs alone. While still below average within the conference, that's quite an uptick. But production on these plays were not great. While the Razorbacks averaged a third of a yard more per carry on RPO runs, their 37% Success Rate reflected a scheme that was doomed to fail. Overall, the Hogs only sported a 41.5% Rushing Success Rate, which ranked 11th within the SEC. Runs not on RPOs were successful on 43.5% of tries. While better, it was a below average clip across the conference. The modern day triple option, RPOs failed to consistently help the Hogs win in space. With outlets running routes instead of helping block a straightforward run, defenses were able to contain their ball carriers.
But while RPOs flopped on the ground, they provided passers easy routes in space that aided Arkansas' aerial efficiency. Oversimplifying the situation, Razorback QBs had a 44% Passing Success Rate on their RPO throws compared to a paltry 33% clip on normal dropbacks. While their passers still averaged under 6 yards/attempt on these throws, it was almost a yard higher than their average on non-RPO passes. Much of the concepts targeted in these spots were typical one-man routes or simple space reads. Bubble, Tunnel, and Swing screens along with Slant Variations, All Curls, and isolated hitches, slides, and flats were some of their favorite route tags. All of these are quick-hitters aimed to hurt the defense within 2 seconds within the snap. Even though they helped the Hogs steal easy yards, they were still well below the conference average in terms of efficiency. RPO throws owned an average Success Rate of 50.6% across the SEC.
Using reads and RPOs were Morris' way of inoculating his offense toward his spread tendencies without completely telling them to start from scratch. These plays have evolved to more than just basic zone reads they were when they first came onto the scene. In addition to zones, Power, Counter, Veer, Draw, Iso, Trap, and Toss looks all were called with read elements by the Razorbacks in 2019. That way, Arkansas' line could aim to play physical and bruise fronts, exactly what they were recruited to do, while allowing Morris to stress defenses sideline to sideline with his spread stuff. Three of Arkansas' most called run concepts were of the power variety as were three of their five most successful plays.
The Bielema era linemen were bred to bash folks in the run game. That was the utmost priority. If they could pass block, then that was just icing on the cake. It was no secret they wanted to go down swinging running the rock. With Morris in charge, Arkansas' OLine's ability did not match his offensive mentality. Despite never having a polished passer, game changing receivers, or competent pass blockers that justified going pass-happy, Morris wanted to give his scheme a go.
Outside of the increased usage of RPOs, Morris was a big believer in maximizing his outlets. With more men out running routes on average, naturally less were left in to block. Of the 21 SEC passers with at least 70 pass attempt this past season, Ben Hicks and Nick Starkel averaged the fourth and seventh least amount of blockers per dropback. Already set up to struggle pass setting due to their skill sets, Morris made his line's job even harder by giving them less help on average from backs or tight ends. This gross miscalculation continuously hindered the Razorbacks.
No SEC passer faced pressure more than Hicks. Just under 37% of his pass attempts were under duress. Starkel didn't get off easy in that department either. Despite averaging 2.14 seconds to throw, the fourth quickest clip in the conference, Starkel saw pressure on over a quarter of his dropbacks. His 25.7% Pressure Rate was the seventh most in the SEC of passers with at least 70 attempts. Overall, Arkansas' passers faced pressure on 35.6% of their attempts -- the highest in the SEC. Though their line posted the 6th best Sack Rate, they were lousy at letting defenses harass their passers. With loads of pressure affecting their dropbacks, Arkansas' passing game consistently withered in these spots. Captain Obvious wanted me to tell you that quarterbacks are generally far better passers when they operate from clean pockets.
Both Hicks and Starkel placed in the SEC's bottom third in Completion%, Accuracy%, Defender Breakup%, and Interceptable Pass Rate when under pressure. Often playing from behind, these shortcomings were exacerbated as they often had to abandon the run game. The majority of the time, the Hogs simply looked overwhelmed when they wanted to throw. Whether pressured, clean, on a dropback, screen, or RPO, Arkansas passing game floundered. Four of their five most called pass concepts finished with a Success Rate under 33%. Only Vanderbilt's Overall Passing Success Rate was worse within the SEC.
Rather than tweaking his protection schemes, Morris relied on RPOs to make up the lost ground. Unlike Morris' favorite pass concepts that were typically vertical in nature and took time to develop, RPOs manifest much quicker. While part of these plays' goals was to win in space where the defense was vulnerable, they also helped mask Arkansas' subpar pass blocking. Since the line blocks RPOs like the run portion of the play design, they can still come out firing full force. Overall, the Hogs averaged 2.36 seconds to throw on the season. But on RPO throws, that figure dropped to 1.7 seconds. Kinda hard to give up a sack in 1.7 seconds. This style certainly is not overly jazzy nor explosive. At the end of the day, the Razorbacks finished the the SEC's fourth lowest percentage of passes that netted 20 or more yards.
The Hogs started games with an average Pass Rate relative to the rest of the offenses in the conference. On 1st Downs in the first half, Arkansas ran the ball 53.4% of the time and RPO's 34.3% - the fifth highest clip in the SEC. But thanks to poor blocking and allowing a decent amount of Havoc, the Hogs played behind the chains a lot. Regardless of situation, Arkansas was just flat out bad. Across all downs, the Razorbacks placed no better than 12th in Success Rate.
Using deduction, I'm sure you can guess the run game wasn't all that great either. You'd be right. Arkansas' Rushing Success Rate ranked 11th in the SEC. While Rakeem Boyd had a number of highlights, the Razorbacks only generated an explosive run on one out of every seventh carry on average, which was also the 11th best rate in the conference.
Still, Arkansas were far more formidable as a running team than when they took to the skies. Again, that is what this offense was originally built to do. While the down-to-down Success Rate was unsatisfactory, the Hogs' OLine helped forge the third best yards before contact average (2.76) and limited Run Havoc plays at the fourth best clip in the SEC (24.9%). But while the run blocking was sound, winning against SEC West DLines was a hard ask week in and week out. Even with the proclivity to pass, five of the Hogs' six most called concepts this season were runs.
Poor early down execution put them behind the chains more than almost everyone in the SEC. Nearly 30% of their offensive drives ended in a Three-and-Out. Only South Carolina and Vanderbilt were worse in that respect within the conference. Rarely did drives result in points. Per our numbers, an Arkansas drive was just as likely to end in a Three-and-Out than in points. The Razorbacks had the second worst scoring rate at a meager 29.6%. In terms of touchdown per offensive snap, the Hogs only edged out -- you guessed it -- South Carolina and Vanderbilt.
This often led to their players trying to do too much. I already mentioned Hicks' and Starkel's high Interceptable Pass Rates. And if you recall, a good number of those attempts did indeed result in turnovers. With a periodic fumble or two from the ground game, Arkansas finished with the worst Turnover Rate in the conference with a 2.79% clip.
With demoralizing play by their offense, the defense played with very little confidence. There were already built-in excuses for why the offense was taking a minute to materialize. The defense, however, was rarely adequate and frequently mistake prone. Thanks to their offense's low production, Arkansas allowed a negative statistical relationship in every category except Sack Rate. Meaning, their Sack Rate on defense exceeded their clip allowed on offense. Every other advanced analytic was in the red. With their defense providing little resistance and their offense resembling a tire fire, Arkansas had the 2nd worst deficit in terms of Success Rate against conference opponents. The Hogs allowed a league-high Success Rate of 49.7% versus SEC foes and only mustered a 34.4% clip on offense themselves. Only Vanderbilt's margin of -16.6 points was worse.
The putridity that the Razorbacks' defense exhibited against conference foes wasn't contained to just Success Rates. The Hogs ranked either last or second to last within the SEC in Yards/Play Allowed (7.15), TD Rate Allowed (7.34%), Yards/Game (474.3), Three-and-Out Rate (27.7%), Pressure and Pass Havoc Rate (15.6%, 6.25%), Tackle for a Loss Rate (7.72%), average pass yards after the catch (4.39), and average rush yards before contact allowed (3.33). Not to mention, their defense was also in the bottom three versus conference opponents in Explosive Play Rate Allowed (15.6%), Run Havoc (19.5%), and Sack Rate (4.91%). It's important to mention that these numbers exclude the embarrassments of the San Jose Sate and Western Kentucky defeats. Needless to say, incoming defensive coordinator Barry Odom's work is cut out for him.
Conference foes used the lowest amount of motions against Arkansas than any other team. The answer is clear: they really didn't need to use eye candy in order to gain an edge. No SEC defense averaged less distance to defend than the Razorbacks' 7.94 against conference offenses.
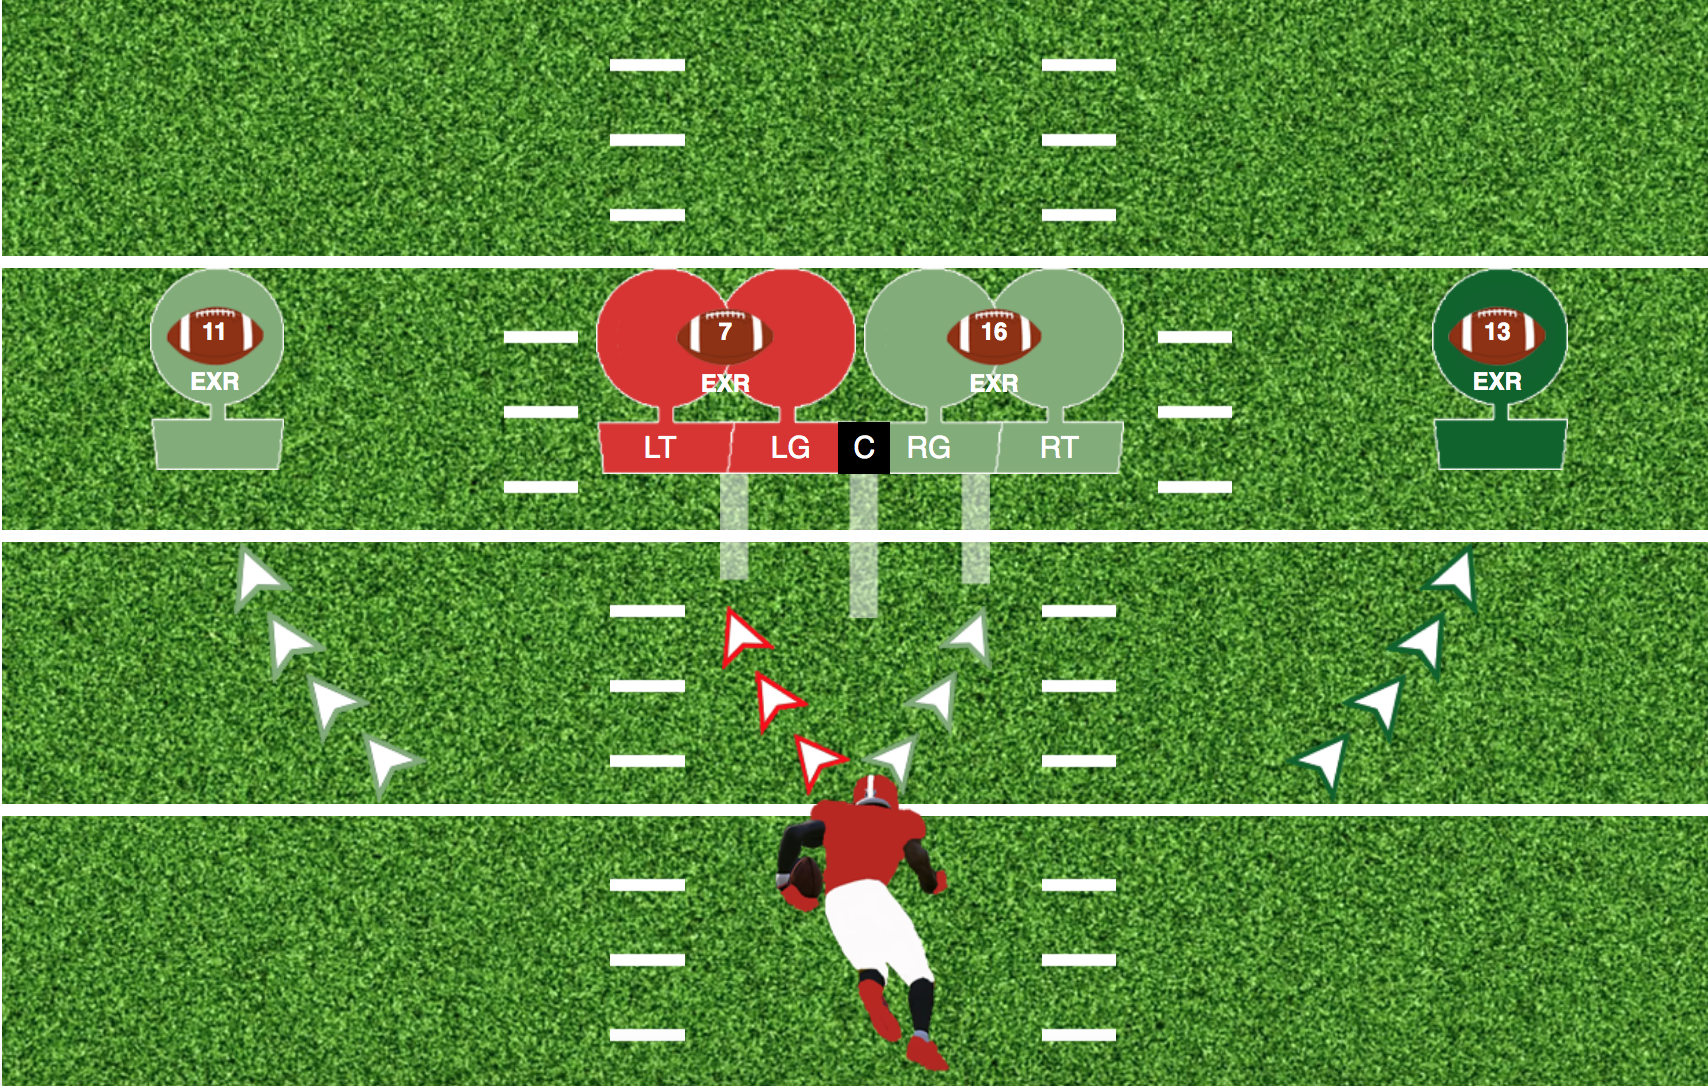
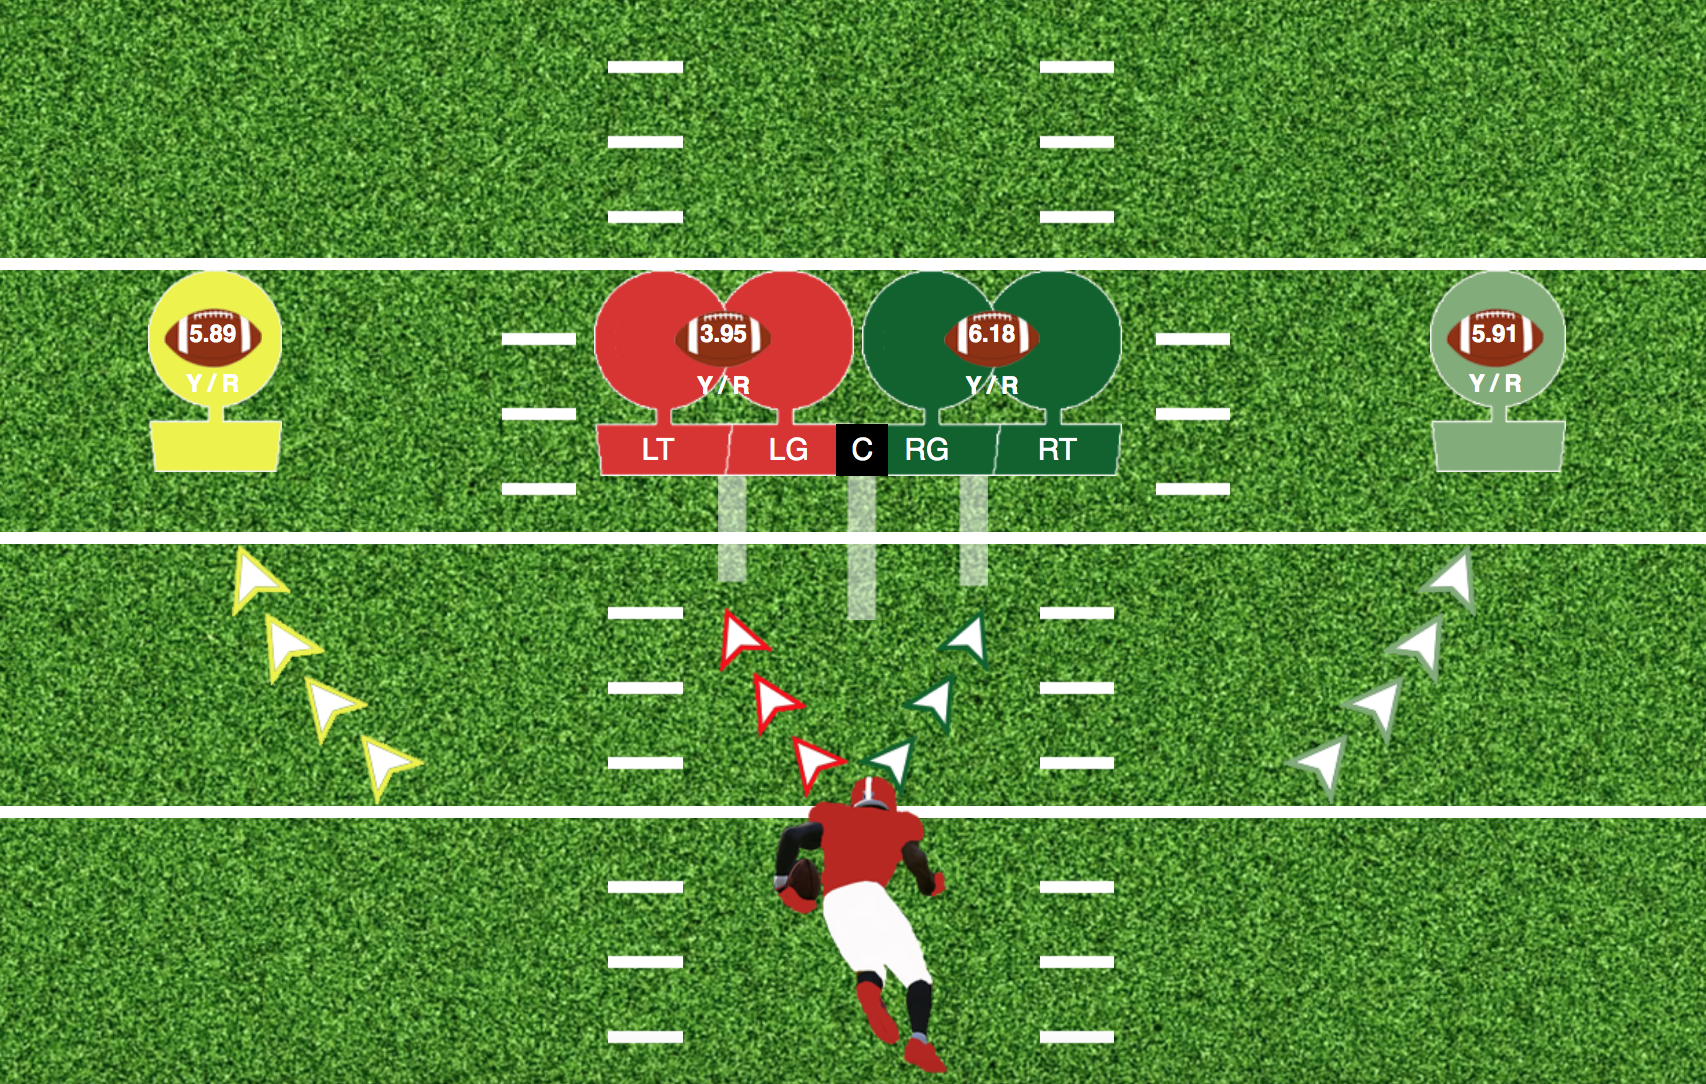
Whether by traditional volume figures or new-age rate-based analytics, Arkansas' 2019 team was bad no matter how you sliced it. It was apparent the Hogs teetered every week under Morris' guidance. Sam Pittman inherits a situation that should take less time to mold into a bowl team, but that doesn't mean the job will be any easier. Kendall Briles and Feleipe Franks in the mix should forecast more spread stuff in 2020. But if the last couple of years is any indication, what they run won't really matter if their line can't execute. Pittman's expertise in the trenches will sorely be needed in Fayetteville if the new regime is to remain in power for an extended period.
Arkansas' favorite run looks
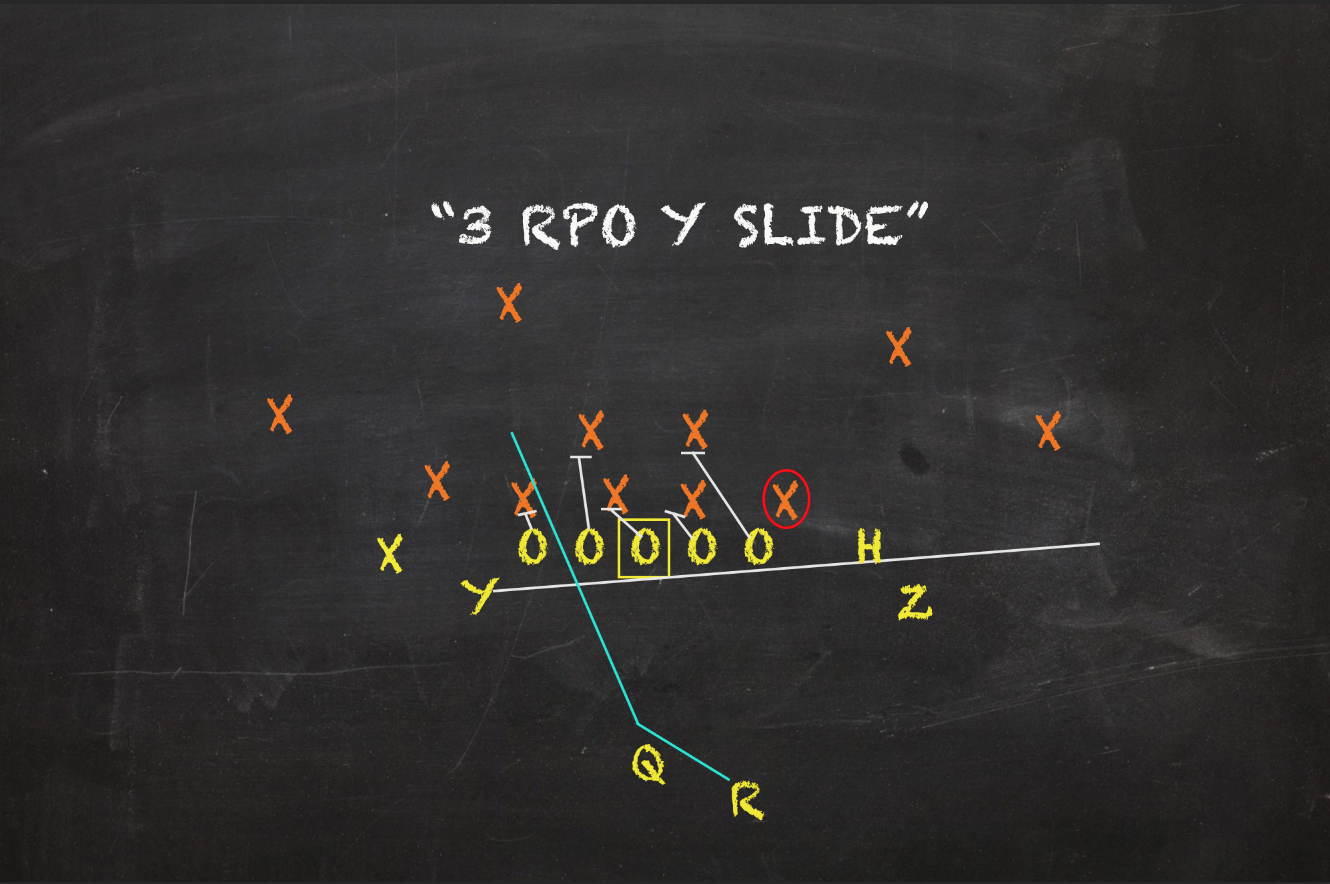
1. Inside Zone Slam Read 11.3% Play Share 6.76 Y/A 35.2% Success Rate
For many spread offenses, Inside Zone Slam Reads are often foundational looks. Besides being a core run play, many Run-Pass Options hinge off of these read plays. As a team trying to fast track towards a spread mentality, Slam Reads were a big part of Arkansas' offense. Outside of the RPO aspect, Slam Reads were Arkansas' most repped play this season. Furthermore, their 47 1st Down reps were about 30 more than the next closest look. While directed towards the B-gap between the guard and tackle, these can are considered rather basic zone plays. Zones are designed react to what the defense is doing rather than dictating everything. By starting "passive-aggressive", a line with a good chemistry can reach any front. Zones are just more malleable post-snap than powers
For the Hogs, these mostly fizzled. Running the ball is what Arkansas roster was overly recruited to do, Morris' scheme be damned. While overall one of the best units at creating cushion for their ball carriers, the Razorbacks' hog mollies averaged 3.63 yards BEFORE contact on all Inside Zone Reads compared to just 2.76 across all runs. But explosive gains and ample room to run rarely yielded laudable results. Big gainers helped inflate Slam Reads' yards/attempt to 6.76 but only about a third of its tries resulted in a successful rep. In fact, its 35.2% Success Rate was the lowest of any of their five most called run concepts. But thanks to the volume they received and their sturdy yards/attempt, Slam Reads accumulated the most yards of any concept for the Hogs at 595. No other look had more than 177. While certainly a coaching point to prevent them from taking unnecessary hits, neither of Arkansas two main passers had a single designed rush attempts on this look. They preferred to distribute to outlets in space when the primary run read was taken away.
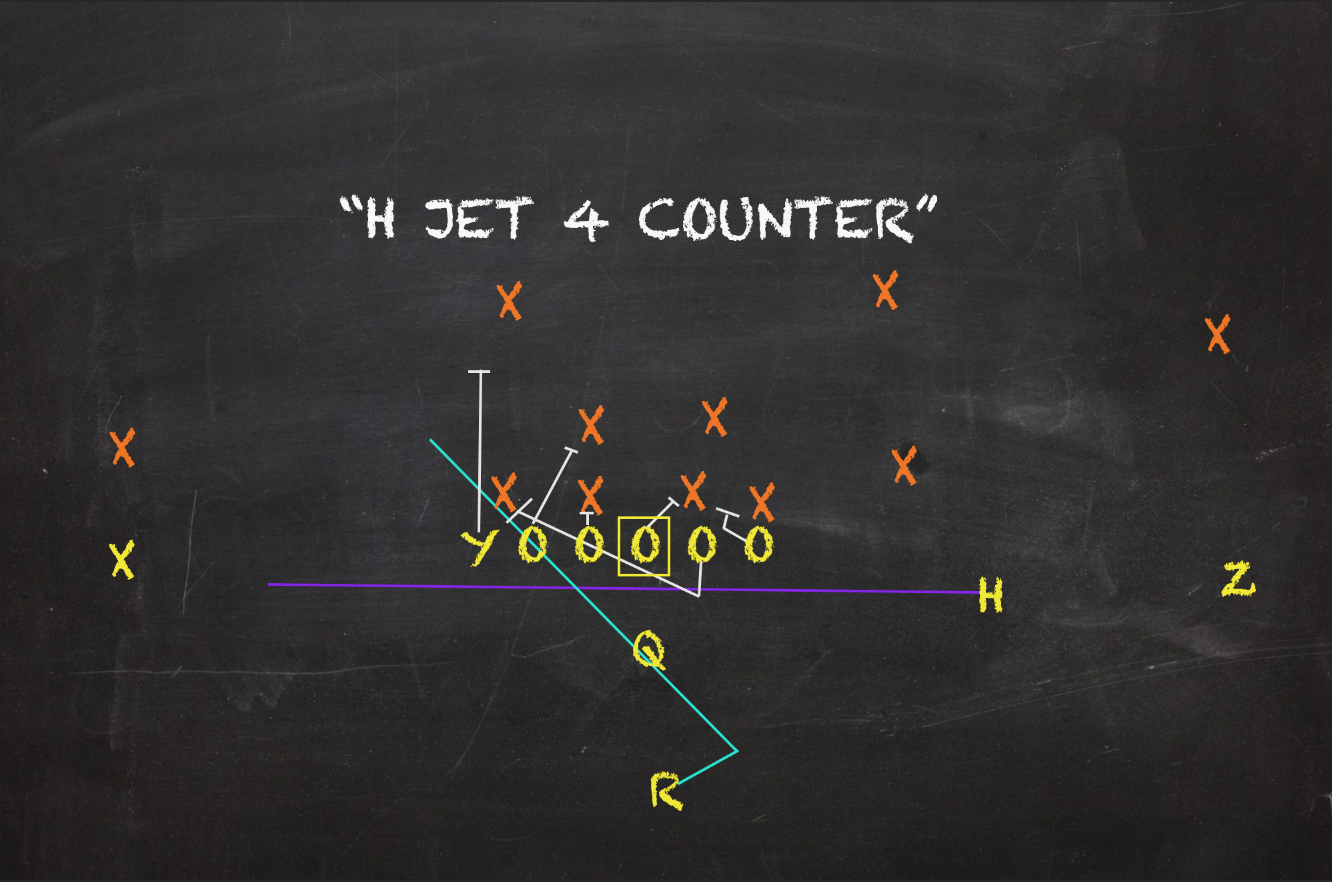
2. Counter 4.10% Play Share 4.66 Y/A 53.1% Success Rate
Counters are a natural rebuttal to over-aggressive fronts. Since zones are rather minimal in their direction and execution, they're often easier to snuff out for defenders coming downhill. Counters are misdirections that can play these run stopping zealots against themselves. Counters create a hard forged run lane with the help of downblocks and pullers away from the original action. Since the majority of Arkansas' offensive line was recruited to play this bashing style of play, a number of their power run looks were executed well.
Counters without a read aspect attached were some of the Hogs' most successful plays from 2019. While more plays averaged more yards per attempt than this classic misdirection, only a one could top its 53.1% Success Rate. The look's 16 1st Down reps are tied for the second most of any concept to start a set of downs. On firsts, Arkansas averaged 5.25 per Counter despite a slight downswing in Success Rate to 50%. Among the Razorbacks' six most called plays on that down, only Power Veers averaged more yards. Unlike their read option Counters, the vast majority of these were either from the pistol or undercenter. Counters amassed 149 yards this season for the Razorbacks, which was the fourth most of any concept.
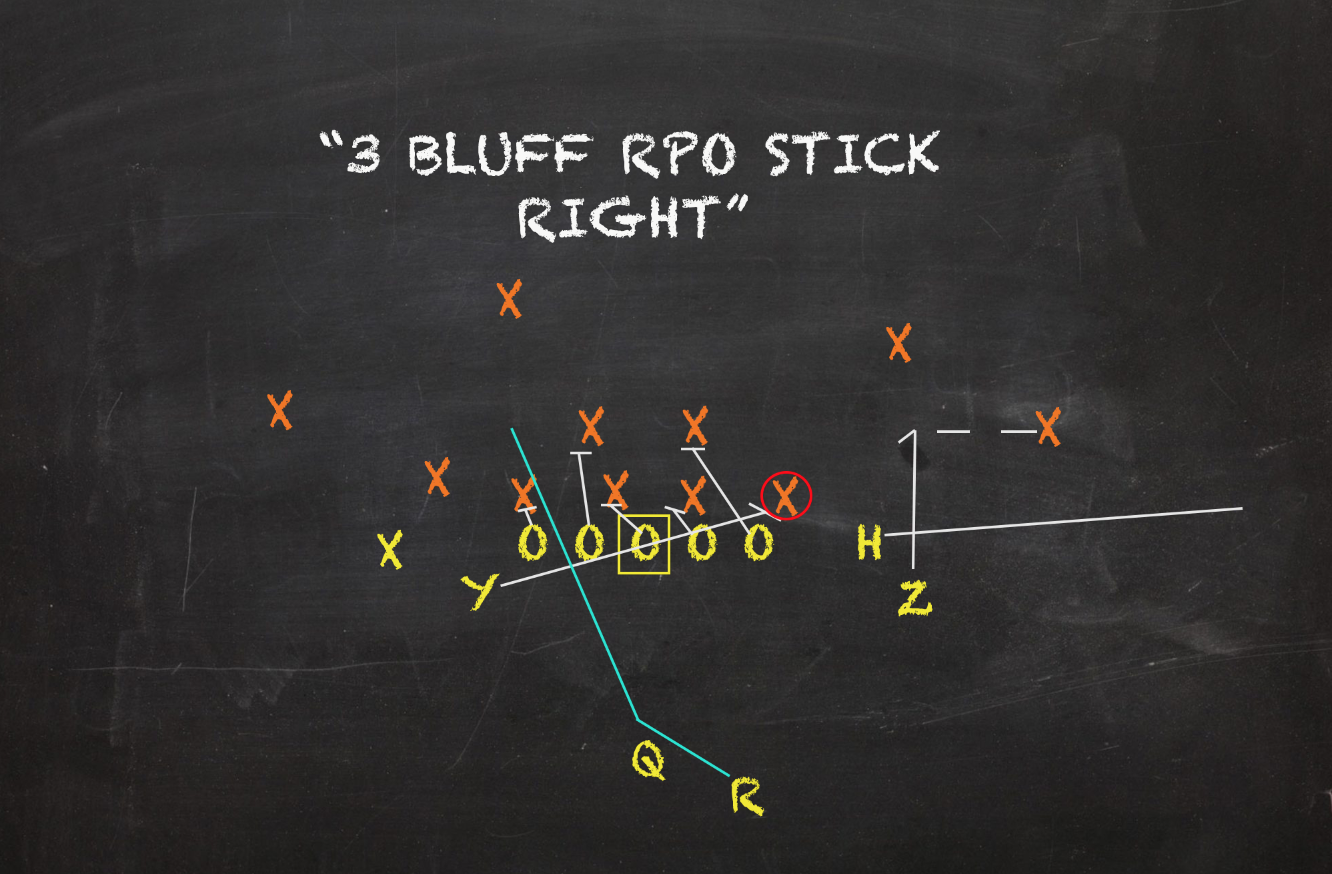
3. Inside Zone Bluff Read 4.10% Play Share 5.50 Y/A 37.5% Success Rate
Like its Slam Read brother, Inside Zone Bluff Reads were another lackluster look for Arkansas' offense. Everything between the two concepts is essentially the same barring one key wrinkle. Bluff Reads are Split Zones and call for an offset tight end or full back to fire against the playside zone flow towards the backside to set a hard edge. In the read game, this blocker frequently becomes a personal protector for the QB should he choose to pull it. But like Slam Reads, Arkansas' two main signal callers were just as reluctant to run the ball on Bluff Reads. Though slightly better in terms of Success Rate, these averaged over a yard less per attempt than Slam Reads. Also like Slam Reads, Bluff Reads posted their worst figures on first downs where they only averaged 3.0 yards/attempt on an appalling 29.4% Success Rate. Why is this a big deal? Bluff Reads shared the second most reps on firsts of any concept for Arkansas offense with 17.
Overall on Inside Zone Reads, the Razorbacks found their best gains hitting the middle right quadrant where they averaged a robust 9.07 yards/carry. Morris smartly directed 50% of Arkansas' Inside Zones towards that quadrant. Middle left carries averaged a mere 3.19 yards/carry. Despite the massive differential in that department, middle right Inside Zone carries only posted a Success Rate of 36.7% compared to 34.0% on middle left tries. When their carries bounced outside, Razorback ball carriers posted sufficient results. But, only about 10% ended up doing so. At the end of the day, only Slam Reads gained more yards for Arkansas' offense on the year.
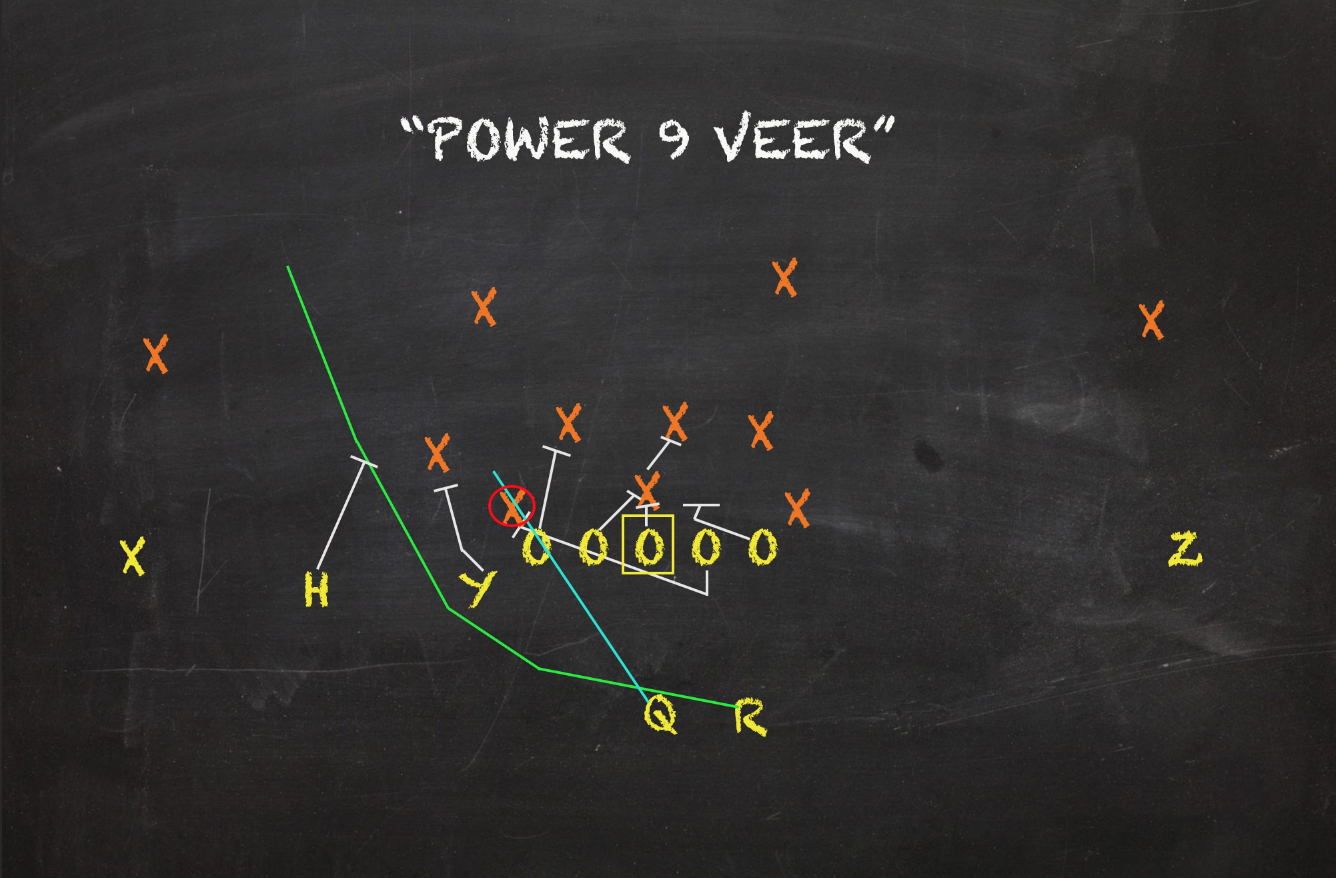
4. Inverted Power Veer 2.94% Play Share 6.09 Y/A 43.5% Success Rate
Most read options send the two potential ball carriers towards opposite sides of the center. Inverted Power Veers, on the other hand, aim to overload one side of the formation with its run read. Also twisting a typical read option maxim, the quarterback acts as the dive player looking to get north and south while the back hits the edge. When Arkansas was trying to right it's ship with Hicks and Starkel, Power Veers were not apart of these offense's script. Like on Inside Zone Reads, the two failed to log a single rep on any Outside Power Read concept. The other passers on the roster, however, were more mobile and equipped to execute this design. 22 of the look's 23 reps this season came after the Texas A&M game that all but took the wind out of the Razorbacks' sails this season. Ten were called over the course of the last three games making up over 5.2% of play calls in that span.
In the back half of the schedule, Power Veers were one of the Hogs' favorite plays to start a set of downs. Its 14 reps on firsts were the fourth most behind Slam Reads, Bluff Reads, and nonread Counters. On 1st Downs, no other look among Arkansas' six favorite averaged more yards per attempt. In general however, Inverted Power Veers were fairly consistent across all downs and delivered middling Success Rates.
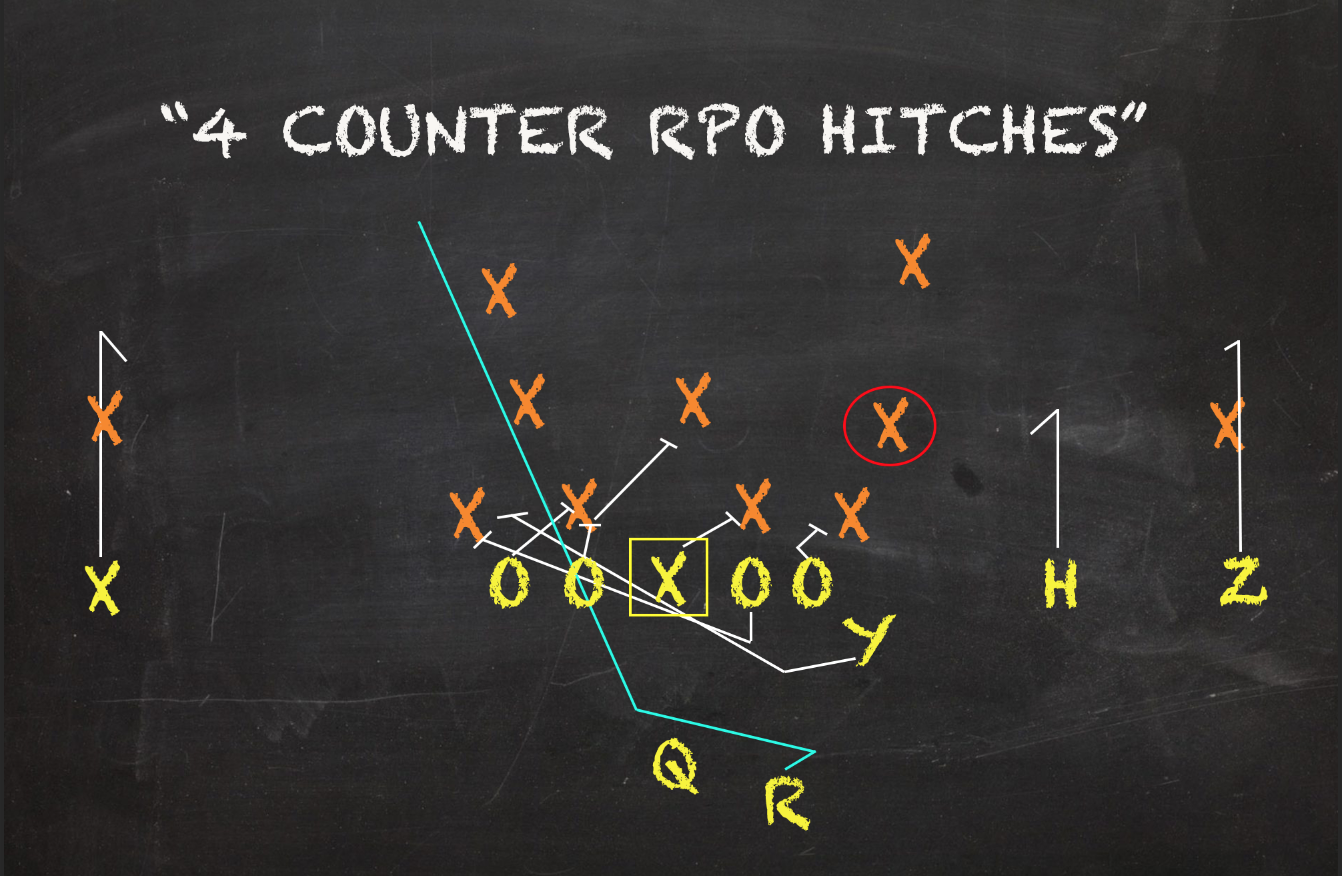
5. Counter Read 2.56% Play Share 4.60 Y/A 50.0% Success Rate
Counter Reads were one of the Hogs' most successful plays. Among their five favorite run concepts, only their nonread brethren posted a better Success Rate. Counter Reads were Arkansas' second favorite play on second downs only trailing Inside Zone Slam Reads. 12 of the look's 20 reps occurred in those spots. Counter Reads -- like other Inside Power Reads -- were minimum threshold plays. Meaning, they didn't really result in explosive gains despite its above average Success Rate. Counter Reads averaged the lowest yards/play of any of their favorite runs.
Boyd was overly this offense's best player and some of his best gains were off Inside Power Reads like these. About 62% of those tries went his way, and Boyd accumulated 85% of the team's rushing yards to the tune of a 53.9% Success Rate. While running behind their right guards yielded great results on Inside Zone Reads, Inside Power Reads saw their best yards/attempt on middle left carries. Let's remember, most power runs call for a backside guard puller. So those maulers to the right were the pullers on these Counter Reads. Regardless of what power read look they ran, Arkansas averaged 6.18 yards/carry on middle left runs compared to just 3.33 when running mid-right. Their Success Rate in these spots followed suit. Arkansas's clip was six percentage points higher on middle left runs compared ones towards the middle right.
Arkansas' favorite pass looks
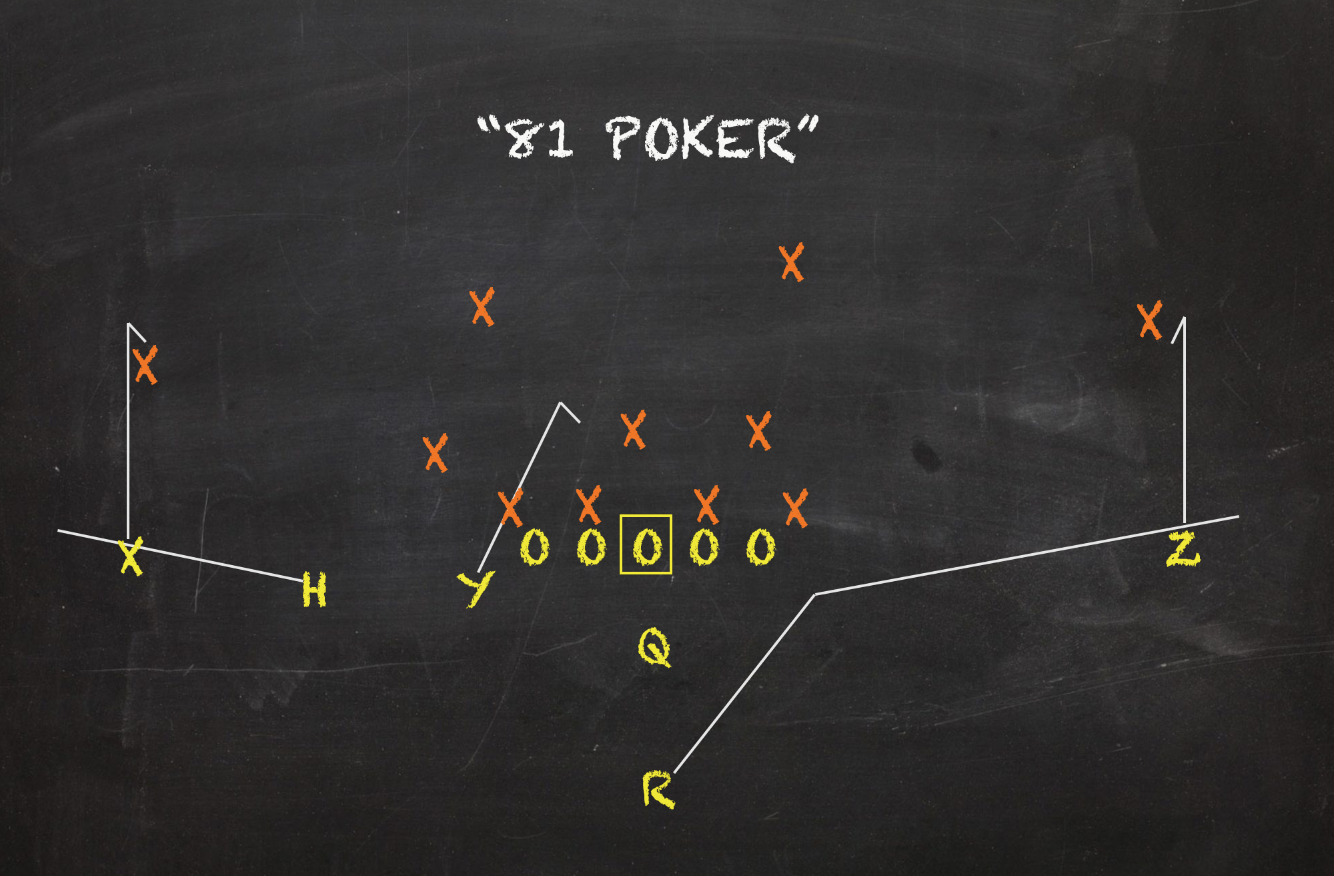
1. Spacing/Curl+Flat Combos 2.56% Play Share 2.68 Y/A 26.2% Success Rate
While their run game liked to hone in on a half-dozen or so concepts, Arkansas' pass game was much more diverse. That's because no matter what they tried, nothing really worked consistently. Still, one basic design kept showing up in their script more than the rest: Spacing and Curl+Flat combos. Designed to pester and win against Cover 3 zone, Spacing and Curl+Flat combos are seen in every level of football. While bland and boring, this design can provide easy completions and can manufacture open receivers based on alignment with great ease.
Despite the conservative nature of Spacing and Curl+Flat patterns, Arkansas' passers couldn't consistently win situationally when targeting this concept. Even though Hicks and Starkel combined to complete 75% of their attempts on this concept, less than a third of those tries ended in success. No other play within their five most called runs or passes finished with a worse yards/play or Success Rate. On 3rd Downs, execution couldn't get any worse. Despite sharing the 3rd most attempts of any concept on those downs, not a single target resulted in a conversion.
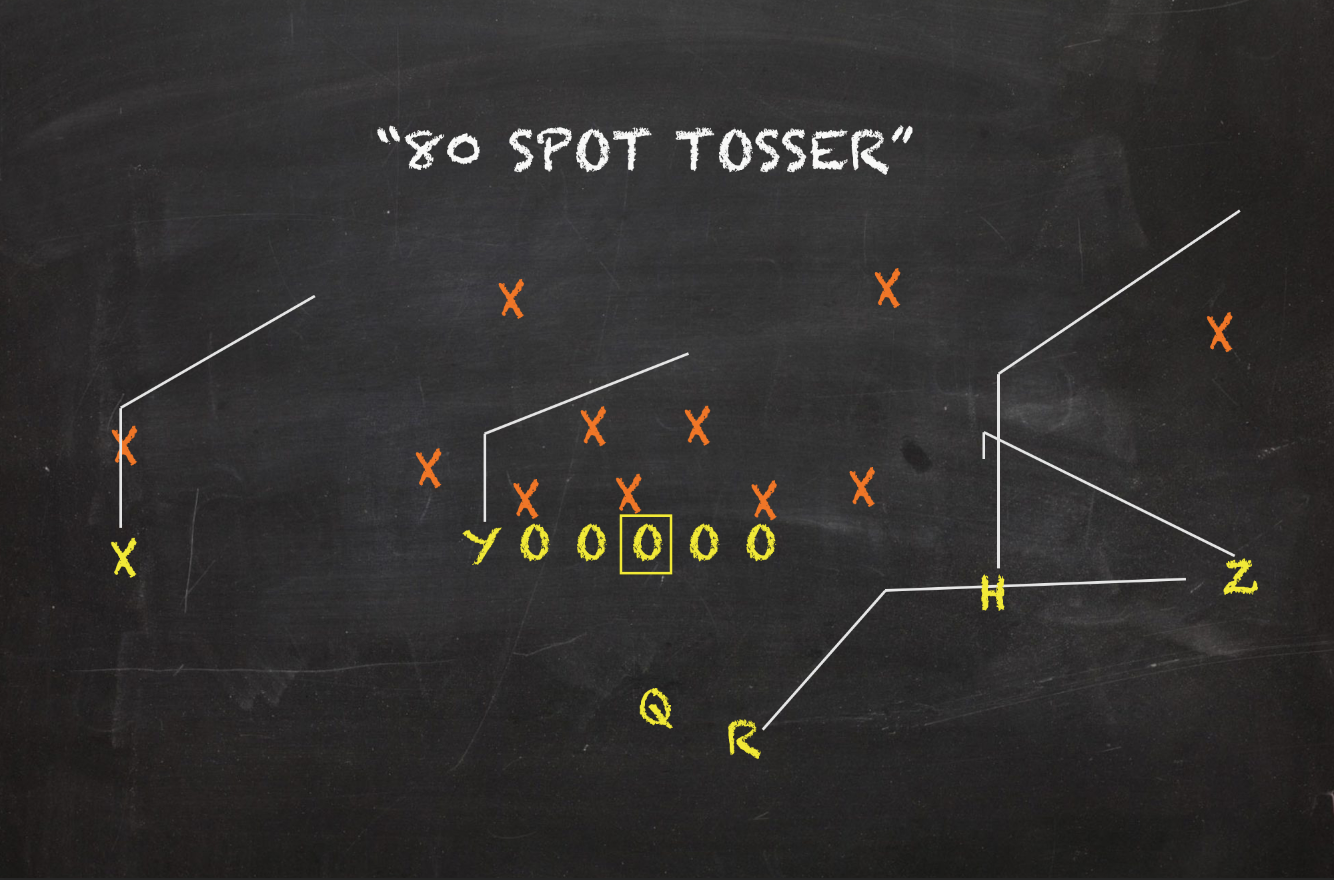
2. Tosser 2.43% Play Share 6.42 Y/A 47.4% Success Rate
Another rather basic combo Arkansas liked to call was the Tosser concept, which calls for dual or all slants. While part of their RPO stuff, Tosser was mostly targeted in the dropback game. A common combo to pair with zone-beating designs, dual slants were one of Arkansas' most successful plays despite a clip under 50%. In fact, a number of them were paired with Curl+Flat combos. A Spot concept is another look you'll see Tosser coupled with frequently.
With defenses not donning them much respect, Arkansas routinely faced pressing man coverage. This usually presented tighter windows and more crowded passing lanes. Slant Variations can provide avenues around in-your-face coverages but are reliant on the route running ability and quickness of the players executing them. Unlike Curl+Flat combos that ask for players to sit in the hole of zones, slants mostly don't get that luxury. Tosser was one of the Razorbacks' most repped plays on the money down. But only one of the concept's six targets moved the chains on 3rd Down.
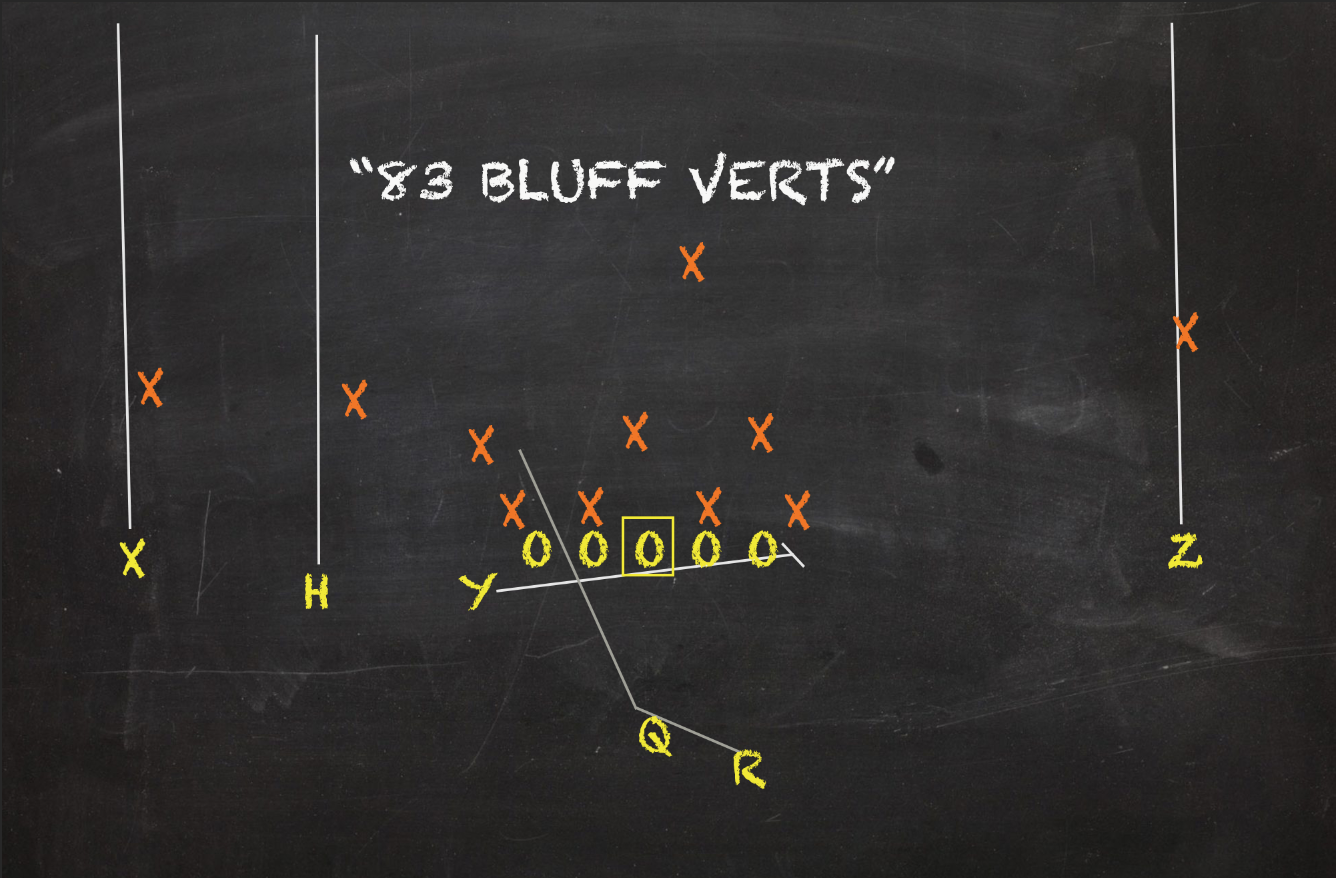
3. All Verts 2.43% Play Share 5.79 Y/A 31.6% Success Rate
When you are a team like Arkansas that found itself behind the chains a whole lot, sometimes there is no perfect play to dig out of those holes. Sending a few dudes deep on a go route and chucking it far doesn't require a lot of football IQ. Yet, there are times where those are the most effective plays. Like their passing game in general, Arkansas sucked when targeting All Vert patterns -- or any deep concept for that matter. All Verts were mostly called on early downs for the Hogs with 15 of the look's 19 reps occurring on their 1st or 2nd Down. Half of their targets on seconds resulted in success.
Overall, five of Hicks' and Starkel's combined 11 attempts targeting All Verts were completed. Dismissed tight end Cheyenne O'Grady and freshman wideout Treylon Burks were Arkansas' two favorite targets on these play as the two received seven and five, respectfully. Five of the six successful All Vert reps targeted these two players. The other Razorback passers only combined to go one for five on their attempts. Three of the play's reps failed to generate a logged attempt.
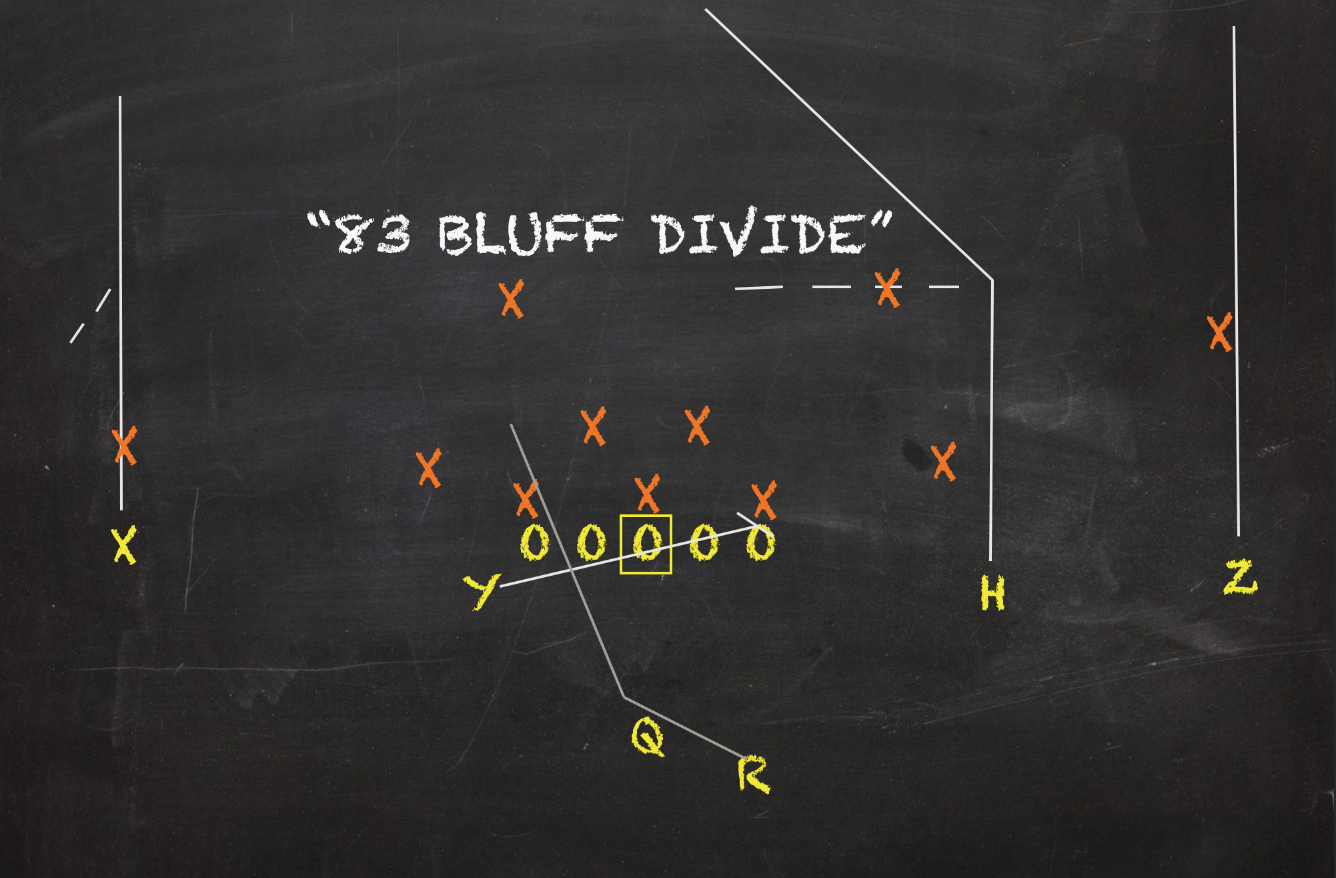
4. Divide 2.16% Play Share 9.12 Y/A 29.4% Success Rate
The Divide concept is a member of the Shot family and is very similar to All Vert patterns. But, there is one key difference. While it's not uncommon for verticals to morph into other routes on the fly based on what zone they are attacking, the Divide concept will always see a post or dig paired with outside verts. The middle route's goal is to occupy safeties. The concept's name comes from the fact that route strives to "divide" the safeties by splicing right through them. While every staff has their own coaching points, a general rule of thumb is a dig versus two-deep and a post versus one-deep coverages.
No other look among Arkansas' five most called runs or most targeted passes posted a higher yards/attempt than Divide's 9.12 clip. A favorite off a heavy play fake, this concept accumulated 155 yards for the Hogs this year. No other pass play generated more. Ten of Divide's 17 targets occurred on 1st Downs where they only averaged less yards/attempt than Counters and Power Veers. In general, Arkansas executing these plays poorly.
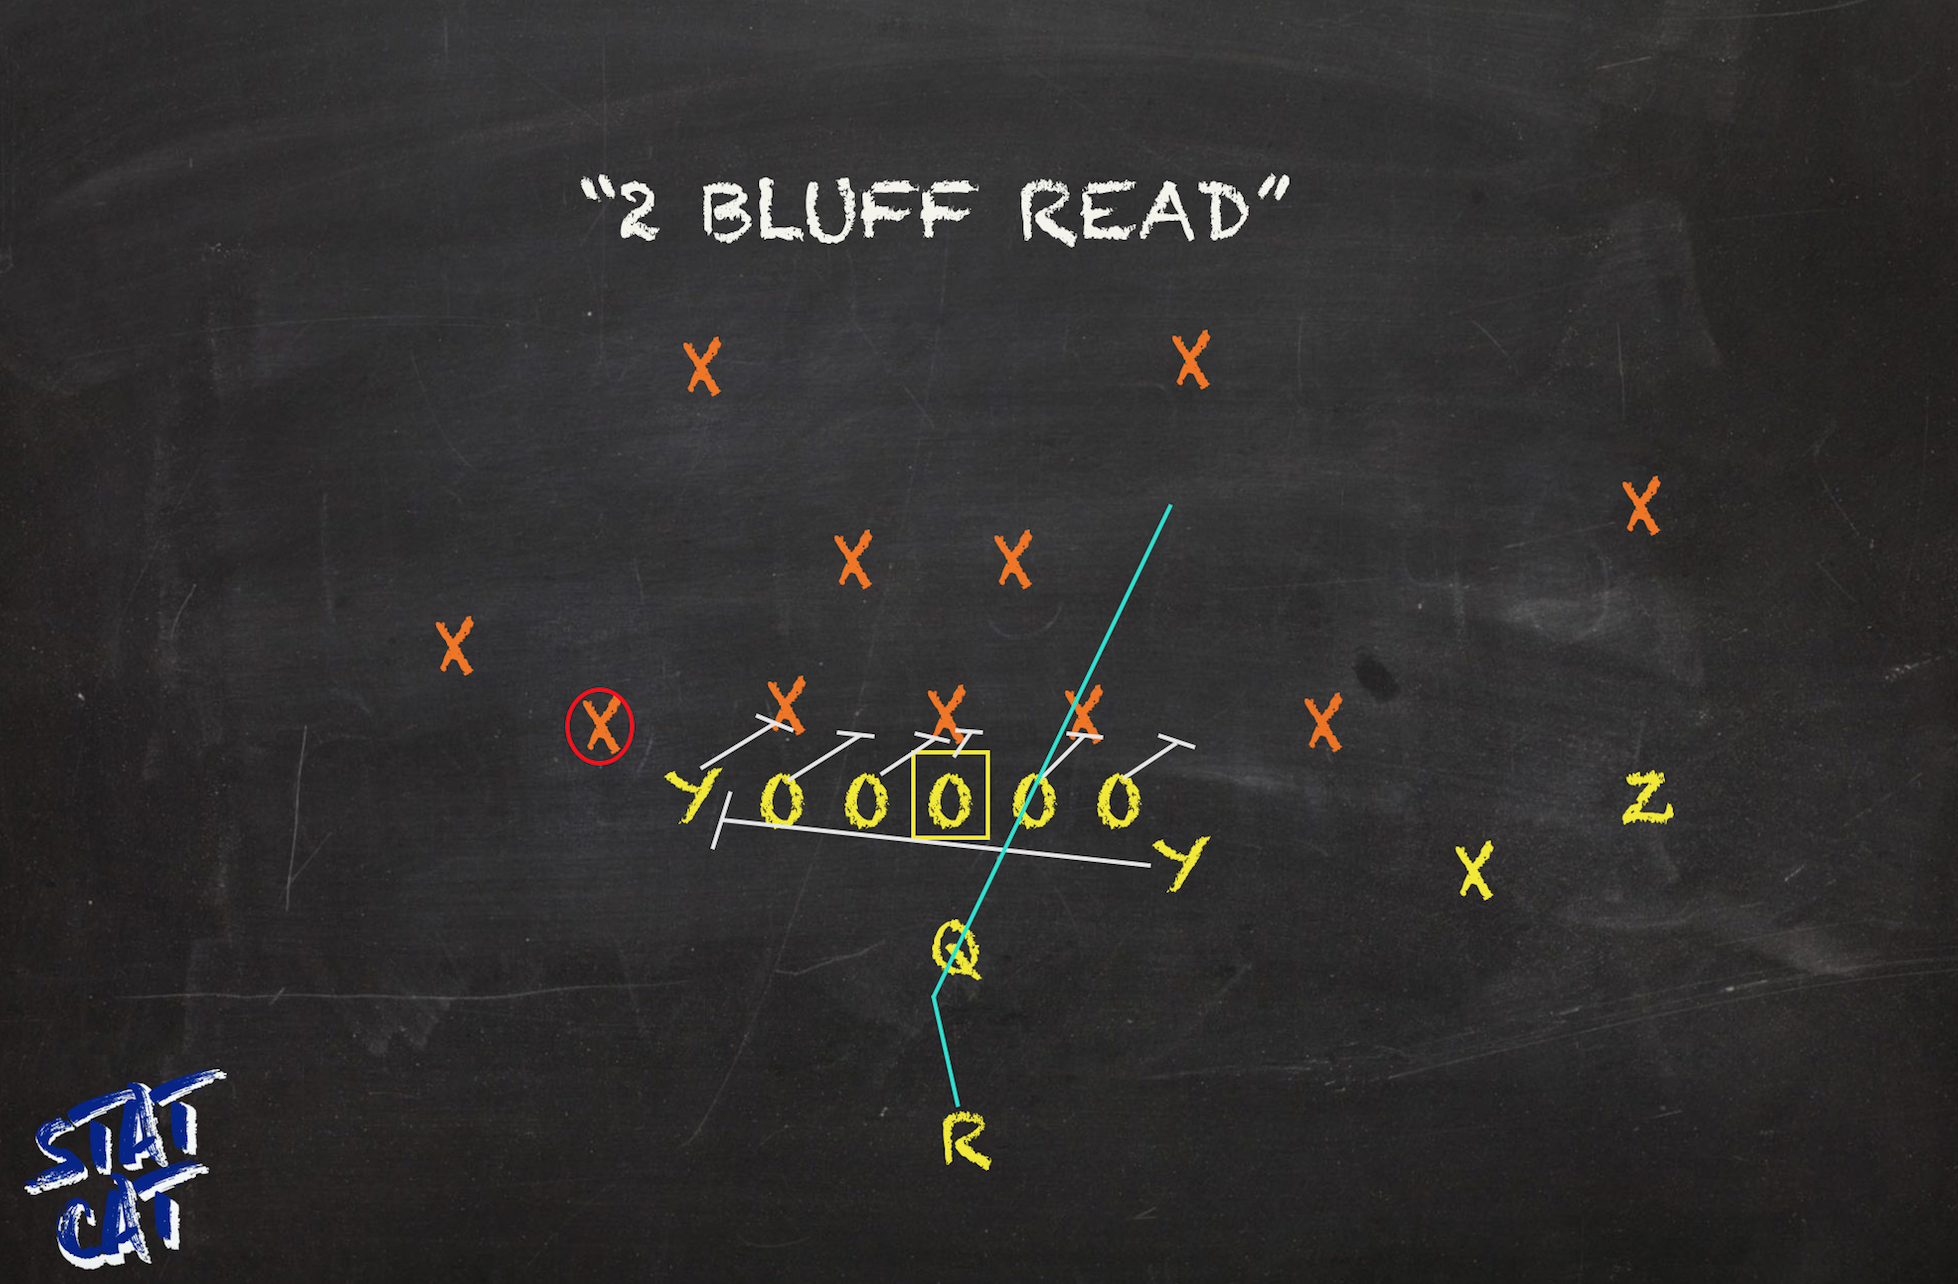
5. Wheelie 1.92% Play Share 4.87 Y/A 20.0% Success Rate
Oh look, another vertical pass concept that's among Arkansas' most run. Morris has an affinity for Switch Variations since they are great two-deep beaters that also stretch the field deep. While only 28 Switches were logged this season, they remain a staple concept of his when he trusts his passer. Even with a group that left much to be desired, the "Wheelie" Switch rounded out Arkansas' five most targeted pass concepts. This look is named due for the titular wheel route from the inside receiver. The outside man will either run a post or a dig.
Though Wheelies got plenty of tries, it wasn't because of its production. No other concept among their favorites had a Success Rate so low. Shortcomings on the do or die down doomed this concept's returns. On thirds, Wheelie saw 5 targets - tied for the fifth most of any look. But on those tries, zero of its reps resulted in a first down and the look averaged -1.0 yard/attempt.
Chalking up Arkansas' most successful looks
min 1.3% Play Share
1. Outside Zone Read 1.41% Play Share 7.00 Y/A 54.6% Success Rate
While Arkansas struggled mightily on Inside Zone Reads this season, their most successful look on the year was the Outside Zone Read. While the rules are the exact same between the two concepts, Outside Zones call for flatter blocking paths from the OLine. Since there is a greater emphasis to get outside, the blockers must reach their man to prevent them from funneling the run back towards the middle where all the defenders are. That is much harder to do the more vertical the zone paths are. Simply put, Outside Zone Reads should have been incorporated more into Arkansas' script. Only four concepts had a Success Rate over 50% for the Hogs.
2. Counter 4.10% Play Share 4.66 Y/A 53.1% Success Rate
Like I touched on, Arkansas best plays were consistently of the power run variety essentially because that's what the vast majority of the kids on their roster were brought there to do. Arkansas' second, third, and fourth most succesful concepts on the year are all power run plays. True Counters were their best. So, it's a pretty good thing that Morris ran these as much as he did. Because, who knows how bad their numbers would have been if he disregarded another fruitful look on the ground. They may not have a gaudy yards/attempt average, but Counters were consistent and helped Arkansas get situational gains.
3. Power Read 1.30% Play Share 8.60 Y/A 50.0% Success Rate
Power Reads were so seldom run in this offense that they barely meet our minimum repetition requirement to be included among Arkansas' best looks. But here they are. Power Reads are very similar to Counter Reads. While Counters have a misdirection element to them, Powers are more downhill and no-nonsense. Both pull a backside guard. But while Counters have a "trapper" and a "wrapper", Powers just have "wrappers" -- or lead blockers. Like Counters, Power Reads were a gap scheme the Hogs executed quite well. Of their five best concepts in terms of Success Rate, Power Reads own the highest yards/attempt average at 8.60.
4. Counter Read 2.56% Play Share 4.60 Y/A 50.0% Success Rate
While Outside Zone and Power Reads were successful looks that struggled to earn more reps despite being executed well, Counter Reads -- like True Counters -- were among both Arkansas' best and most run plays. But also like True Counters, Counter Reads didn't have the most electric yards/play average. While the read aspect did give their quarterbacks the option to pull and run, it was clear they were coached to treat that as their tertiary option. The vast majority of Counter Read play utilized route tags like Outlets Screens, slants, hitches, and fades.
5. Tosser 2.43% Play Share 6.42 Y/A 47.4% Success Rate
Arkansas only produced four concepts with a Success Rate over 50% and all of them were runs. The Tosser concept, which is our shorthanded term for labeling dual or all slant patterns, ended up as their top pass play. One of their favorite route tags to include on their read options, Tosser was the Razorbacks' second most targeted pass concept. While this look might be among their best, Arkansas' execution on these plays were still below average within the SEC. Across the conference in 2019, 235 Tosser concepts were targeted and yielded a 51.5% Success Rate on 6.6 yards per pop.
Where Arkansas' weapons ranked
Arkansas passing situation under Chad Morris was never ideal. In year one, holdovers from the Bielema era Ty Storey and Cole Kelly combined to total 16 TDs and 15 INTs (with plenty more fumbles) while completing under 58% of their passes. Two transfers were expected to accelerate the learning curve for this offense. Ben Hicks played in Morris' scheme at SMU and Nick Starkel was recruited to play in a similar scheme at Texas A&M. Despite the optimism heading into year two, 2019 was a repeat of what plagued this offense a year prior. Arkansas two main passers combined to toss only 9 TDs but accumulated 12 INTs. Like last year, the backups playing in spot minutes continued to hurt their overall passing numbers. Thought of as a "QB Whisperer", it's was a horrifically bad look for Morris to see his passers seemingly always in over their heads.
Hicks was much more conservative in the dropback passing game. Despite a lower average depth of target by about a yard, Hicks still failed to precisely place his passes regularly. The incessant pressure Hicks faced was a factor in that. Again, no SEC passer had a higher Pressure Rate than his 36.9% clip. But he still failed to get it done in clean pockets, too. Pressured or no, Hicks put up disastrous results in his final collegiate season. I mean just glance at the table above. Hicks finished bottom 5 within the SEC in each of those categories.While the two had equal opportunity to win the job, Morris had a hard time settling on either passer. Hicks -- thanks to his continuity under Morris and his scheme -- was given the first shot. But since both had different styles, Morris called games drastically differently when each passer was in the game. While each passer's Play Action Rate was essentially the same, Starkel was much more of a distributor via RPOs than Hicks. Predefined reads did Starkel well in this regard. It allowed him to post superior accuracy numbers long and short. Starkel even had a top 10 Depth Adjusted Accuracy% within the conference. But Starkel's biggest flaw was that he pressed and did so often. Despite being adequate in a few areas, he simply became unplayable due to his risky throws. On average, essentially one out of seven of his attempts this season could have resulted in an INT.

Even deep into the schedule, the two kept jockeying for playing time. Not because either was performing to expectations but rather the exact opposite. After the first half of the Mississippi State game in Week 10, it was clear both of their chances had emptied. Over the course of the last three games, Starkel's time in Fayetteville concluded after a 3-10 showing for 34 yards versus LSU and Hicks' ended with a 1-5 showing for 2 yards against Missouri.
Like I touched on above, Starkel was much more inclined to sling it into tight windows than Hicks even though Morris had him run more RPOs. Living by the Bruce Arians mentality "No biscuit unless you risk it", Starkel tried to be Superman too much. Sure, Arkansas basically played from behind the entire season. So there was a need to be more aggressive to dig into those deficits. But Starkel pressed his luck far too often. When pressured, he did manage to have a top5 Depth Adjusted Accuracy within the SEC but his bottom 5 Interceptable Pass Rate offsets any sheen from that. Its almost unbelievable, but over a quarter of his pressured attempts could have ended up as turnovers. His clean pocket production, however, was much more worrisome. Under "perfect" conditions, over 10% of his attempts were put into harm's way even if his other clean metrics placed within the middle of the road of SEC passers. While Hicks' Success Rate under duress was nearly seven percentage points worse than his overall clip, Hicks actually shot up in the rankings on pressured dropbacks relative to the rest of the conference. But there's no ignoring his accuracy took a hit when he faced pressure. Hicks' Depth Adjusted Accuracy% under duress was about 20 percentage points lower than his clip in clean pockets. Still, Hicks finished with a bottom 5 Passing Success Rate, Depth Adjusted Accuracy, and First Down+Touchdown Rate when not facing pressure.

Starkel was on of the most effective SEC passers outside the numbers. These attempts were often deep balls as his average depth of target of 16.1 was the fifth highest in the conference. Yet, his Success Rate ranked just as high. He was mostly mediocre to bad targeting other areas of the field. He was particularly lackluster on throws from the numbers to the hashes where he had a bottom 5 Success Rate. Even Hicks was more successful there - albeit just barely. The dropback passing game was not their strong suit. Hicks' game was dependent on decision making and managing the game. His arm is not what I consider top-level by any stretch. So when he couldn't make sound decisions and keep the Hogs in decent down and distance situations, his skill set often left Arkansas S.O.O.L. Regardless of the area of the field he targeted, Hicks just couldn't produce consistently. His accuracy clips were bottom 5 across the board, but his worst attempts came throwing outside the numbers. Less than a third of those throws resulted in success and even fewer were deemed as accurate. Even with the fifth lowest average depth of target outside the numbers, Hicks' noodle arm just couldn't get it done. At least Hicks was able to break the 50% barrier inside the numbers. But, I am not going to pretend what he did overall was anything about which to be boastful.

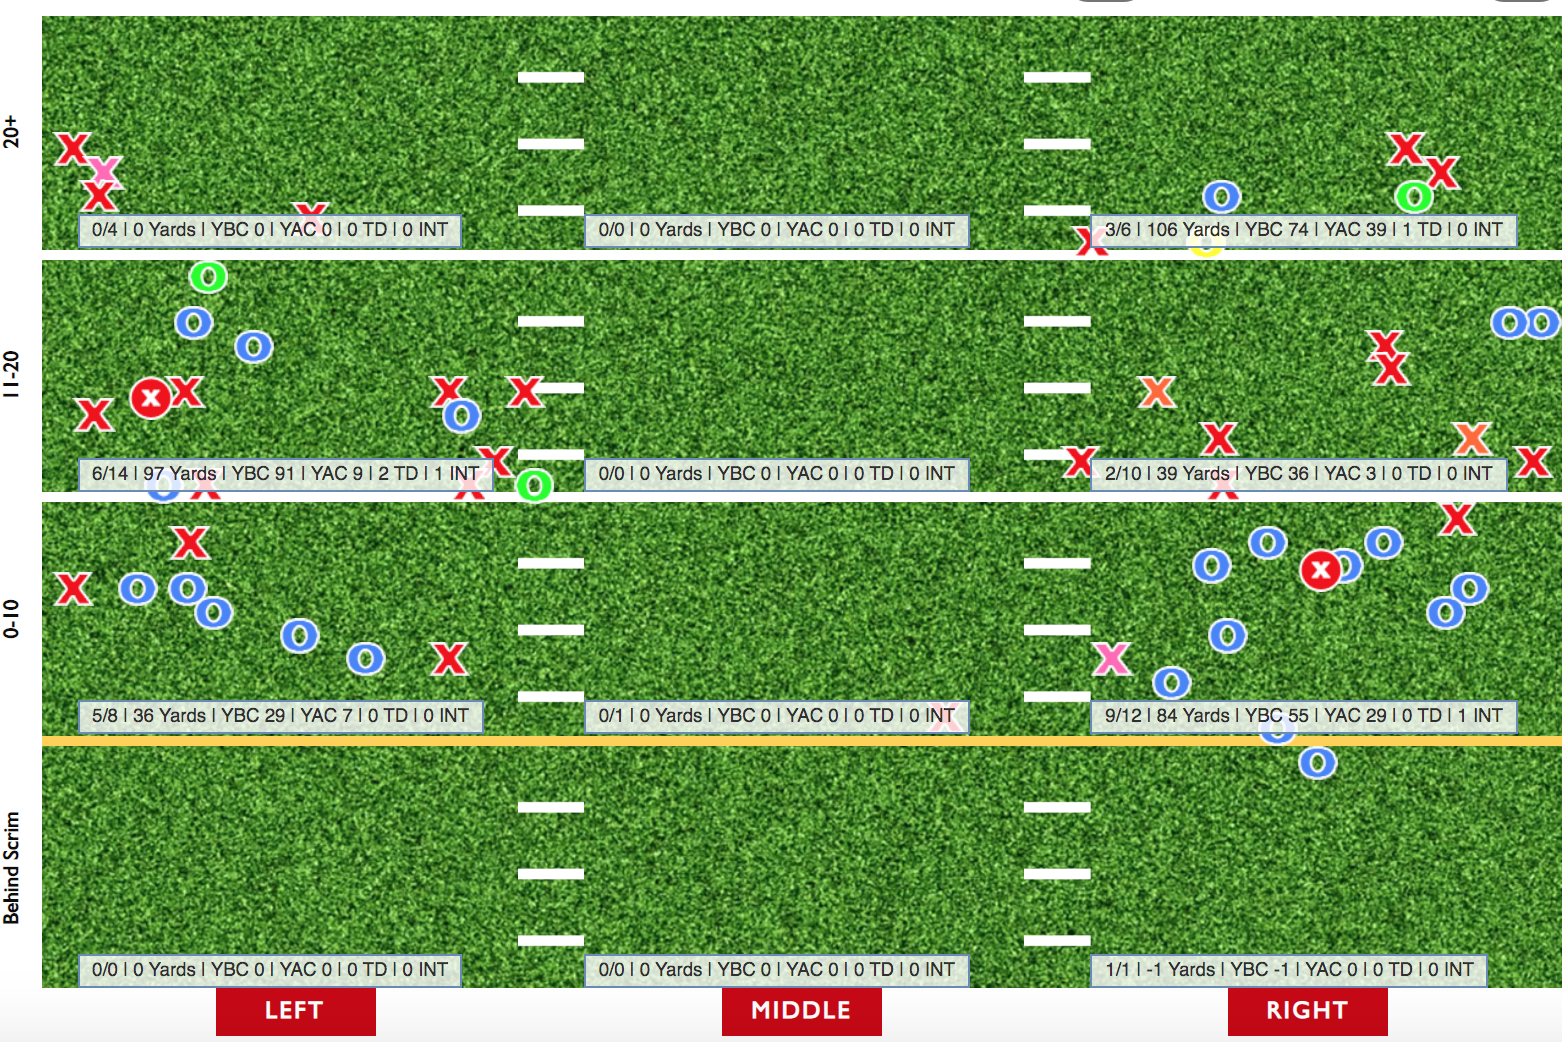
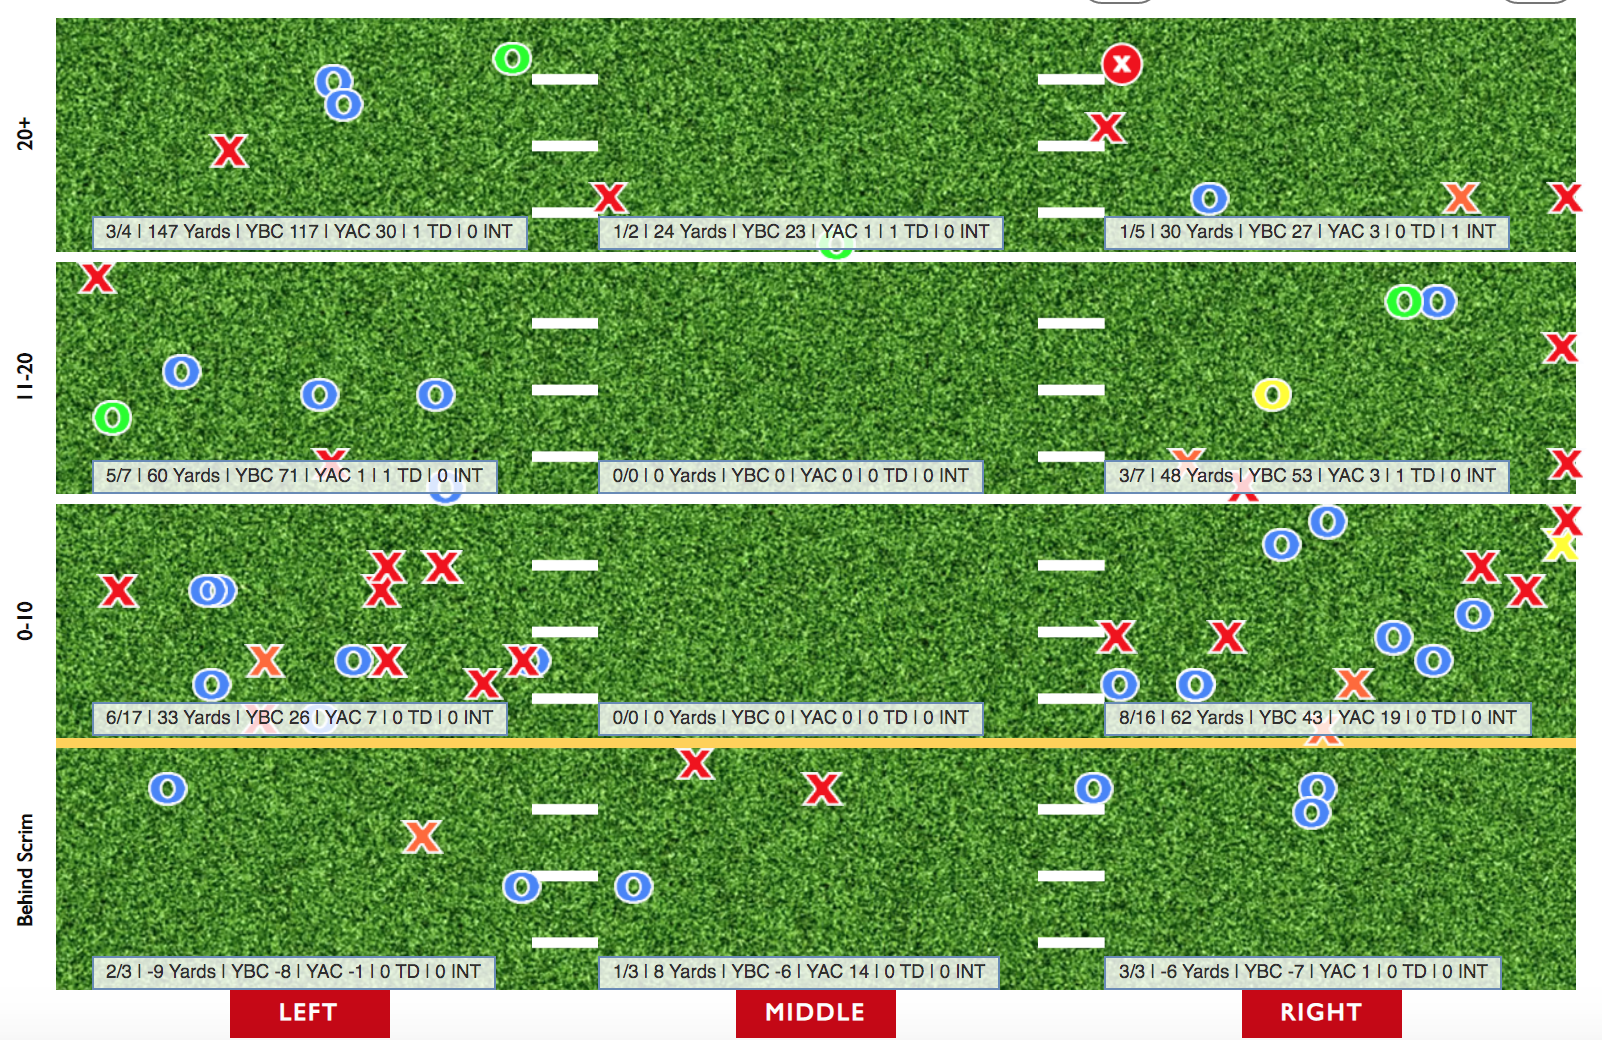
I mean, just glancing below at the tandem's pass charts should paint a clearer picture of the two's shortcomings slinging the pill. Hicks (bottom left) only completed 36.5% of his passes that traveled more than ten yards downfield and his targets created four receptions for themselves. Starkel (bottom right) had an even lower Completion% on those chances. While he was more accurate in some respects, we already mentioned his knack for locating defensive backs with his passes. His receivers only created one reception for him on targets over ten yard downfield.
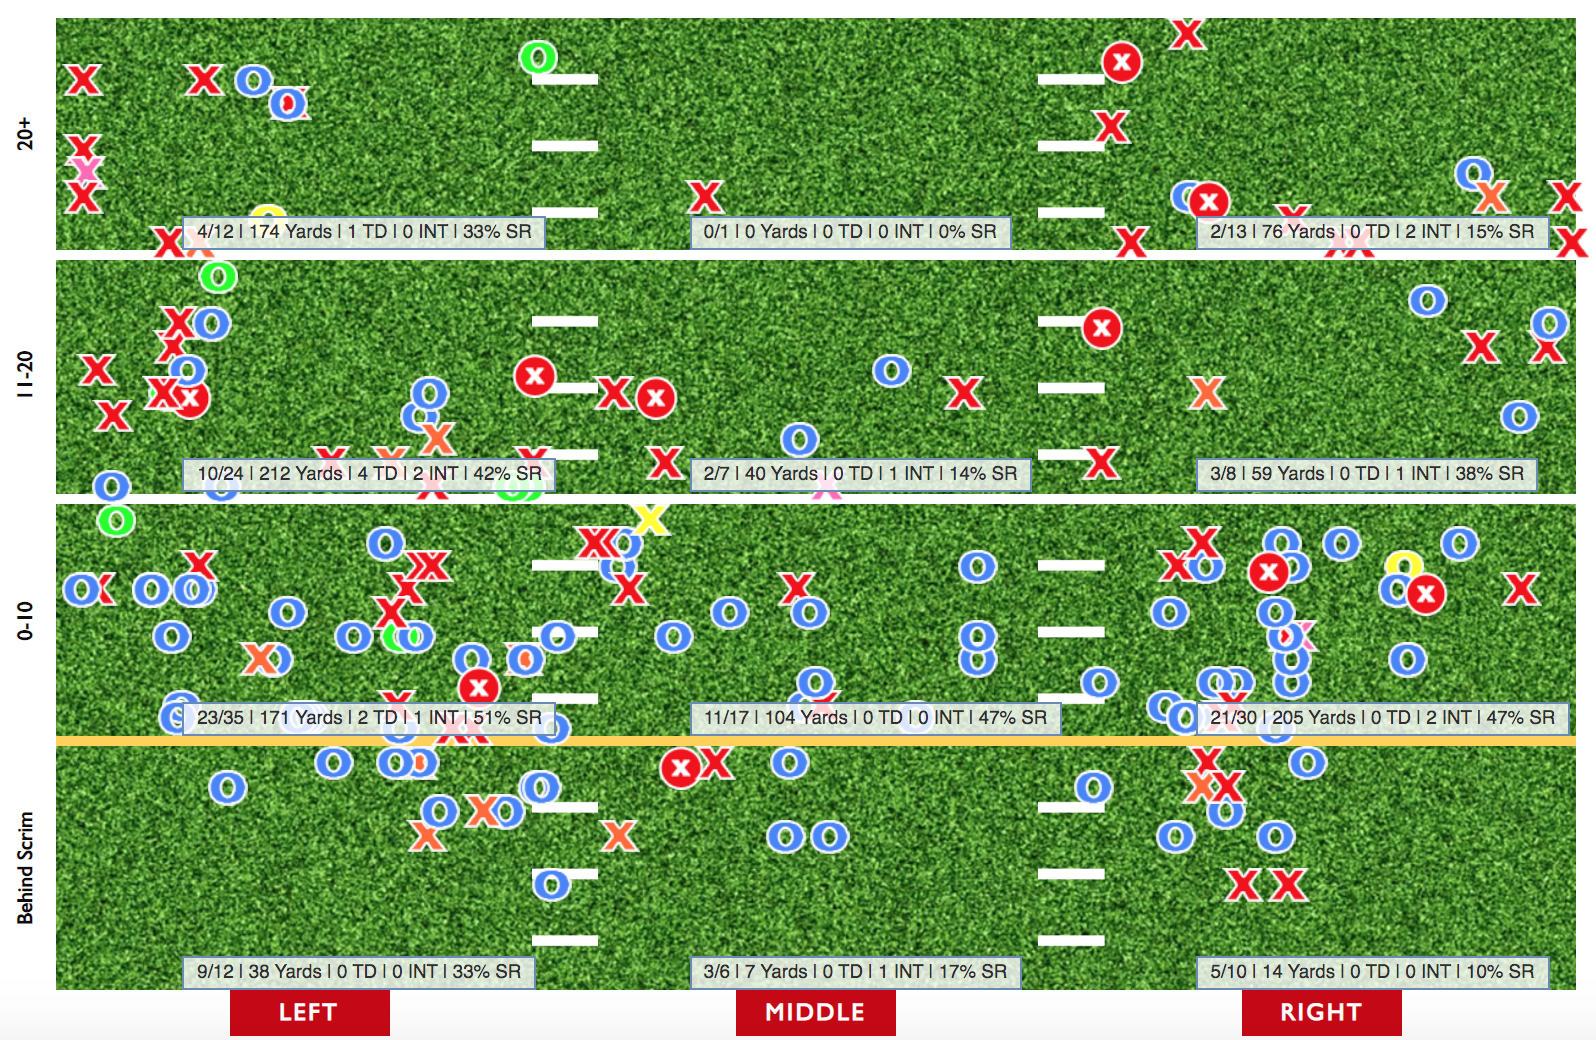
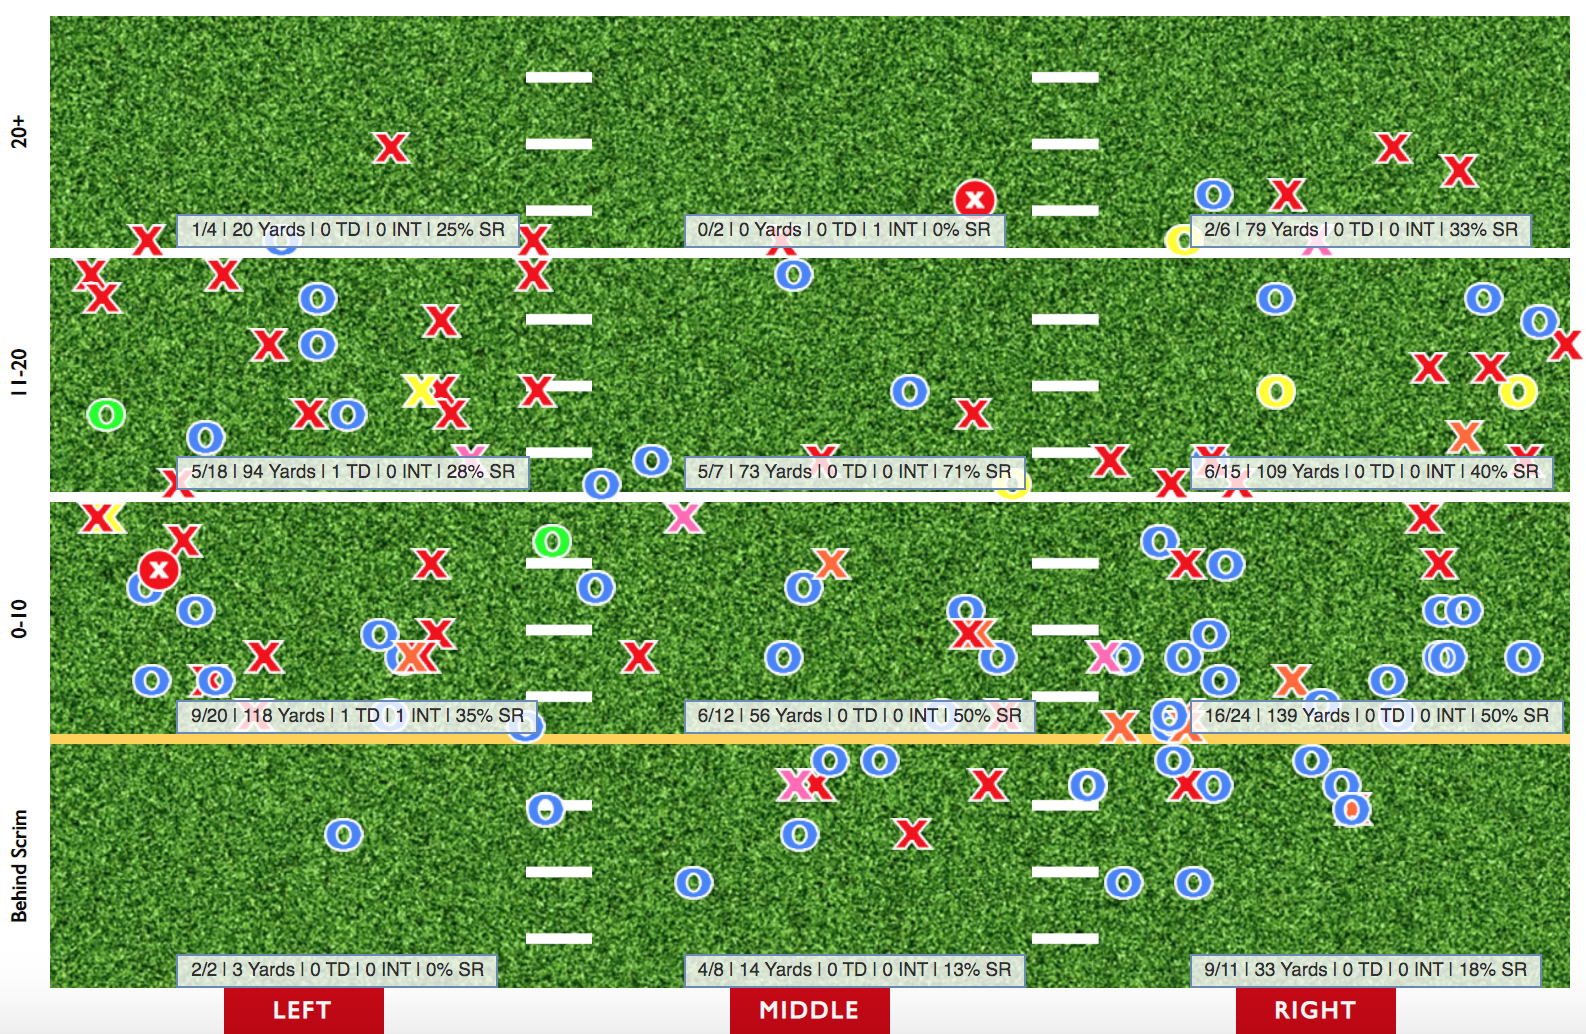
With scattershot passes frequently coming their way, Arkansas' receivers were left holding the bag. All four of their main targets comfortably sat in the back half of conference players in Uncatchable Target Rate. Mike Woods in particular, the Hogs leader in targets, had the third worst rate in the SEC. As you can surmise, the gang's Success Rate suffered greatly. While it wasn't all on them, Arkansas' receivers were one of the worst units in the conference.
O'Grady's dismissal created a void in the Hogs' passing game. Burks became Arkansas' favorite target down the stretch. No Razorback receiver saw more targets (26), catches (10), or yards (177) during their last four games. Too bad his Success Rate in that stint was a woeful 30.8%. (To be fair, Arkansas third, fourth, and fifth stringers were not the most talented passers). His upswing in production should have Hog fans slightly giddy. I mean it's hard to find the silver lining in an offense like this. But as a youngster, Burks had the team's top yards/target (7.59), Explosive Catch Rate (15.9%), and First Down+Touchdown Rate (36.5%). With the tenth most deep receiving yards in the SEC a year ago, there's no doubt he will be looked upon as a downfield threat regardless of what scheme they'll deploy. Plus, Burks was the only one of Arkansas' main receivers to not finish inside SEC's bottom 12 in terms of Catching Success Rate. But looking at his Catch Chart (below left), you can see what he was up against. Three of his five deep catches were creations. Whether long or short, Burks was one of the better receivers to come down with a contested target. Cheyenne O'Grady was thought to be this offense's best receiving option coming into the year. But rocky situations outside of the sidelines limited his final season in Fayetteville. His volume numbers were absolutely going to take a hit due to the fact he only played in seven games. But his advanced analytics don't point to rosy numbers either. In the seven games he played, he saw ten more targets and nine more catches than the next closest Arkansas receiver. During that stint, his 14 first down receptions also led the team. There's no need to get into the specifics why he was dismissed. But once Arkansas lost its one of the SEC's premier matchups weapons, there was no recovering. O'Grady posted the SEC's fifth best Contested Catch Rate. His 33 catches and 3 scores were tied for most and second most on the team, respectively. Despite being thought of as vertical, he only had 3 deep targets per has Catch Chart (bottom right).

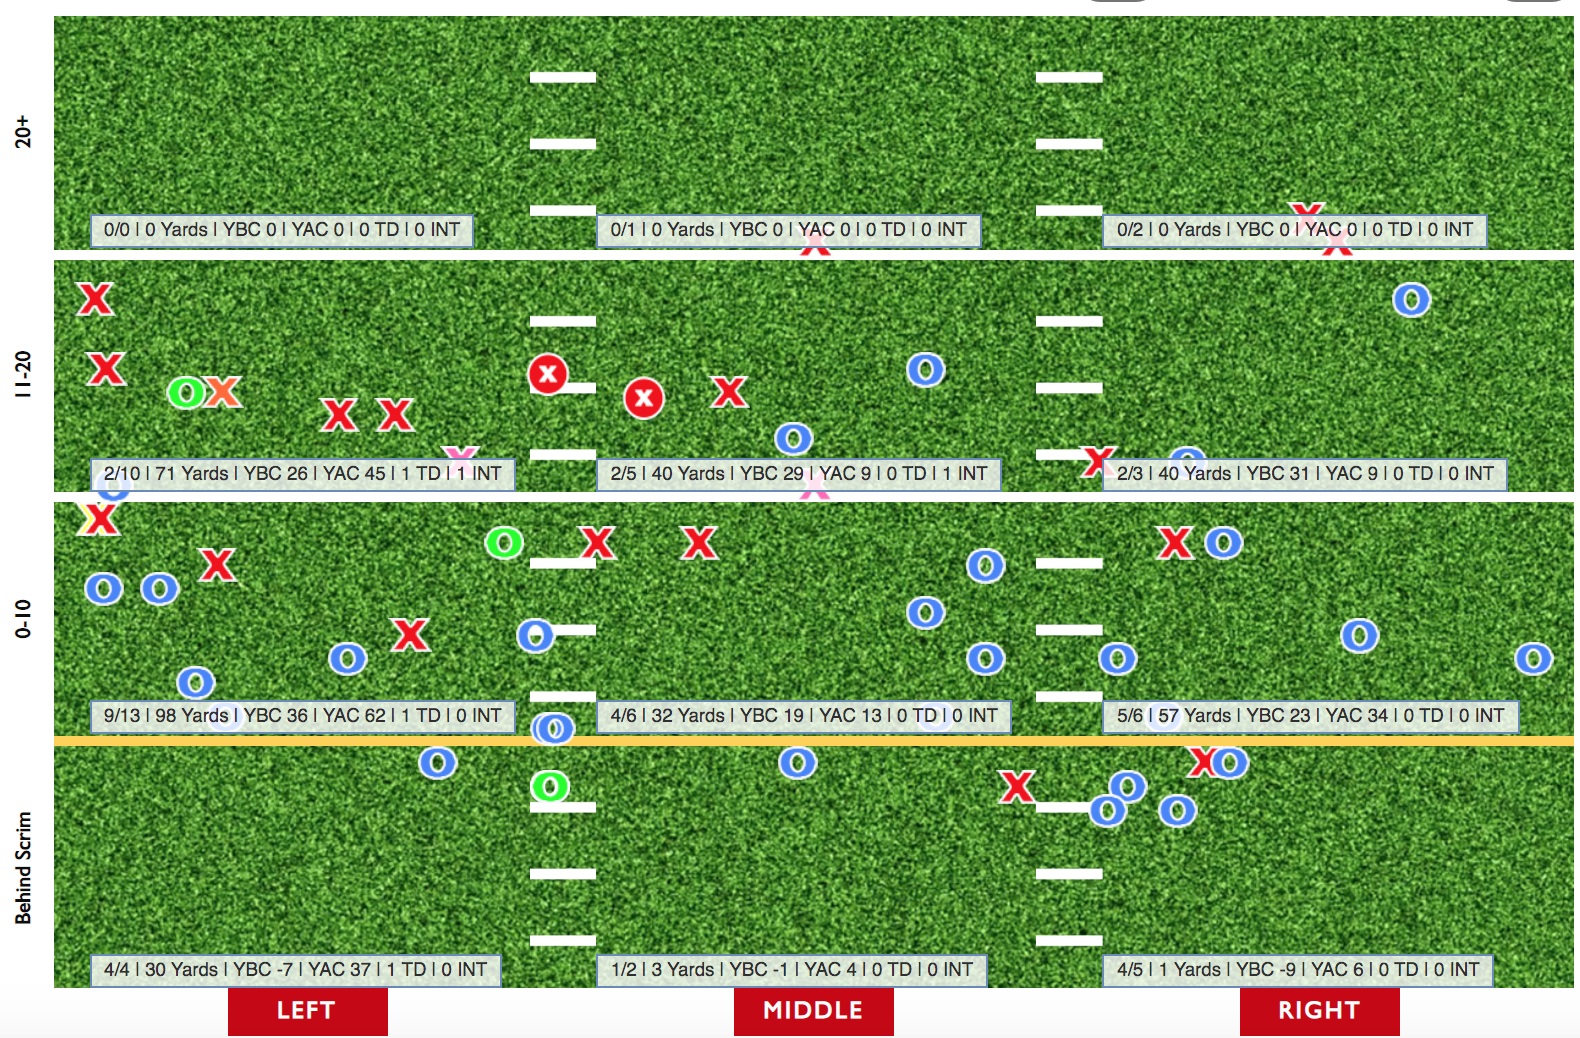
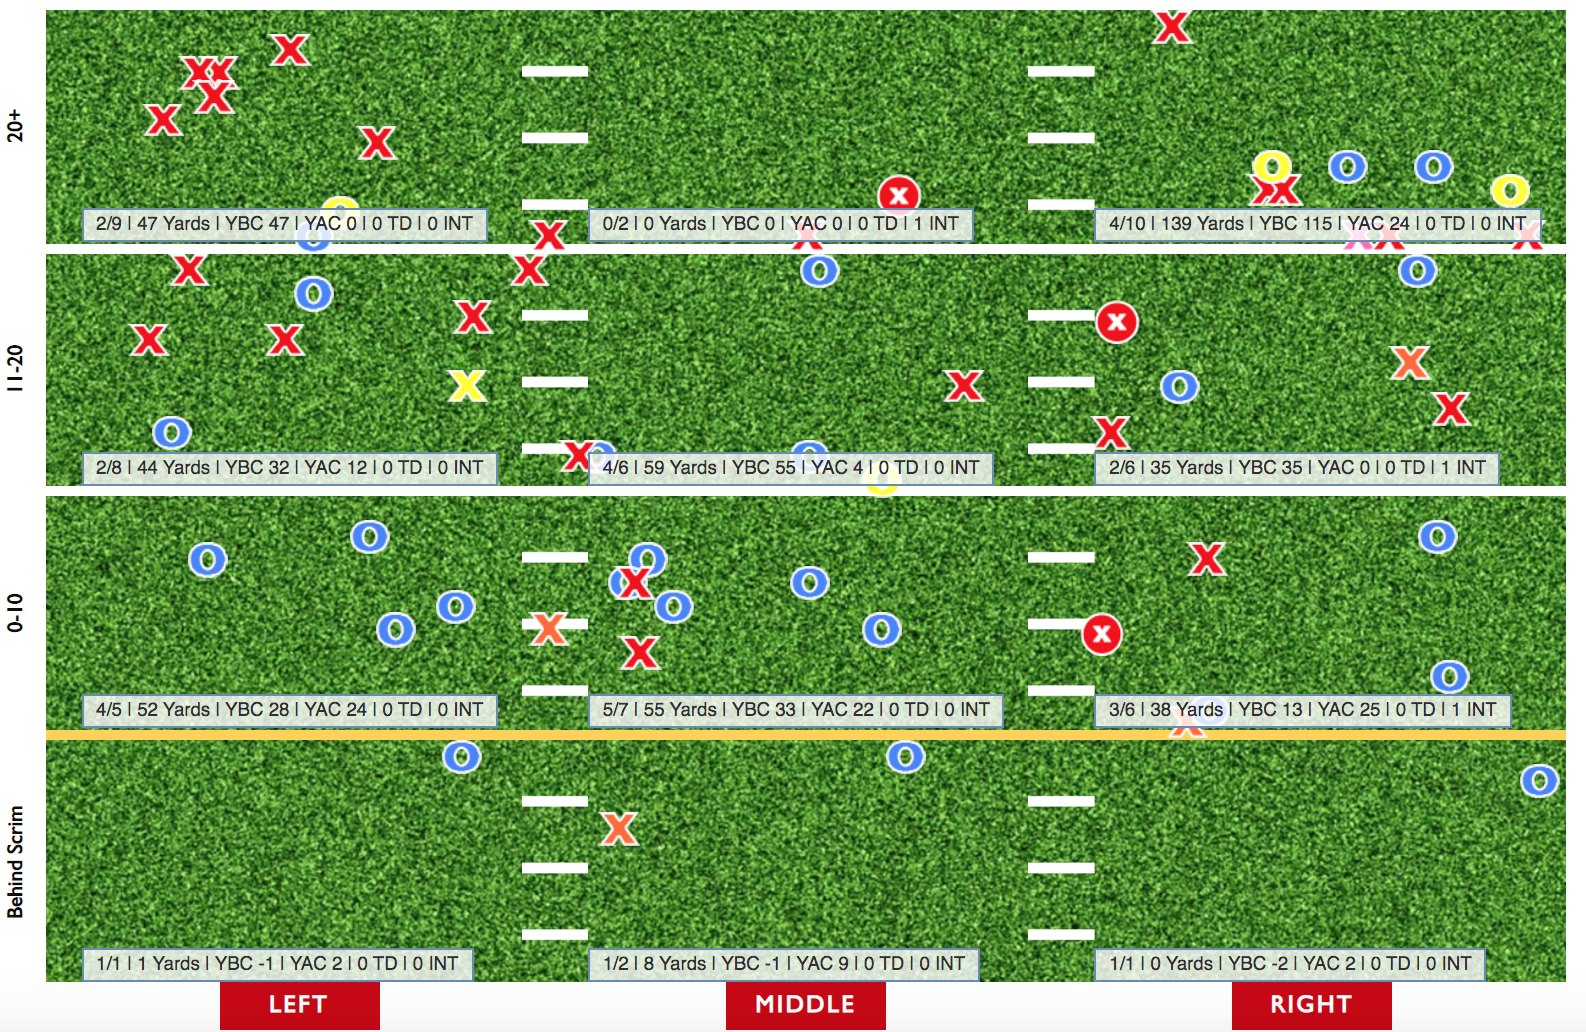
Woods was expected to lead this unit on the field as a sophomore. He led the team in touchdowns and shared the team catch crown with O'Grady with 33. But his Success Rate was one of the worst around. His 10.3% Drop Rate and his yards/target were also very crappy. His Catch Chart tells us only 47% of his targets less than ten yard downfield ended in completions (bottom right). But Woods found ways to win deep. In fact, only four other receivers in the SEC did a better job at that in 2019. Plus, Woods was one of eight SEC players to rack up over 200 deep receiving yards this past season. Winning deep allowed him to sport a team-high 69.1% Depth Adjusted Catch Rate. Despite his laudable deep catching stats, only 7.35% of his catches resulted in a gain of 20 or more yards -- a team low. Sure, Woods could win deep. But he was not a threat after the catch. No other SEC receiver averaged less yards after the catch than his 2.29 average. On 3rd Downs, only three receivers in the conference had a lower Success Rate.
Like Burks, Trey Knox was another freshman receiver that started to earn more PT. Though he played in the opener, Knox only logged action in eight games this season. His first season was riddled with inconsistency due to his youth and Arkansas terrible aerial assault. He really didn't stand out in any way for the Hogs. But his 33.3% Success Rate within the Red Zone was the highest clip of the team's four main targets. He was mainly targeted deep. Though second on the team, his average depth of target was the 11th highest in the SEC. He suffered from his fair share of uncatchable passes, but Arkansas' passers fed him a lower rate of those compared to others. Still, no Razorback receiver had a lower Catch Rate. His 46% clip was second worst in the conference. Per his Catch Chart (bottom left), over 60% of his targets occurred ten or more yard downfield.

Arkansas' run game posted the fourth worst Success Rate, third worst Explosive Run Rate, and sixth worst yards/carry average within the SEC. But compared to their passing game's production, that was an upgrade. Boyd was the lone bright spot as a ball carrier, and Arkansas' efficiency noticeably dipped when he wasn't in there anchoring the offense. Though the poor down-to-down success doesn't reflect as much, Arkansas OLine was still one of the best in the conference at forging run lanes. Both their Run Havoc Rate and their average yards before contact per rush sat inside the SEC's top4.
Whaley attempted to take carries away from Boyd. But as the year progressed, it was clear Boyd had to be maximized if this offense wanted to stay afloat. Only one other SEC rusher had a lower Rushing Success Rate and average yards after contact than Whaley's 34.9% and 1.84 clips, respectively. Whaley failed to place within the top half of SEC rushers in any major analytic category. While Boyd certainly benefited the most from his line's ability to push people around, defenses still were able to contain him. His First Down+Touchdown Rate along with his Broken Tackle Rate ranked within the conference's bottom 10. Plus, his Explosive Run Rate was rather middling by SEC standards. But while he wasn't the best at squirting out of tackles on the reg, his average yards after contact was above average. It is rather interesting, however, that while his OLine did a good job run blocking, both of Arkansas' two main ball carriers suffered from high Negative Run Rates. Boyd was the 11th best SEC ball carrier to turn contact behind the line of scrimmage into a gain, but nearly a tenth of his tries went for a loss. In the end, Boyd accounted for over 61% of the Hogs' rush yards -- and 64% of their production after contact.

Arkanas posted superior rush numbers in terms of yard/carry on rightward runs. Seeing that over 60% of their explosive runs went that direction, that's a simple explanation as to why. In terms of down to down success, leftward and rightward runs had similar clip, but the sinister ones finished with a higher clip by about a percentage point.
Arkansas' passers were never much threats to run. But their backups were much more inclined to make plays with their legs. Starkel and Hicks combined to total on seven designed rush attempts all season. KJ Jefferson, John Stephen Jones, and Jack Lindsey individually met or exceeded that number. Jefferson being given the green light down the stretch was used plenty in the Q-Power game with Power Toss andPower Veer reads and Counters. All but two of his 23 designed carries came during the last three weeks of the season. Those 23 totaled the third most on the team and his 52.2% Success Rate was the highest on the team among rushers with at least seven chances. While Jefferson looks to have some promise, he probalby will have to wait around a minute before he's given another shot to signal call for the Razorbacks with the news of incoming transfer Feleipe Franks.