Sideline to Sideline: CFP Lawrence vs. Burrow
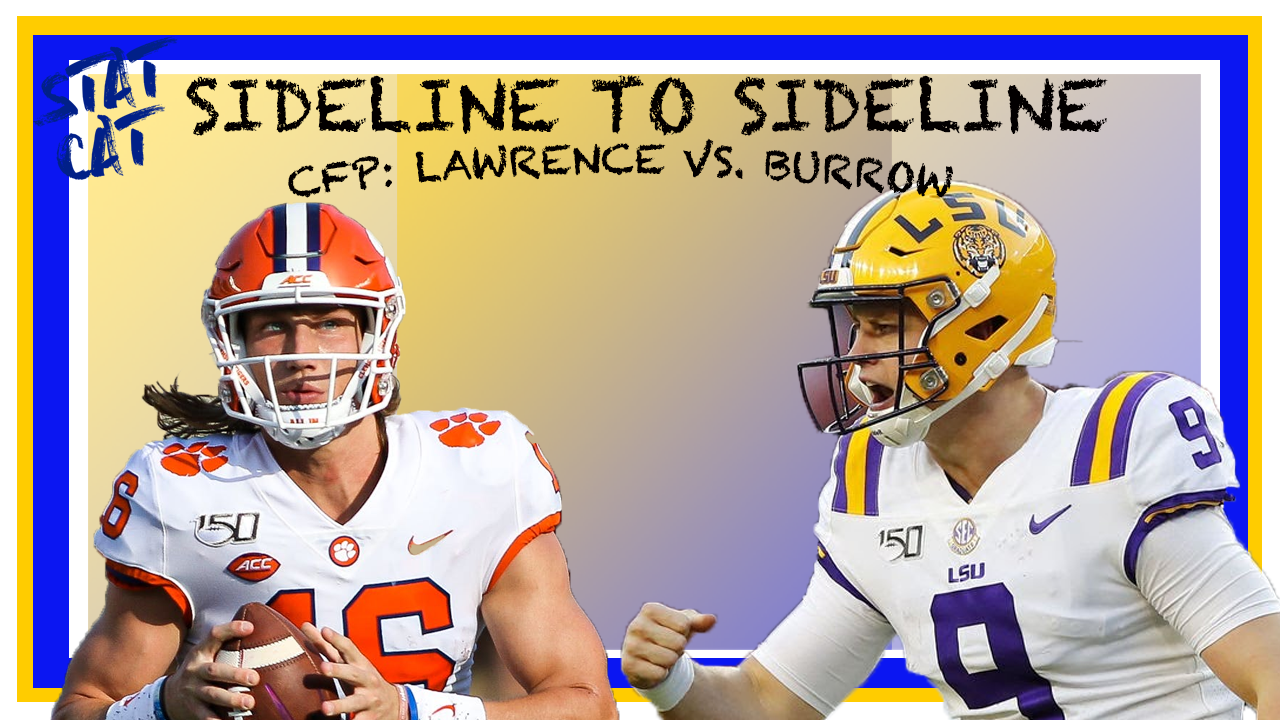
Cool Joe vs. Sunshine
Narratives surrounding QB play are rather cliche and part of any pregame coverage. But as cliche as that premise is on its head, I promise I will give you information on these passers you won't find anywhere else.
In this instance, "Who would you rather have?" could extend far beyond the 2020 Playoff. Last season during his coming out party, Trevor Lawrence quickly was labeled as the next "cant-miss" NFL prospect as he slung Clemson all the way to the title. Burrow turned a middling debut season in the bayou into one of the most impressive passing seasons in the history of the game.
Lawrence is tall, slender and likes to throw the ball on a rope to show off his rocket arm. Burrow is slinky, gritty and hella accurate. Both are dual threats and can beat defenses with their legs. Both are destined for careers in the pros.
| 2019 Overall Y/A | 2019 Overall Completion% | Vs. Top5 SP+ Y/A | Vs. Top5 SP+ Completion% | |
| Lawrence | 9.27 | 67.6% | 8.53 | 65.4% |
| Burrow | 10.9 | 77.6% | 10.2 | 77.5% |
With the special season Burrow had, he essentially trumps Lawrence across the board. But we can still get a very good idea of how differently these passers operate within their respective offenses.

Production vs. 4 Best Defenses Faced per ESPN's SP+ and CFP Semifinal Burrow's Sample: Florida, Auburn, Alabama, UGA, and Oklahoma Lawrence's Sample: TAMU, UNC, SCar, Virginia, Ohio State | Short Accuracy% | 10+ Accuracy% | Pressure Rate | Screen Rate | RPO Rate | Average Depth of Target | 5 Yards or Less Makeup | 6-10 Yards Makeup | 10 Yards or More Makeup |
| Lawrence | 76.7% | 53.9% | 28.5% | 10.3% | 16% | 10.2 | 41.7% | 13.5% | 44.8% |
| Burrow | 85.7% | 60.0% | 23.1% | 2.75% | 10.9% | 9.85 | 51.2% | 15.9% | 32.9% |
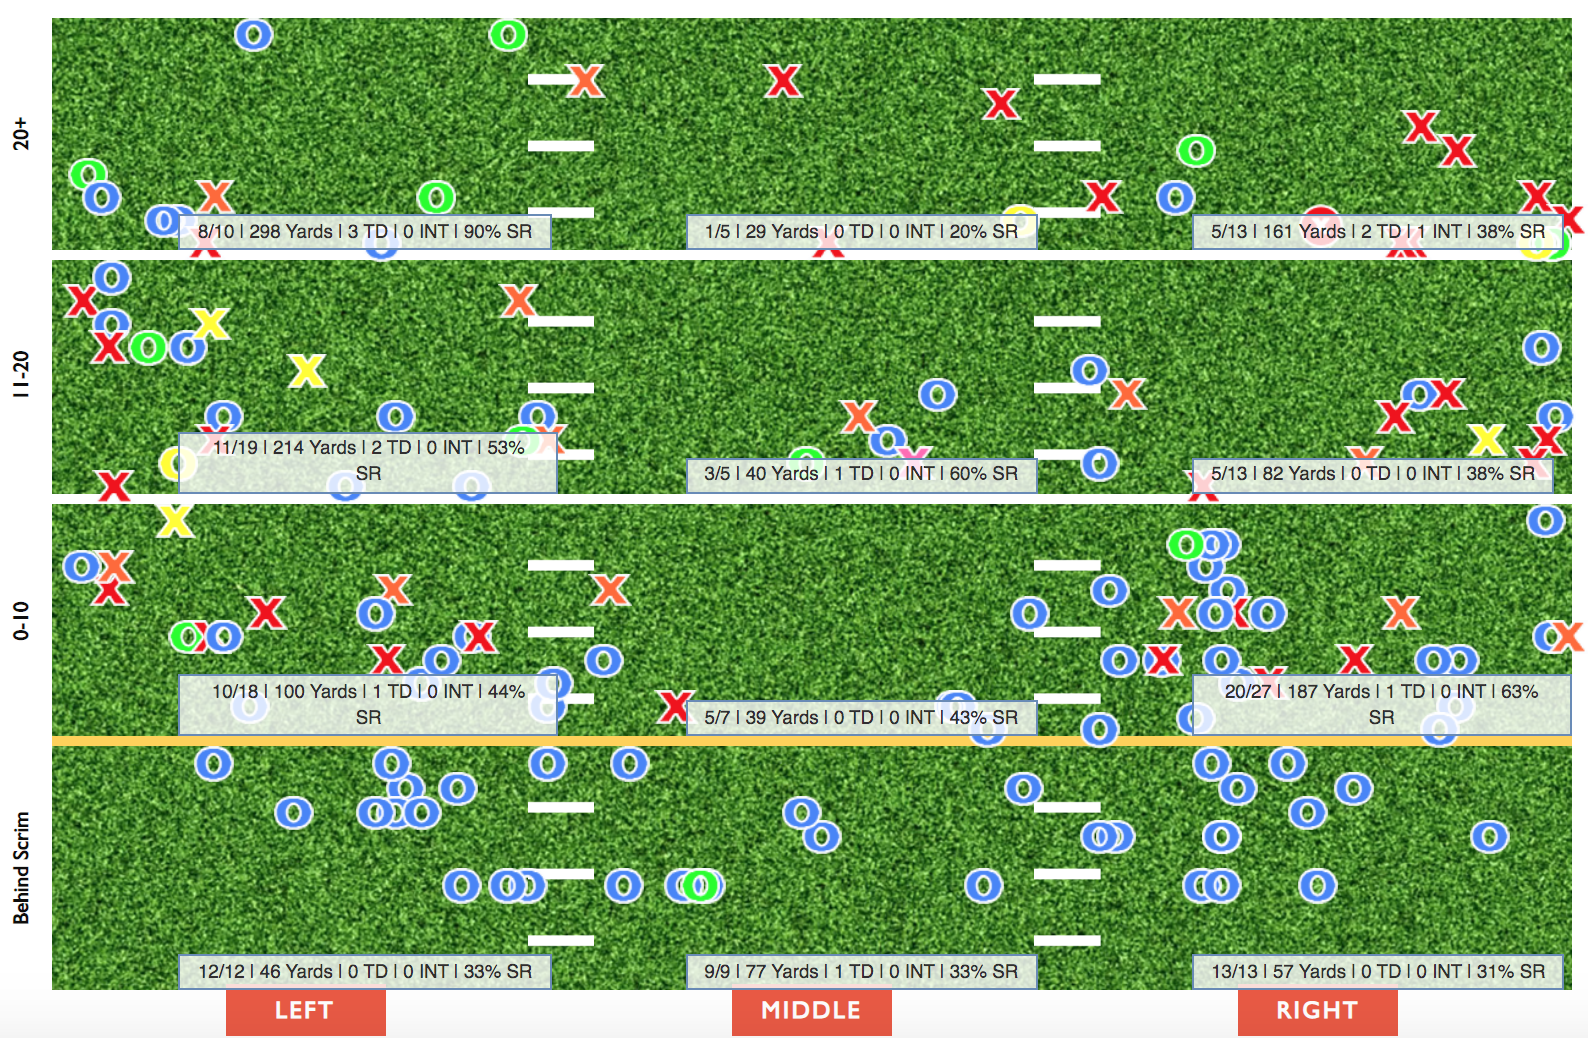
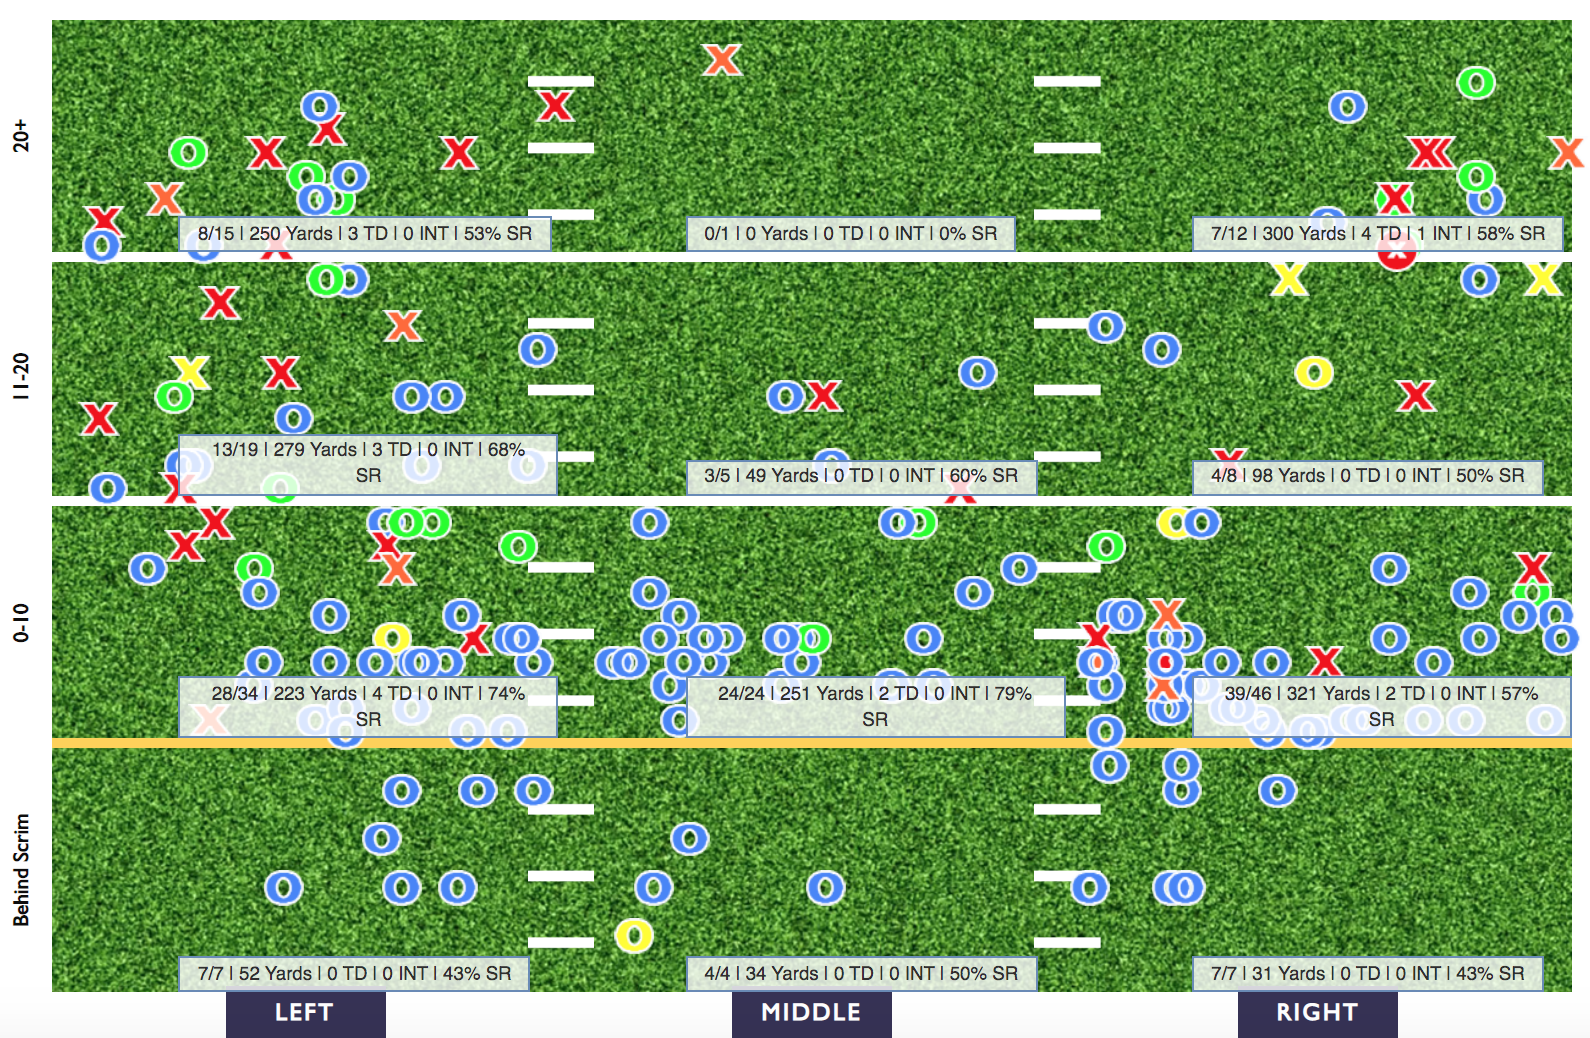
By looking at his pass chart, Burrow has no problems attacking the underbelly of defenses and being precise on point blank targets. Over half of his attempts versus LSU's hardest opponents have been five yards or less downfield. With the threat to take the top off of defenses on any given snap, more room has opened up short. Four of the six short areas have at least a 50% Success Rate for LSU compared to one of six for Clemson. This is a testament not only to their scheme for being advantageous but also their players' ability to consistently produce with machine like efficiency.
Despite Burrow targeting short far more often, Lawrence leans much more on RPO Throws and Screens for his completions. Over a quarter of Lawrence's attempts against Clemson's best foes have been one or the other. His clip basically doubles Burrow's. As I stated above, Clemson has been dreadful executing RPO Outlets and True Screens. Their wideouts are better suited to win downfield that in space in the flat or work avenues after the catch.
With the run-first approach on early downs, Lawrence often has to pass behind the chains. 38.5% of his attempts have occurred on either 2nd or 3rd Down with 7 or more yards to gain. Whether by circumstance or design, Sunshine has an average depth of target over ten yards with just under 45% of his attempts traveling over ten yard downfield. He's been accurate on the good majority of his tosses. While he's been ho-hum on intermediate throws, Lawrence has been sharp targeting deep throws to the left. There, he's gone 8/10 for 298 and 3 TDs. Oh, and one of those passes was dropped. Overall, 53.6% of his throws 20 or more yards downfield have been completed.
Burrow has the exact same Deep Passing Success Rate, but he has the clear edge in accuracy. His Accuracy% on throws 10+ yard downfield and 20+ yards downfield are comfortably ahead of Lawrence's.. Plus, he has been able to distribute equal efficiencies on both sides of the field. A quarter of Burrow's deep throws have resulted in scores against some of the best defenses in the country. LSU likes to schematically manufacture deep shots off play action. Just under 47% of Burrow's deep passes have used play action, which is over ten percentage points higher than Lawrence's rate.
Both of these passers see an increase in their Play Action Rates against better defenses. About 31% of Burrow's dropbacks have used off play fakes, but Lawrence is even more reliant on actions. Over 43% of his attempts have been play actions.
This is one aspect where TLaw has a clear advantage. Burrow is still more consistent in terms of Success Rate and has a higher Touchdown Rate. But Lawrence has displayed superior downfield accuracy off play fakes. His Depth Adjusted Accuracy on these attempts is nearly 16 percentage points higher and his Adjusted Completion% is over 11 points higher than Cool Joe's when using play action. Lawrence sports his best Explosive Pass Rate in these spots with an 18.8% clip despite a subpar average depth of target by SEC standards. His yard/attempt off play action is over three yards better than his average from clean pockets.
| Clean Pockets vs Top5 Opponents per ESPN's SP+ | Success Rate | Accuracy% | Depth Adjusted Accuracy% | Adjusted Completion% | Yards/Attempt | Explosive Pass Rate | Touchdown Rate | Interceptable Rate | Attempt Makeup |
| Lawrence | 52.3% | 71.2% | 57.2% | 80% | 8.70 | 14.4% | 7.21% | 4.50% | 72.6% |
| Burrow | 60.7% | 74.3% | 58.6% | 82.3% | 9.89 | 14.3% | 10.0% | 0.71% | 74.9% |
| Average SEC QB | 48.1% | 64.2% | 47.2% | 72.1% | 8.01 | 10.8% | 5.48% | 6.56% | ---- |
| Under Pressure vs Top5 Opponents per ESPN's SP+ | Success Rate | Accuracy% | Depth Adjusted Accuracy% | Adjusted Completion% | Yards/Attempt | Explosive Pass Rate | Touchdown Rate | Interceptable Rate | Attempt Makeup |
| Lawrence | 31.1% | 48.9% | 41.6% | 68.8% | 8.09 | 13.3% | 6.67% | 4.44% | 27.4% |
| Burrow | 59.5% | 80.9% | 73.7% | 87.2% | 11.1 | 14.3% | 9.52% | 0.00% | 25.1% |
| Average SEC QB | 32.5% | 41.5% | 35.1% | 57.2% | 5.90 | 9.32% | 5.22% | 8.80% | --- |
Evaluating production out of clean pockets is a great prognosticator for a passer's ceiling. After all if a quarterback can't deliver accurate throws when conditions are perfect, how can you expect him to sling the pill with precision when facing pressure consistently?
Both Burrow and Lawrence post similar numbers from clean pockets versus their best opponents. Pro scouts should be pleased with their numbers as the pair are well above the SEC average. Still, Burrow has been more successful, accurate, less prone to interceptable passes, and more inclined to toss a touchdown.
Against pressure, Burrow has clearly performed better than Lawrence. Across the board, Cool Joe has better advanced figures than Sunshine. Burrow's accuracy in particular has been undeniably awesome. With a raw Accuracy% of 80.9% and a jaw-dropping 73.7% Depth Adjusted Accuracy, Burrow's precision under pressure is basically double the SEC average despite being against some of the nation's best defenses.
While Lawrence has a subpar Success Rate by SEC standards, he has solid metrics in other areas. But, they are dwarfed by Burrow's numbers and are considerably worse than his production from clean pockets. It would be wise for LSU to get after Lawrence early and often. He can be deadly when kept clean, but Lawrence is mortal when under pressure. For what it's worth, LSU's defense had a Pressure Rate of 27.4% coming into the College Football Playoff, which is awfully close to Lawrence's average against his toughest competition.
Before I wrap this up like leftover holiday ham, we must see how these two titans have done on the money down. While both offenses are great at limiting their chances on the do or die down, the champion certainly can be decided by whomever prevails on thirds.
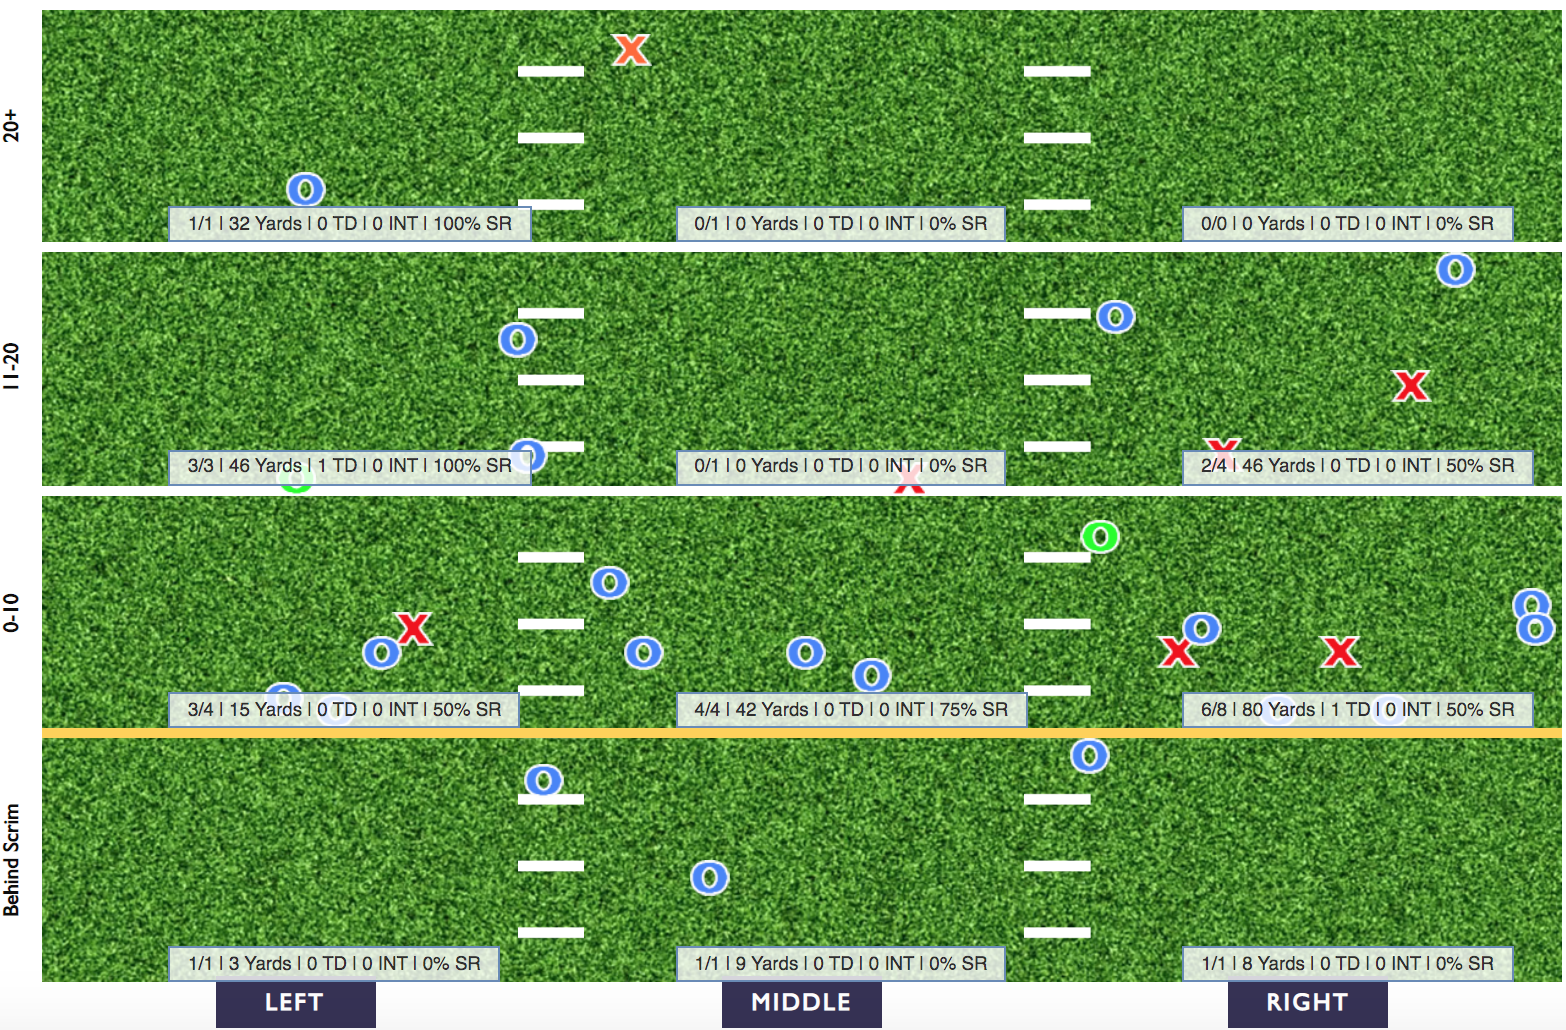
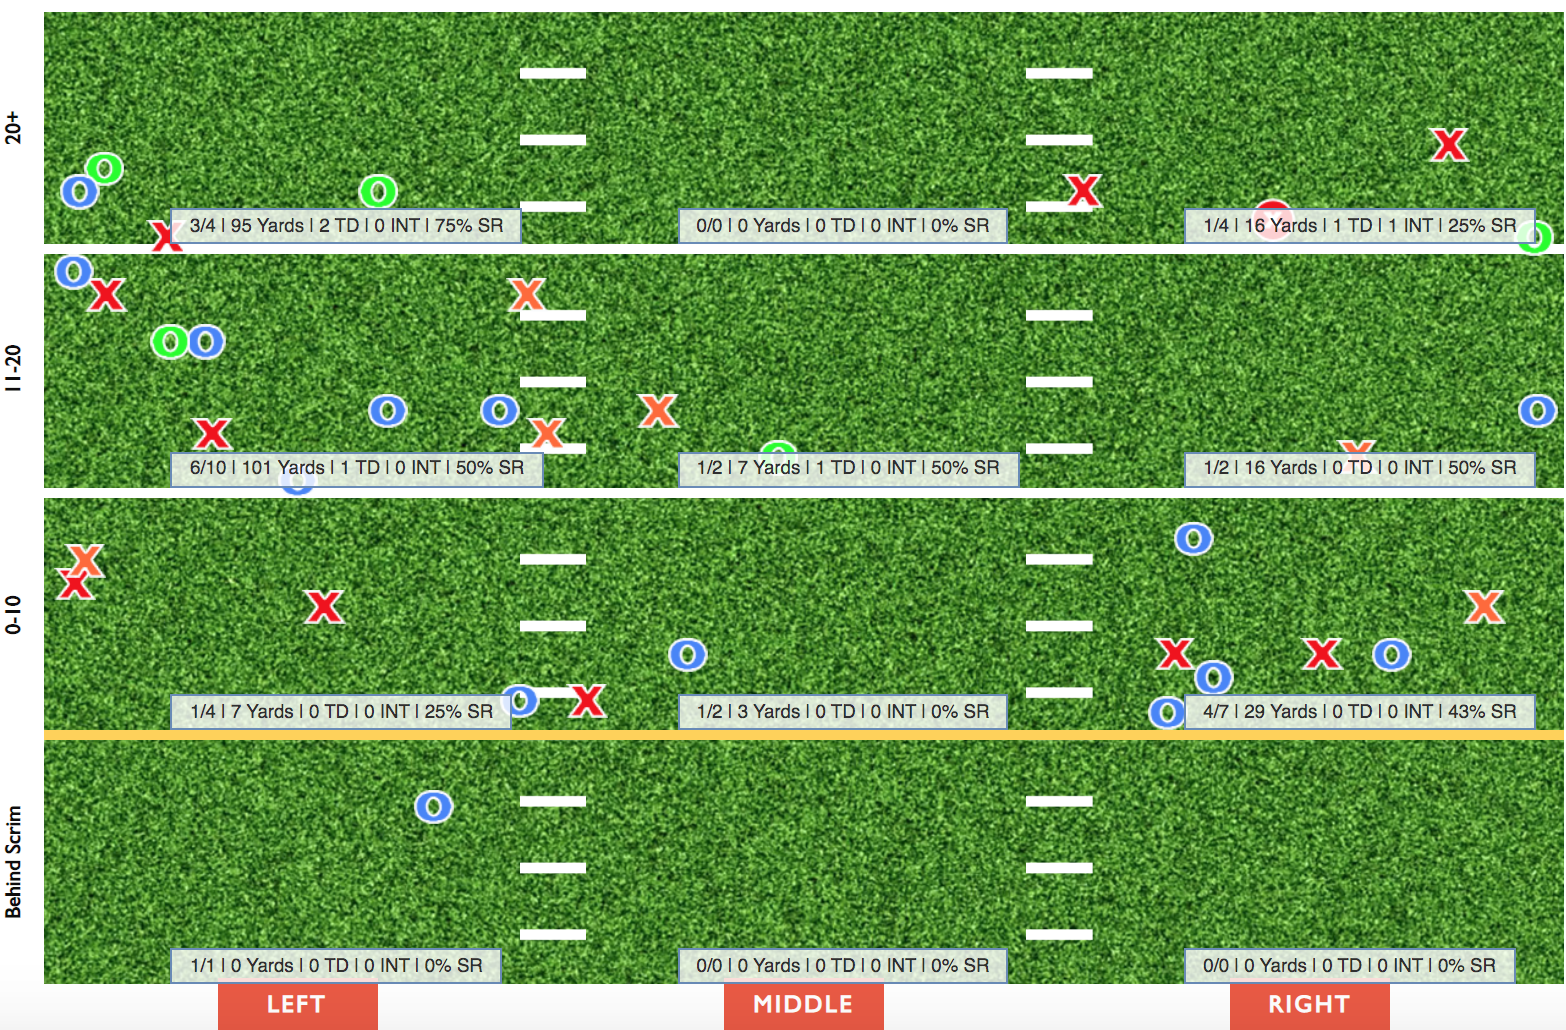
Against his tougher foes, Lawrence's receivers have had a drop problem. Accurate pass or no, a sixth of his money down attempts have been dropped. In general, he's had to do a lot more heavy lifting than Burrow in order to convert. LSU's offense averages 6.71 yards to gain on 3rd Downs against their elite competition, which is a yards and a quarter less than Clemson. Not only is Lawrence's degree of difficulty higher in that regard compared to Cool Joe, but his passes often travel much further on average. On thirds versus his best opponents, Lawrence average depth of target is 14.1 yards compared to 8.74 yards for LSU.
It's far easier to deliver accurate passes to closer targets than ones further away. Captain Obvious wanted me to make sure you all were aware of that. Burrow's Accuracy%, Depth Adjusted Accuracy%, Adjusted Completion%, and Success Rate all edge out Lawrence's numbers by a substantial amount. Despite facing more pressure in these spots, Burrow is also more prone to toss an explosive and far less likely to throw a turnover-worthy attempt.
Burrow has a 50% Success Rate, 74.6% Depth Adjusted Accuracy, 17.9% Explosive Pass Rate, and 9.43 yards/attempt when passing on the money down against some of the best defenses around.
Lawrence with his back against the wall is a dangerous beast. In these instances, he has an incredible 13.2% Touchdown Rate and a worrisome 7.89 Interceptable Pass Rate. Since he is generally asked to do more on these downs, he plays far more aggressive, which is a double-edged sword. Sometimes it results in a big play touchdown, but sometimes he is downright careless. I've already mentioned Lawrence's numbers significantly worse when under duress. Well, his overall Pressure Rate increases nearly ten percentage points to 36.8% on 3rd Downs against his best defensive opponents.
In a one game sample, anything is possible. Both passers have sound track records and it will be a major stunner if one or both come out with total duds in the title game. This is a contest that will soon be dissected 1,000 times over the offseason by NFL front offices nitpicking these two quarterback's ceiling.
Sunshine vs. Cool Joe, can't wait.